Insight
March 29, 2017
R&D Funding in the First Year of Trump’s Administration
Some have reacted to President Trump’s proposed budget by claiming that it severely reduces funding for science, yet the net impact isn’t likely to dramatically change the overall level of research and development (R&D) funding. Instead, the budget blueprint would likely shift the mix of funding at the federal level, away from basic research and into applied research and development. New data from the National Science Foundation (NSF) on 2015 R&D funding levels helps to flesh out potential impacts. More importantly, the data also show that broader changes in R&D funding have occurred.
Research and development spending bundles together three distinct kinds of activities: basic research, applied research and development, sometimes call experimental development. Basic research, by its very definition, is not directed towards a goal. So, while therapies for cancer might come as a result of basic research, basic research isn’t aimed to cure diseases or solve practical problems. Applied research aims to achieve these goals, since it deals with solving practical problems. Development spending tallies the monies spent bridging the research into consumer products.
While the 1950s is sometimes thought of as a time of expansive research funding, official data suggest otherwise. As a percentage of GDP, the level of funding directed towards research and development was near all time highs in 2015 at 2.78 percent, just shy of the record in 2009 of 2.81 percent.
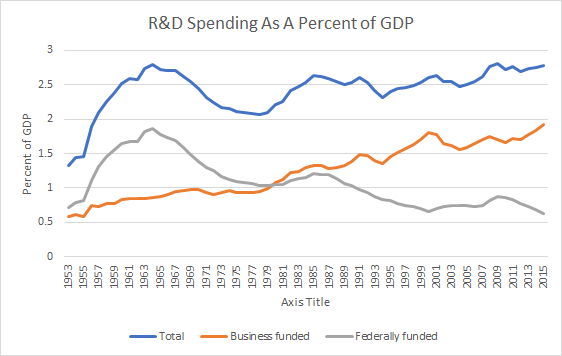
Overall funding for R&D increased by 4.5 percent between 2014 and 2015, driven completely by industry investments. Much like years before it, 2015 saw the predominant share of R&D come from business and go into development. The increase in 2015 was similar to yearly changes in 2014 and 2013, but lower than the 7 percent increases seen over 2005 to 2008.
R&D performed by academic institutions has seen strong growth. After adjusting for inflation, this sector grew on average 2.56 percent annually from 2009 to 2015, ahead of total R&D, which grew at 1 percent.
Internationally, the US continues to rank near the top of R&D spending per GDP, besting both the European Union as a whole and China. Yet, Israel, Korea, Japan, Sweden, Austria, Taiwan, Denmark, Finland and Germany all spend more as a percentage of GDP.
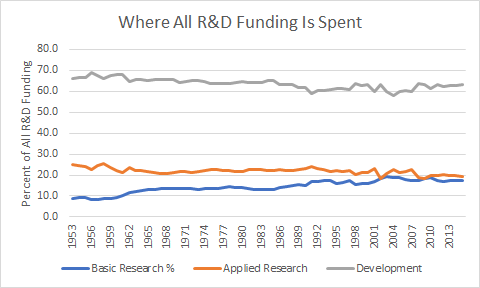
As the chart below helps to show, dramatic shifts in the mix between these three kinds of spending haven’t occurred. Contrary to a consistent trope, basic research has actually inched up in prominence over time, rising from 8.9 percent of R&D funding when the data series began in 1953 to 17.4 percent in 2015, driven by business. In total, business contributed 28 percent of the basic research, doubling the amount spent in 2009, while the federal government funded 44 percent of basic research in 2015.
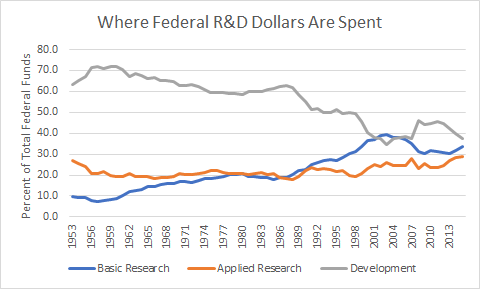
Yet, the federal government is a different story. It has shifted where it spends R&D monies. The long term trend has been away from development, which has been taken up by business, and into basic research as the chart below displays.
Funding cuts at the National Institutes of Health suggested by President Trump would likely reduce the absolute amount of spending in basic research, since this agency conducts the lion share of federal spending.
| Federal Spending in Basic Research in Millions by Agency* | |||||||
| 2009 | 2010 | 2011 | 2012 | 2013 | 2014 | 2015 | |
| National Institutes of Health | 17599 | 17842 | 17365 | 16937 | 15947 | 16252 | 15174 |
| National Science Foundation | 4451 | 5077 | 5039 | 4956 | 4568 | 4865 | 5053 |
| Department of Energy | 4237 | 4395 | 4316 | 4167 | 4033 | 4212 | 4547 |
| National Aeronautics and Space Administration | 1005 | 924 | 1298 | 3388 | 3089 | 3418 | 3261 |
| Department of Defense | 1951 | 2008 | 2036 | 2141 | 1991 | 2166 | 2261 |
| Department of Agriculture | 1013 | 1097 | 1012 | 987 | 869 | 1021 | 1009 |
| All Other | 1184 | 1102 | 1257 | 1302 | 1131 | 1103 | 1122 |
The Department of Defense spends the most of any agency in all three categories of research and development. So, funding increases to Defense with the aim of reducing the effect of sequestration would likely bump up some of their R&D activities. While the Environmental Protection Agency has been slated for cuts, it isn’t a big part of federal R&D expenditures.
| Federal Spending of All R&D in Millions by Agency* | |||||||
| 2009 | 2010 | 2011 | 2012 | 2013 | 2014 | 2015 | |
| Department of Defense | 90,968 | 91,744 | 85,806 | 79,313 | 68,632 | 68,473 | 67,194 |
| National Aeronautics and Space Administration | 9,811 | 10,250 | 9,869 | 12,052 | 11,518 | 12,101 | 11,594 |
| Department of Energy | 11,500 | 11,992 | 11,576 | 11,516 | 11,210 | 12,349 | 14,612 |
| Health and Human Service | 34,674 | 35,145 | 33,822 | 33,420 | 31,208 | 31,577 | 30,655 |
| National Science Foundation | 5,322 | 5,967 | 5,959 | 6,077 | 5,580 | 5,972 | 6,085 |
| United States Department of Agriculture | 2,721 | 2,889 | 2,565 | 2,483 | 2,216 | 2,450 | 2,493 |
| Department of the Interior | 783 | 859 | 821 | 873 | 822 | 865 | 878 |
| Department of Transportation | 1,033 | 1,188 | 1,035 | 979 | 857 | 821 | 901 |
| Environmental Protection Agency | 628 | 660 | 631 | 605 | 555 | 554 | 529 |
| Department of Commerce | 1,550 | 1,479 | 1,320 | 1,336 | 1,358 | 1,598 | 1,551 |
| Department of Homeland Security | 1,224 | 982 | 825 | 512 | 716 | 1,063 | 934 |
| Department of Veterans Affairs | 1,053 | 1,144 | 1,258 | 1,236 | 1,219 | 1,134 | 1,197 |
| Other | 1,287 | 1,252 | 1,098 | 1,408 | 1,795 | 1,651 | 1,515 |
Some argue that public spending on R&D is too low, but the data show it is at historic highs. It is commonly thought that in previous generations basic research found more support from the government, but this isn’t the case. Over time, funding has shifted towards basic research, while product development costs have been taken on by industry. In our advanced economy, reality is far more complex than a simple linear relationship between R&D spending, innovation, and economic growth. As budget talks begin, a realistic innovation policy will need to begin with a firm grounding in reality.
* Data tabulated by American Association for the Advanced of Science: https://www.aaas.org/page/historical-trends-federal-rd#Agency