Insight
September 9, 2025
The Trump Administration’s Spring 2025 Unified Agenda of Regulatory and Deregulatory Actions
EXECUTIVE SUMMARY
- The Trump Administration recently released its Spring 2025 “Unified Agenda of Regulatory and Deregulatory Actions” detailing the thousands of rulemakings agencies plan to promulgate over the next year and beyond, giving the public its first real look at the overall contours of its regulatory budget program in its second term.
- An examination of the data reveals that agencies anticipate much of their near-term activity to be deregulatory in nature, with the higher share of “regulatory” actions currently slated to come later in the term.
- The Department of Transportation claims the most “deregulatory” actions with 285, but – at least by the metrics of this report – it and virtually all other agencies fall short of President Trump’s apparent “10 rules out for every 1 in” goal.
INTRODUCTION
On September 4, the Office of Information and Regulatory Affairs (OIRA) released the Spring 2025 edition of the “Unified Agenda of Regulatory and Deregulatory Actions” (UA). The biannual report lays out “the actions administrative agencies plan to issue in the near and long term.” While the spring of 2025 is well behind us, this UA still serves as an important document since it gives the public the first overall accounting of the rulemakings the administration has planned for its regulatory budget under Executive Order (EO) 14192. In broad strokes, the UA data reveal that the Trump Administration expects to be quite active on the deregulatory front in the near-term and has a large portion of its rulemakings designated as “regulatory” on the backburner for now. With 285 “deregulatory” actions, the Department of Transportation (DOT) is able to claim the mantle of most deregulatory agency, but even with that lofty figure, it – and essentially all other agencies – are not on track to meet the EO’s 10-to-1 deregulatory-to-regulatory rulemaking goal.
OVERALL REGULATORY VOLUME
One of the more helpful aspects of a given UA is that it can demonstrate the scope of an administration’s regulatory plans. The following table includes statistics on the volume of prospective actions included over the past decade of Spring UAs. “Active” items include those that agencies reasonably expect to act on within 12 months of the UA’s publication. “Long-Term” items are those that agencies expect to act on outside of that one-year window. The “Total Prospective” category is the sum of those two. “Major” items include rulemakings that agencies expect to meet the definition of a “major rule” under the CRA. “Significant” items include those that carry the designation of either: a) “economically significant” as established under EO 12866 (and/or the relevant designation as modified under EO 14094), or b) “other significant” items that OIRA defines as a “ rulemaking that is not economically significant but is considered significant by the agency.” Further, “[t]his category includes rules that the agency anticipates will be reviewed under EO 12866 or rules that are a priority of the agency head.”
| Trends in Rulemaking Volume Across Spring Unified Agendas | ||||||||||
| Year | 2016 | 2017 | 2018 | 2019 | 2020 | 2021 | 2022 | 2023 | 2024 | 2025 |
| Active Items | 2,239 | 1,731 | 2,224 | 2,597 | 2,697 | 2,551 | 2,673 | 2,617 | 2,361 | 2,102 |
| Long-Term Items | 502 | 696 | 647 | 610 | 575 | 623 | 574 | 582 | 648 | 807 |
| Total Prospective Items | 2,741 | 2,427 | 2,871 | 3,207 | 3,272 | 3,174 | 3,247 | 3,199 | 3,009 | 2,909 |
| “Major” Active Items | 125 | 49 | 88 | 123 | 155 | 170 | 217 | 236 | 193 | 111 |
| “Major” Long-Term Items | 43 | 51 | 34 | 30 | 40 | 47 | 38 | 44 | 42 | 79 |
| Total “Major” Items | 168 | 100 | 122 | 153 | 195 | 217 | 255 | 280 | 235 | 190 |
| “Significant” Active Items | 800 | 429 | 707 | 919 | 974 | 945 | 1,055 | 1,042 | 892 | 753 |
| “Significant” Long-Term Items | 208 | 299 | 222 | 218 | 218 | 262 | 263 | 284 | 275 | 306 |
| Total “Significant” Items | 1,008 | 728 | 929 | 1,137 | 1,192 | 1,207 | 1,318 | 1,326 | 1,167 | 1,059 |
The most interesting dynamic in these Spring 2025 totals is the divergence in trends between “active” and “long-term” actions. The figures from the former, across all associated categories, are relatively middle-of-the-road compared to the past decade’s worth of Spring UA data. The latter category (long-term actions), however, reaches the highest levels seen over this period. It is difficult to immediately discern what caused this “long-term” action spike.
One would expect to see a relatively high number of long-term action entries at the start of a given administration that wanes over time as the various agencies work their way through that initial agenda, and the White House recognizes the limited time it has left to execute its policies. For instance, the Spring 2009 UA, the first of the Obama Administration, had 821 long-term actions listed. By way of comparison, the Spring 2013 UA – the first edition of Obama’s second term – had only 465 such entries. This current situation is, of course, complicated by Trump serving two non-contiguous terms. Nevertheless, with the understanding that this administration is constitutionally limited to merely this term, it seems curious that it is apparently holding off on so many items until the back end of this term.
EO 14192 IMPLICATIONS
With this being the first UA of the second Trump term, it provides the public the best view yet of what to expect from the administration’s regulatory budget plans under EO 14192 over the next year or so. The “Executive Order 14192 Designation” section of each entry includes a series of potential categories. For this analysis, however, the most pertinent items are those the agencies have affirmatively declared to be either “regulatory,” “deregulatory,” or “exempt” for the purposes of EO 14192. These collections of rulemakings cover just under half of all UA entries. The following charts illustrate the relevant share of these designations across the cohorts of “Completed Actions” (those “the agency has completed or withdrawn since publishing its last agenda”) and the aforementioned “Active Actions” and “Long-Term Actions.”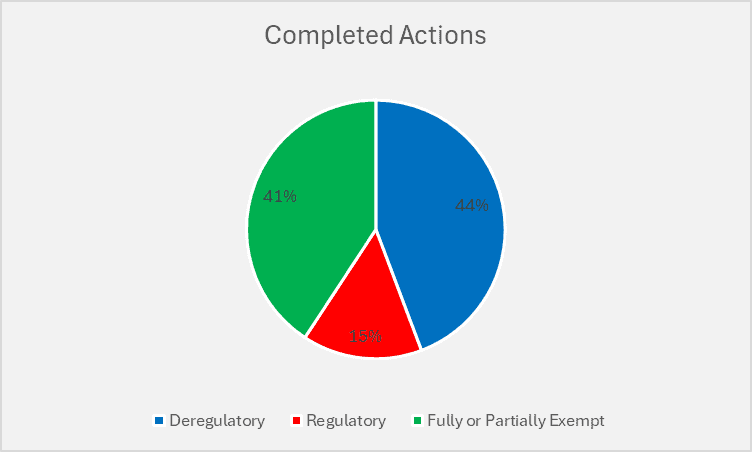
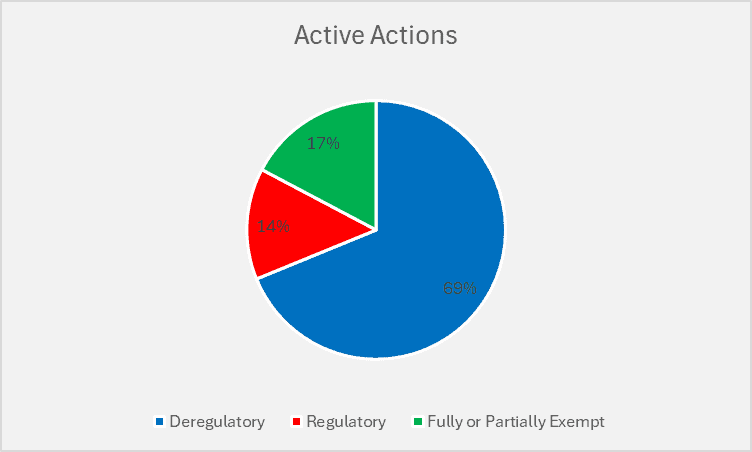
 The data suggest that, unsurprisingly, agencies have been and will continue to be focused for the next year or so on favoring deregulatory actions over regulatory ones. An interesting wrinkle is that agencies have explicitly designated such a sizable contingent (roughly 41 percent of the sample) of their completed actions thus far to be “exempt” from EO 14192 consideration. That share drops roughly in half for items agencies expect to put forward over the next year. Indeed, nearly 70 percent of the relevant items are officially set to be “deregulatory” for the near future. Things then take a turn in the Long-Term Action distribution with nearly half of those actions carrying a “regulatory” tag. This trend may provide further context to the question above regarding the overall increase in long-term actions. These data suggest that the administration may have some sizable contingent of regulatory actions in mind but clearly wants to make sure it gets the deregulatory items out first.
MAJOR TRENDS ACROSS AGENCIES
Another aspect of EO 14192 implementation on which this UA provides some insight is which agencies are most active in promulgating certain kinds of rulemakings. The following tables lay out the top 10 agencies in terms of UA entries categorized as “deregulatory,” “regulatory,” and “exempt,” respectively.
Top 10 Deregulatory Agencies
| Agency | Deregulatory Items |
| Transportation | 285 |
| Interior | 111 |
| Labor | 76 |
| EPA | 73 |
| Agriculture | 69 |
| HHS | 55 |
| Energy | 54 |
| Treasury | 45 |
| HUD | 24 |
| Commerce | 24 |
DOT leads all other agencies in self-declared deregulatory actions, and by a fairly wide margin at that. Even more, 185 of those entries (more than two-thirds) are active actions, so the public can expect to see plenty of action from DOT over the next year in this regard. The top agencies behind it – the Departments of Interior, Labor (DOL), and the Environmental Protection Agency (EPA) – also have the vast majority of their “deregulatory” items in the active basket.
Top 10 Regulatory Agencies
| Agency | Regulatory Items |
| HHS | 49 |
| Transportation | 40 |
| DOL | 31 |
| Agriculture | 26 |
| Interior | 24 |
| Defense | 24 |
| HUD | 21 |
| EPA | 21 |
| Commerce | 17 |
| Treasury | 13 |
The Department of Health and Human Services (HHS) is the current leader in the clubhouse for “regulatory” actions. Of its 49 items, 36 are “active” and thus should be forthcoming in the near future. Despite its massive lead in the “deregulatory” race, DOT lands in second place with 40 such actions. DOL is also in the mix with 31 entries, although roughly half (14) of the items it lists are tagged as long-term actions.
Top 10 Exempt Agencies
| Agency | Exempt Items |
| Commerce | 107 |
| Justice | 37 |
| Treasury | 31 |
| State | 29 |
| DHS | 27 |
| FCC | 18 |
| HUD | 15 |
| HHS | 14 |
| DOL | 12 |
| Interior | 11 |
The EO’s explicit exemptions attach to rules with a “military, national security, homeland security, foreign affairs, or immigration-related function.” As such, many of the top agencies here make some degree of sense. In a surprising result, however, the Department of Commerce leads the way in terms of rulemakings it believes to be exempt from EO 14192 consideration. To be sure, items such as “Revisions to Sanctions Against Russia and Belarus Under the Export Administration Regulations” clearly fit the bill here. Yet it is less clear how something like a preliminary rulemaking to “Establish a Control Date for the Summer Flounder, Scup, Black Sea Bass, and Bluefish Recreational Charter/Party (For-Hire) Fisheries” rises to that threshold.
As this situation illustrates, the conclusions one can draw from the UA data are somewhat contingent on how a given agency categorizes its actions. Take the issue of EO 14192 ratios as an example. With 285 items designated as “deregulatory” against 40 “regulatory” actions, DOT is currently sitting at a roughly 7-to-1 ratio. That is, of course, short of the 10-to-1 goal established under EO 14192 – much less the currently purported 30-to-1 ratio recently claimed by Office of Management and Budget Director Russ Vought. The only agency that can seemingly claim to meet that goal so far is the Department of Veterans Affairs (VA) with 18 “deregulatory” items against zero “regulatory” ones.
As discussed earlier, the affirmatively designated “regulatory” and “deregulatory” actions only make up a limited subset of all entries in the UA. DOT has an additional 137 entries designated as either “Other” or “Not subject to, not significant” that it may eventually factor into its EO 14192 tabulations. Similarly with the VA, the majority of its other entries are tagged with those designations and thus there may eventually turn out to be some “regulatory” rulemakings when all is said and done. The eventual EO 14192 ratios will also factor in items such as guidance documents that the UA does not capture at all. Nevertheless, it is interesting that agencies did not make more of a point (again, in their self-reported agendas) to at least try and claim they were closer to the president’s declared goal on the rulemaking front.
OTHER KEY STATISTICS
With roughly 2,100 active items included in the pages of this UA, it is not practical to include full lists of the various potential cross-sections of rulemakings. Yet it is possible and potentially helpful to highlight the volume of items that fall into certain subcategories based upon designations attached to some rulemaking entries. Some of these totals include:
- 868 “Novel Rulemakings,” or those included in the UA for the first time;
- 94 rulemakings that agencies find “likely to have a significant economic impact on a substantial number of small entities” under the Regulatory Flexibility Act (RFA);
- 122 rulemakings that agencies expect “to have international trade and investment effects, or otherwise may be of interest to our international trading partners”;
- 15 rulemakings set for retrospective review under Section 610 of the RFA; and
- 13 rulemakings that agencies find “likely to result in a mandate that may result in expenditures by State, local, and tribal governments, in the aggregate, or by the private sector of more than $100 million in one year” under the Unfunded Mandates Reform Act.
CONCLUSION
This most recent Unified Agenda provides some useful insights into the trajectory of the Trump 2.0 regulation-cutting project. As somewhat expected, the trends in the data included point to a focus on deregulatory actions during the first couple of years with most of the “regulatory” items coming down the pike later in the term. Such a dynamic seems to align with the results seen during the first Trump term. This UA also suggests that, despite this near-term prioritization of deregulatory efforts, agencies will struggle to meet President Trump’s vaunted “10-to-1” goal – at least within the realm of fully realized, substantive rulemakings. Further information is needed to establish a fuller accounting of this administration’s regulatory budget, but this document provides a good start.