Insight
July 1, 2016
Are Today’s Renters Really Worse Off Than Their Parents?
Yesterday in an article titled “Today’s Renters Really Are Worse Off Than Their Parents,” the Wall Street Journal reported on a new study from Apartment List that claims that after adjusting for inflation, the growth in rent has far outpaced the growth in household income. On its face, it is a fairly daunting finding: since 1960, median rent has grown 64 percent, while median household income has only grown 18 percent. If household resources really stagnated this much over the last several decades, then today’s renters would surely be worse off than previous generations. Fortunately for renters, Apartment List does not fully measure how resources available to the median household have changed over time. When using Congressional Budget Office (CBO) data that incorporate three standard adjustments to household income, it is clear that incomes have indeed kept up with growing rent and have likely even outpaced rent.
First let’s start with a chart similar to the one published by Apartment List. Chart 1 tracks the percentage growth in inflation adjusted median household market income[i] and median rent costs[ii] since 1980.[iii] We collected median household income data from the 2014 Census Report on Income and Poverty in the United States and adjusted the data for inflation using the Consumer Price Index Research Series (CPI-U-RS). The median rent costs come directly from Apartment List’s report, which does not indicate which price index it used to make inflation adjustments.
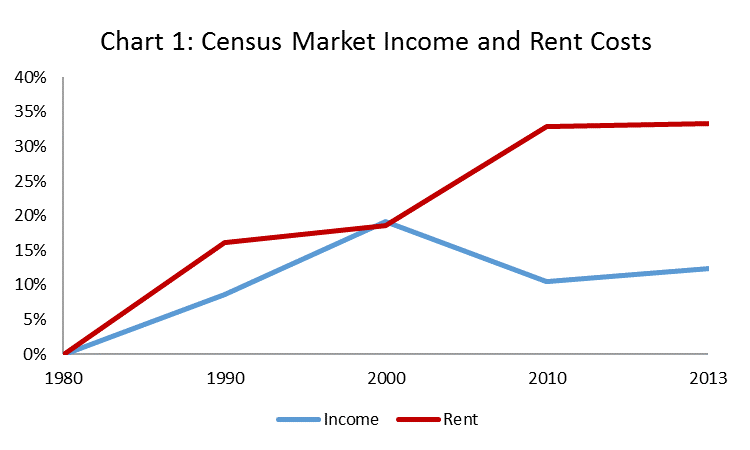
With these data, the trend is pretty similar to the one found by Apartment List: since 1980 median rent has increased 33 percent. Median household income, however, has only increased 12 percent. There was a steady increase in median household income until the 2000s when a considerable drop-off occurred due to the recession. Median income in chart 1, however, does not incorporate three standard adjustments that are necessary to validly measure household resources. In particular, median income is not adjusted for household size, government transfers are not counted towards income, and median income is not adjusted for taxes paid to the government. These adjustments are standard for taking into account how many people depend on a household’s income and all of the resources available to the household. When we use data that incorporate these necessary adjustments, we find that median household income has grown far more quickly than Apartment List indicates.
Household Size
When comparing household income over time and across the income distribution, it is necessary to adjust income earned for the number members in a household. For instance, a household with two people and a combined total income of $50,000 per year is worse off than a household with one person and the same total income. Adjusting income for household size is particularly important given than average household size has been declining over the last several decades. For its 2013 report, The Distribution of Household Income and Federal Taxes, CBO adjusts income for household size by using the standard method of dividing income by the square root of number of people in the household.[iv]
As seen in Chart 2, when using CBO’s income data that are adjusted for household size, the gap between rent and household income growth narrows substantially.
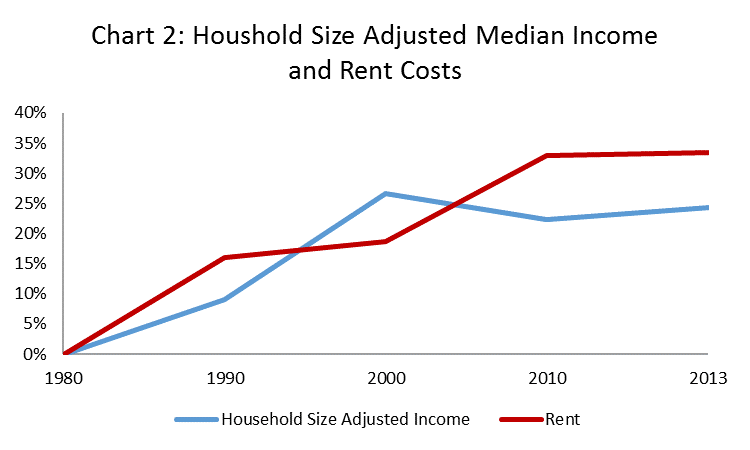
With the household size adjusted CBO figures, almost all of the discrepancy between household income and rent costs disappears. Specifically, the growth in median household income since 1980 doubles from 12 percent to 24 percent.
Government Transfers
In addition to failing to take into account household size, Apartment List’s finding does not take into account the impact of government benefits on resources available to households and renters. There are a variety of transfer programs that can directly affect the amount of rent payments (HUD rental assistance programs) as well as programs that can affect a renter’s ability to pay rent (unemployment insurance payments, Social Security payments, Medicaid, etc.). Making this adjustment, in effect, accounts for one way the government redistributes resources to assist low- and middle-income households.
When utilizing CBO income data that incorporate government transfers, one finds that since 1980 the growth in median household income has outpaced the growth in median rent. Chart 3 displays this trend.
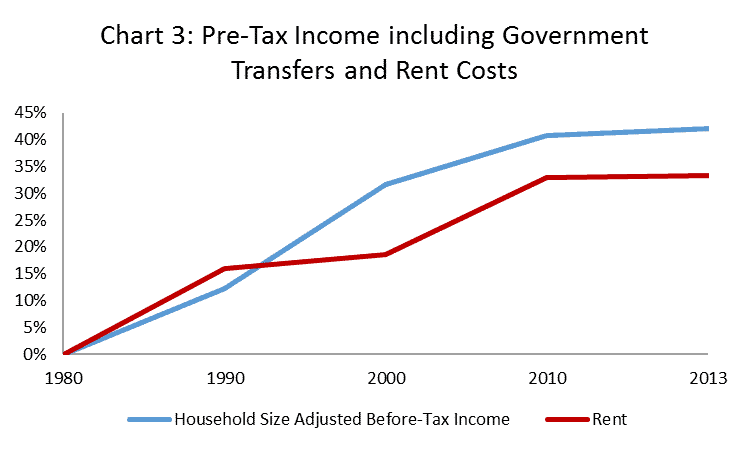
When including government transfers, median household income has grown 42 percent since 1980. This means that under this measure, the resources available to the median household has grown 9 percentage points more than the 33 percent growth in median rental costs.
Taxes
Finally, it is also important to take into account the impact of the U.S. tax code on resources available to American households. This is particularly important for measuring household resources because while taxes reduce incomes for many households, many government benefits like the earned income tax credit and the mortgage interest deduction are distributed through the tax code. When using the CBO’s post-tax, post transfer household size adjusted measure of income, which adjusts income for household size, government benefits, and taxes, the growth in median household income increases even more. Chart 4 illustrates this trend.
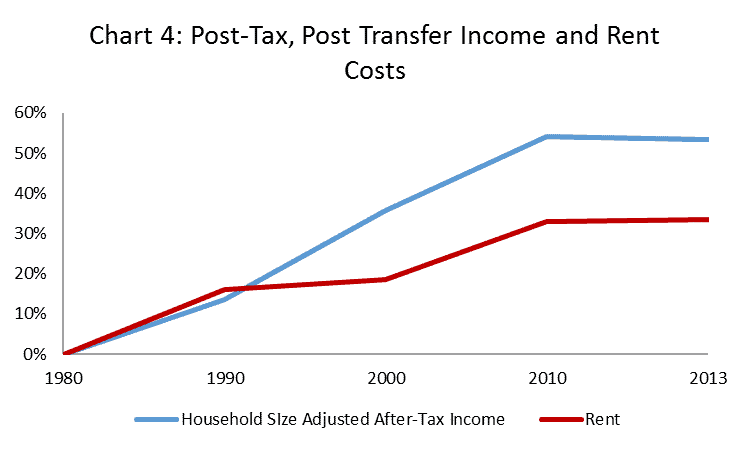
Chart 4 looks like Chart 1, but now the trend is flipped. Since 1980, post-tax, post-transfer median income has grown 53 percent. That is 20 percentage points more than the 33 percent growth in median rental costs. It is important to understand that this chart provides by far the most complete story because it looks at the total amount that a household can spend on rent or other consumption needs.
Apartment List’s conclusion that the growth in median rent has substantially outpaced the growth in median household income is frightening. Fortunately, however, the finding also does not validly represent income trends over the last several decades. In particular, when measuring household resources to spend on items like housing, groceries, and medicine, it is important that the income data take all of their available resources and the number of people who depend on those resources into account. When utilizing CBO data that incorporate these standard income adjustments, it is clear that renters today are better off than their parents, not worse off.
[i] Carmen DeNavas-Walt & Bernadette D. Proctor, “Income and Poverty in the United States: 2014,” Census Bureau, September 2015, https://www.census.gov/content/dam/Census/library/publications/2015/demo/p60-252.pdf
[ii] Andrew Woo, “How Have Rents Change Since 1960?” Apartment List, June 2016, https://www.apartmentlist.com/rentonomics/rent-growth-since-1960
[iii] Since CBO’s income data only go back to 1979, we use 1980 as our base year of 1960.
[iv] “The Distribution of Household Income and Federal Taxes, 2013,” Congressional Budget Office, June 2016, https://www.cbo.gov/publication/51361