








Insight
September 16, 2026
U.S.-Canada Trade Interdependence
Executive Summary
- On August 22, the Trump Administration imposed 50-percent tariffs on approximately $20 billion worth of Canadian imports after trade negotiations fell through, sparking a renewed trade war with the second-largest U.S. trade partner.
- The Canadian government responded by stating it will impose dollar-for-dollar tariffs on U.S. imports, with the retaliatory tariffs going into effect September 8.
- This insight examines the Harmonized Tariff Schedule to determine U.S. reliance on Canadian import and export markets, detailing the leverage each side may weaponize if the trade war is protracted or escalates further.
Introduction
On August 22, the Trump Administration imposed 50-percent tariffs on approximately $20 billion worth of Canadian imports using an outdated and legally questionable tariff authority under Section 338 of the Tariff Act of 1930. These tariffs were initially meant to take effect on August 19, but President Trump delayed them after announcing that both sides had reached a preliminary trade deal. Trade negotiations ultimately fell apart after last-minute conditions were added by the Trump trade team. The Canadian government responded by stating it would impose dollar-for-dollar tariffs on U.S. imports beginning on September 8, and adding to existing tariffs put in place in response to past U.S. trade measures.
Both countries rely on access to each other’s import and export markets, providing leverage that each side may weaponize if the trade war is protracted or escalates further. The interconnectedness of cross-border supply chains and the dependencies the United States and Canada have on one another’s goods also illustrate the pain that both economies are likely to endure without a speedily negotiated settlement. This insight reviews data on U.S. imports from and exports to Canada at the Harmonized Tariff Schedule (HTS)-2 and HTS-4 level to determine the extent of U.S. reliance on trade with Canada in different goods categories.
Section 338 Tariffs and Canadian Retaliatory Tariffs
On July 22, President Trump issued three proclamations implementing 50-percent tariffs on certain imports from Canada. The proclamations were justified on the basis of Section 338 of the Tariff Act of 1930, an authority never previously used to levy tariffs. That provision, enacted as part of the Smoot-Hawley Tariff Act, allows the president to implement import duties if he determines that a foreign country discriminates against U.S. commerce. In the three Section 338 proclamations, President Trump determined that Canadian policies discriminate against American cars, alcohol, and dairy. The new Section 338 tariffs hit $20 billion in Canadian imports, both within these sectors and beyond. Notably, this new wave of tariffs does not exempt trade under the United States-Mexico-Canada Agreement (USMCA), as has been the case for nearly all previous tariffs imposed under the Trump Administration.
Figure 1 shows which HTS-2 level import categories are most affected by the Section 338 tariffs, based on aggregated U.S. import values over the last decade. HTS-2 refers to 2-digit codes or chapters in the Harmonized Tariff Schedule of the United States (HTSUS), which represent broad categories of goods (e.g. cereals [chapter 10], fertilizers [chapter 31], or plastics and articles thereof [chapter 39]). HTS-4 refers to 4-digit codes in the HTSUS, denoting narrower goods categories (e.g. rice [1006], certain mineral and chemical fertilizers [3103], or styrene polymers [3903]). The most impacted categories include electrical equipment, plastics, and furniture, although these categories have shifted after the White House announced changes to the tariffs beginning September 15. Now, steel, iron, and aluminum imports are more heavily impacted by Section 338 tariffs while electrical machinery, alcoholic beverages, and other import categories are less impacted.
Figure 1: Most Impacted U.S. Imports from Canada ($ Billions, 2016-2025)
|
HTS-2 Level |
Chapter Description | Impacted U.S. Imports as of August 22 | Impacted U.S. Imports as of September 15 |
|
39 |
Plastics | $28.2 | $28.2 |
| 85 | Electrical machinery and equipment | $30.0 |
$27.6 |
|
94 |
Furniture | $18.6 | $20.0 |
| 48 | Paper and articles of paper pulp | $13.0 |
$11.2 |
|
84 |
Nuclear reactors, boilers, machinery and mechanical appliances | $10.6 | $10.6 |
| 44 | Wood and articles of wood | $9.5 |
$9.5 |
|
73 |
Articles of iron or steel | $0 | $8.4 |
| 33 | Essential oils, perfumery, cosmetics, and toilet preparations | $5.7 |
$5.7 |
|
76 |
Aluminum and articles thereof | $0 | $4.5 |
| 22 | Beverages, spirits, and vinegar | $7.3 |
$3.9 |
|
71 |
Pearls, precious stones, precious metals, imitation jewelry, and coins | $3.6 | $3.6 |
| 95 | Toys, games, and sports equipment | $2.9 |
$2.8 |
|
38 |
Miscellaneous chemical products | $2.3 | $2.3 |
| 62 | Apparel and clothing accessories not knitted or crocheted | $2.0 |
$2.0 |
| 90 | Optical, photographic, cinematographic, measuring, checking, precision, medical, or surgical instruments | $1.7 |
$1.7 |
Source: The United States International Trade Commission
Section 338 tariffs were initially scheduled to take effect on August 19, but were delayed for three days after American and Canadian policymakers made progress on bilateral negotiations. When those negotiations broke down, the duties took effect on August 22. As the administration has noted, Canada is one of only two countries that have pursued direct retaliatory measures in response to U.S. tariffs in the second Trump Administration. Canadian politicians seem to be holding firm for now, in the face of the Trump Administration’s continued threats to ramp up tariffs and trade restrictions.
Canadian retaliatory tariffs which took effect September 8 target close to $19 billion in U.S. exports, bringing total retaliatory tariffs to around $52 billion in covered U.S. exports. The primary categories targeted in this round included machinery and electrical equipment, wood, and plastics. Previous Canadian retaliation focused on U.S. vehicle and metal exports. Factoring in all Canadian retaliatory tariffs, U.S. vehicle exports are the number one impacted category in the current trade war. Notably, Canada removed seafood and fish products from its list of retaliatory tariffs, greatly easing the potential impact to the state of Maine.
The Trump Administration further escalated its Section 338 tariffs in response to Canada’s September 8 retaliatory tariffs by issuing five new proclamations. These add new goods to the 50-percent tariff list, remove certain other goods from the initial list, and completely ban the import of approximately $967 million worth of Canadian products, 87 percent of which fall under the alcoholic beverages proclamation. The tariff adjustments took effect on September 15 while the import bans are scheduled for September 29. All in all, the total value of imports from Canada subject to tariffs remains relatively the same (see appendix).
The U.S.-Canada Trade Relationship
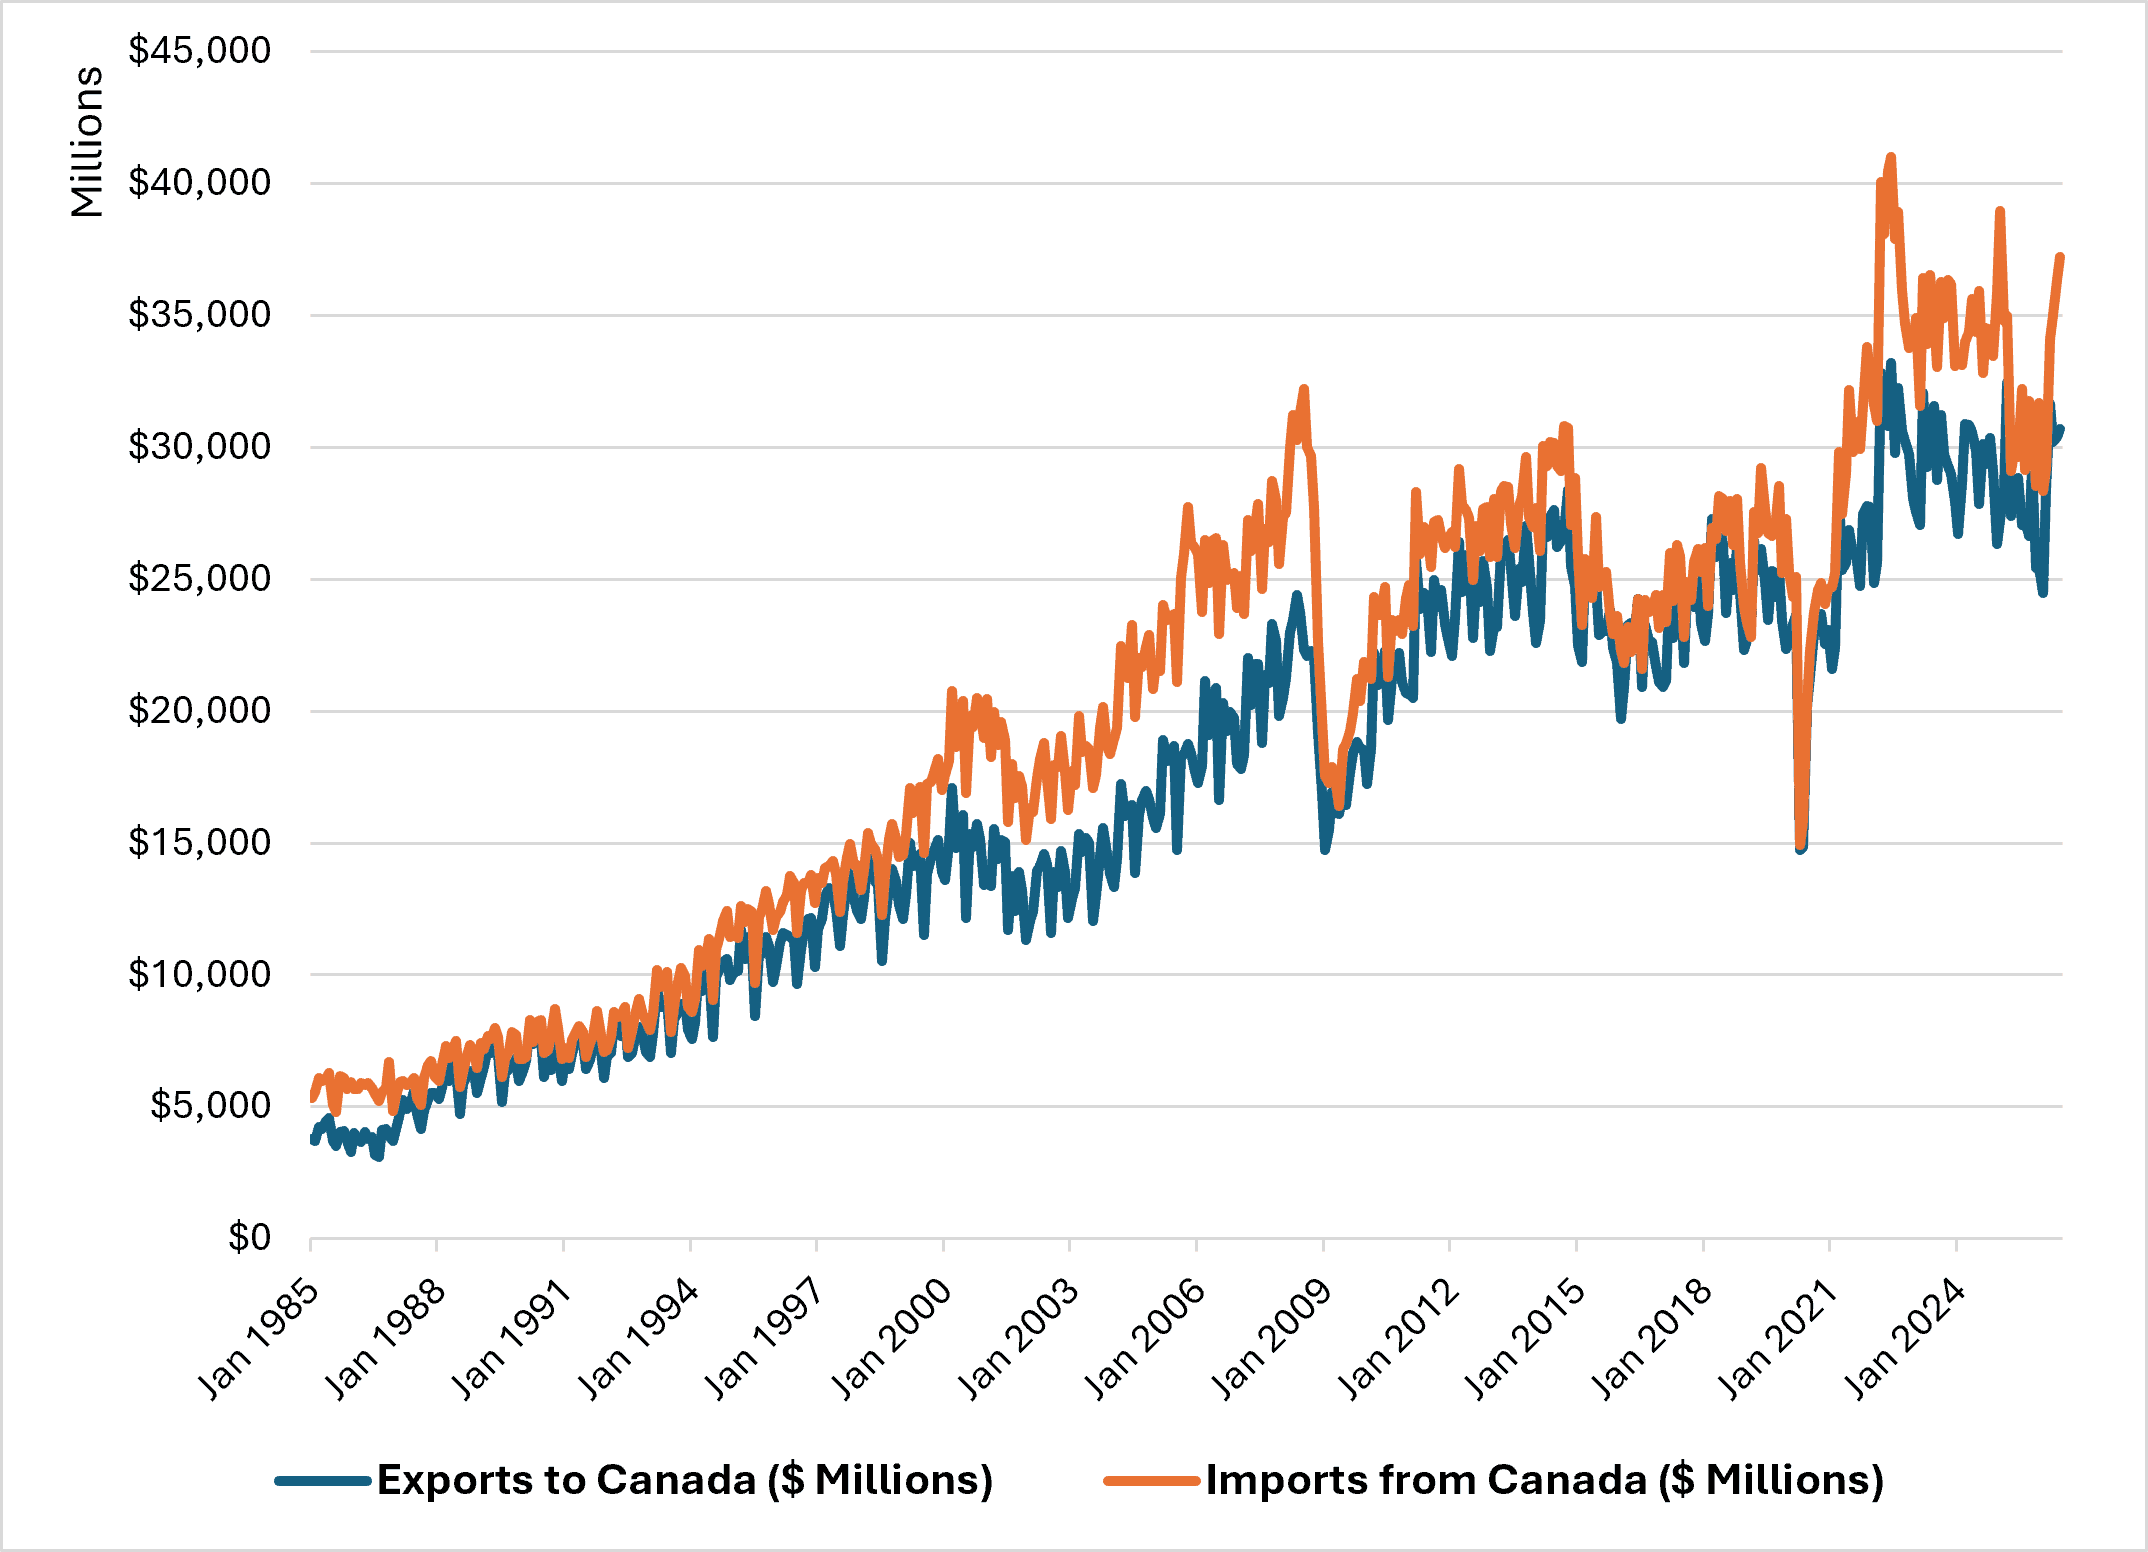
The escalation of trade tensions is notable because the U.S.-Canada economic relationship has long been one of the most interconnected in the world. Since the two countries signed the Canada–United States Free Trade Agreement (CUSFTA) in 1988, bilateral trade flows have steadily increased. Furthermore, both countries heavily rely on one another for investment, with foreign direct investment from Canada into the United States reaching over $730 billion as of 2024.
Figure 2: Monthly U.S. Trade in Goods With Canada, January 1985 to June 2026
Source: U.S. Census Bureau (Not seasonally adjusted)
In 2025, Canada was the largest export market for U.S. goods and second-largest trade partner for U.S. imports of goods. For numerous goods categories, the United States receives a substantial portion of its total imports from Canada. Historically, this has been a positive development as Canada has been a close ally – not only geographically, but geopolitically – in North America, mitigating both strategic and supply chain risks. Now that trade tensions have escalated into an all-out U.S-Canada trade war, U.S. reliance on Canadian imports can be wielded as negotiating leverage.
U.S. Import Reliance
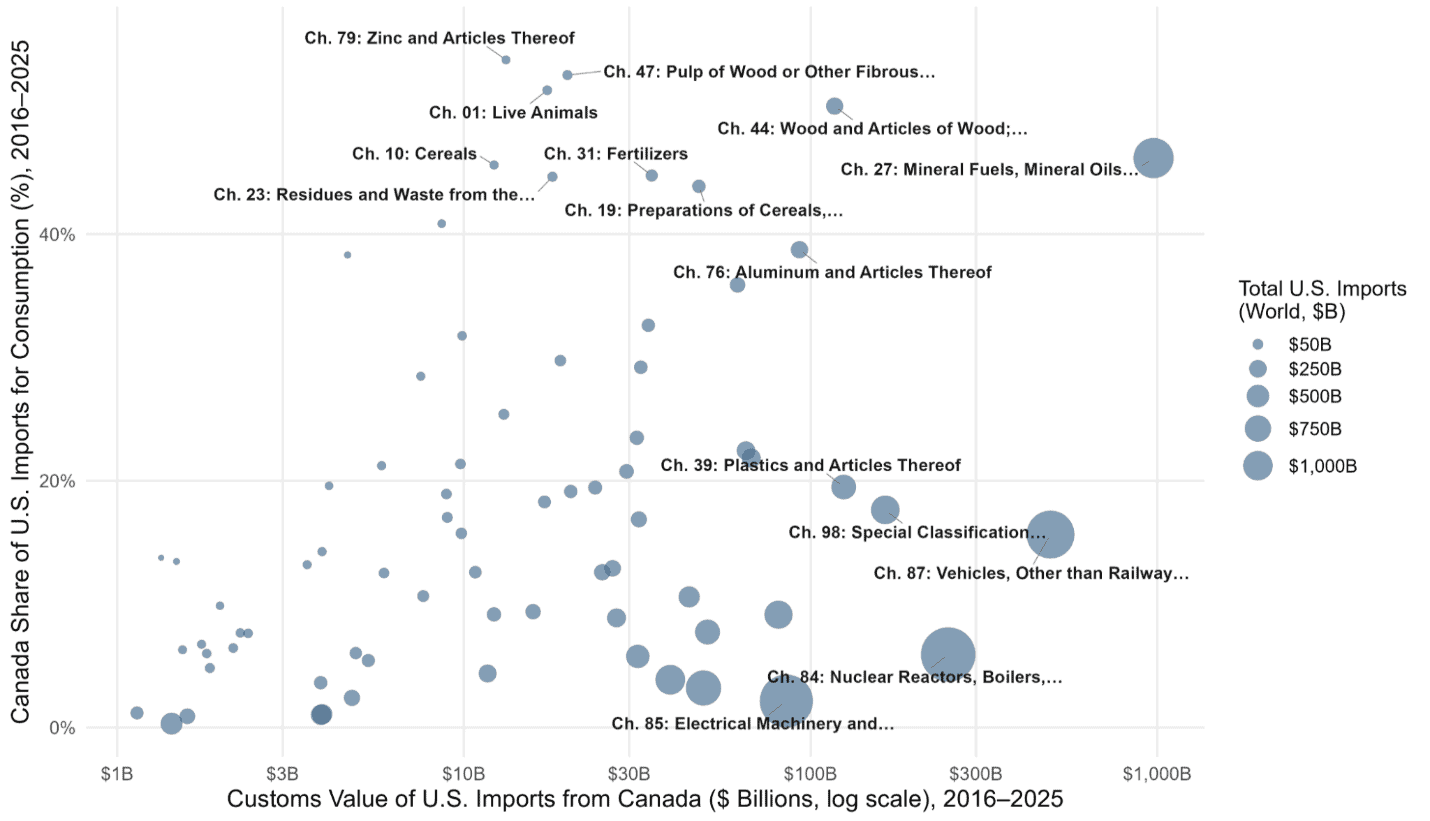
Apart from its broad overall reliance on Canada as a critical trade partner, the United States is also dependent on Canadian sources for specific industries and product categories. This includes both finished products and intermediate goods, which constitute important inputs in the cross-border supply chains in which U.S. firms operate. For instance, Canadian auto parts supply Midwest automakers, Canadian crude oil supplies Gulf Coast refineries, and Canadian softwood lumber supplies U.S. homebuilders. Figure 3 displays the share of U.S. imports from Canada as well as the total dollar value of imports at the HTS-2 level, aggregated from 2016–2025 to account for any single-year fluctuations in trade. This visualization represents the degree of U.S. dependence on Canadian imports, with the import categories farther to the right and closer to the top of the graphic being most important. Additionally, the dot size reflects the value of total U.S. imports from all countries for a particular HTS chapter which puts into perspective the overall importance of each import category.
Figure 3: U.S. Import Dependence on Canada by HTS Chapter, 2016–2025
Source: The United States International Trade Commission, Imports: For Consumption, Customs Value, HTS-2 Commodity Aggregation Level, 2016–2025 cumulative.
Figure 4: Customs Value and Share of U.S. Imports from Canada at the HTS-2 Level
|
HTS-2 Level |
Chapter Description | Customs Value of U.S. Imports from Canada ($ Billions), 2016–2025 |
Canada Share of U.S. Imports, 2016–2025 |
|
79 |
Zinc products | $13.2 | 54.1% |
| 47 | Pulp of wood and paper waste | $19.9 |
52.9% |
|
01 |
Live animals | $17.4 | 51.7% |
| 44 | Wood and articles of wood | $117.3 |
50.4% |
|
27 |
Mineral fuels, mineral oils and products of their distillation | $975.2 | 46.2% |
| 10 | Cereals | $12.2 |
45.6% |
|
31 |
Fertilizers | $34.8 | 44.8% |
| 23 | Waste from food industries; prepared animal feed | $18.0 |
44.7% |
|
19 |
Preparations of cereals, flour, starch or milk; bakers’ wares | $47.6 | 43.9% |
| 11 | Products of the milling industry; malt; starches | $8.6 |
40.9% |
|
76 |
Aluminum products | $92.9 | 38.7% |
| 78 | Lead products | $4.6 |
38.3% |
|
48 |
Paper and articles of paper pulp | $61.6 | 35.9% |
| 15 | Animal or vegetable fats and oils; animal or vegetable waxes | $34.0 |
32.6% |
|
75 |
Nickel products | $9.9 |
31.8% |
Source: The United States International Trade Commission
Energy Imports
From 2016–2025, the United States imported $975.2 billion worth of Canadian exports in HTS chapter 27: mineral fuels, mineral oils and products of their distillation; bituminous substances; mineral waxes. That represented nearly half (46.2 percent) of U.S. imports from the entire world in that category. Figure 5 shows the largest subcategories of U.S. imports from Canada in this chapter (by HTS-4 code), representing U.S. dependencies on imports of certain Canadian energy products.
Figure 5: Customs Value and Share of U.S. Energy Imports From Canada at the HTS-4 Level
|
HTS-4 Level |
Description | Customs Value of U.S. Imports from Canada ($ Billions), 2016–2025 | Canada Share of U.S. Imports, 2016–2025 |
| 2709 | Petroleum oils and oils from bituminous minerals, crude | $705.76 |
57.3% |
|
2710 |
Petroleum oils & oils from bituminous minerals other than crude & products therefrom | $110.97 | 18.5% |
| 2711 | Petroleum gases | $103.87 |
66.0% |
|
2716 |
Electrical energy | $25.21 | 100.0% |
| 2713 | Petroleum coke, petroleum bitumen and residues of petroleum oils | $19.35 |
27.4% |
|
2703 |
Peat whether or not agglomerated | $3.83 | 93.9% |
| 2701 | Coal and solid fuels manufactured from coal | $1.44 |
28.1% |
|
2707 |
Oils and other products of the distillation of high temperature coal tar | $1.31 | 14.2% |
| 2712 | Petroleum jelly; paraffin wax, microcrystalline petroleum wax, slack wax, other mineral waxes | $1.09 |
25.5% |
|
2715 |
Bituminous mixtures based on natural asphalt, natural bitumen, petroleum bitumen, mineral tar or mineral tar pitch | $0.87 |
71.6% |
Source: The United States International Trade Commission
The largest subcategory of U.S. energy imports from Canada consists of crude oil and related commodities. $750.76 billion of its $1.23 trillion in total imports over the last 10 years came from Canada, much of it from Alberta’s oil sands. The United States gets approximately two-thirds (66.0 percent) of its imports of petroleum gases and other gaseous hydrocarbons (primarily natural gas) from Canada. Finally, all of America’s imports of electrical energy come from Canada. Although that subcategory has relatively modest import volumes ($25.21 billion over 10 years) compared to some of the others, it has been a supplier for states such as Michigan, Minnesota, and New York. Ontario Premier Ford announced a 25-percent surcharge on electricity exports to the United States in response to President Trump’s tariff threats. And after U.S.–Canada negotiations broke down in August 2026, he threatened to cut off Ontario’s energy exports to the United States entirely.
Metal Imports
From 2016–2025, U.S. imports of aluminum and articles thereof (HTS chapter 76) totaled $239.7 billion, 38.7 percent ($92.9 billion) of which was from Canada. Aluminum imports are integral to North American supply chains as the United States has scant primary aluminum production capacity. There are only four actively operating smelters in the entire country producing less than 700,000 metric tons, with the Department of Energy recently approving the construction of a fifth in Oklahoma. Canada fills in the gap, with nine smelters in Quebec, which operate at near full-capacity and benefit from abundant hydroelectric power, producing roughly 2.9 million metric tons annually.
The story is similar for other metals, which have applications in the automotive, aerospace, defense, electrical machinery, industrial, and technology industries. Over the decade between 2016 and 2025, the United States imported $24.4 billion in zinc and articles thereof (HTS chapter 79) and $31.1 billion in nickel and articles thereof; 54.1 percent ($13.2 billion) and 31.8 percent ($9.9 billion) of these imports were from Canada, respectively. The United States only has one operating nickel mine and no nickel refineries. What nickel is mined in the United States – in Michigan’s Upper Peninsula – is exported across the border to Ontario to be refined before it is exported back to the United States.
As is the case for aluminum and nickel, many tradable goods cross the U.S.-Canada border multiple times, as raw materials and inputs move through various stages of the production process en route to becoming finished products. In the context of these integrated supply chains – initially created to take advantage of tariff-free trade and reduce consumer costs – tariff duties can be multiple times higher than they appear at first glance. Additionally cutting off reliance on Canada for metals and other inputs pressures U.S. companies to look elsewhere, including China and other less historically reliable trade partners.
Fertilizer Imports
From 2016 to 2025, the United States imported $34.8 billion worth of fertilizers (HTS chapter 31) from Canada, equivalent to nearly 45 percent of all U.S. fertilizer imports during that period. Fertilizer is an incredibly important input to U.S. agricultural production and has experienced substantial disruption over the past few years due to the Russia-Ukraine War, and more recently, the effective closure of the Strait of Hormuz. These supply chain disruptions have caused shortages leading to higher prices for fertilizer inputs such as ammonia, urea, and potash in the global market. This makes it even more important for U.S. farmers to have a reliable source of fertilizers with a minimal chance of geopolitical disruptions interfering with access to inputs. While global prices may rise overall, a higher input price is a better outcome than loss of access to fertilizer.
U.S. Export Reliance
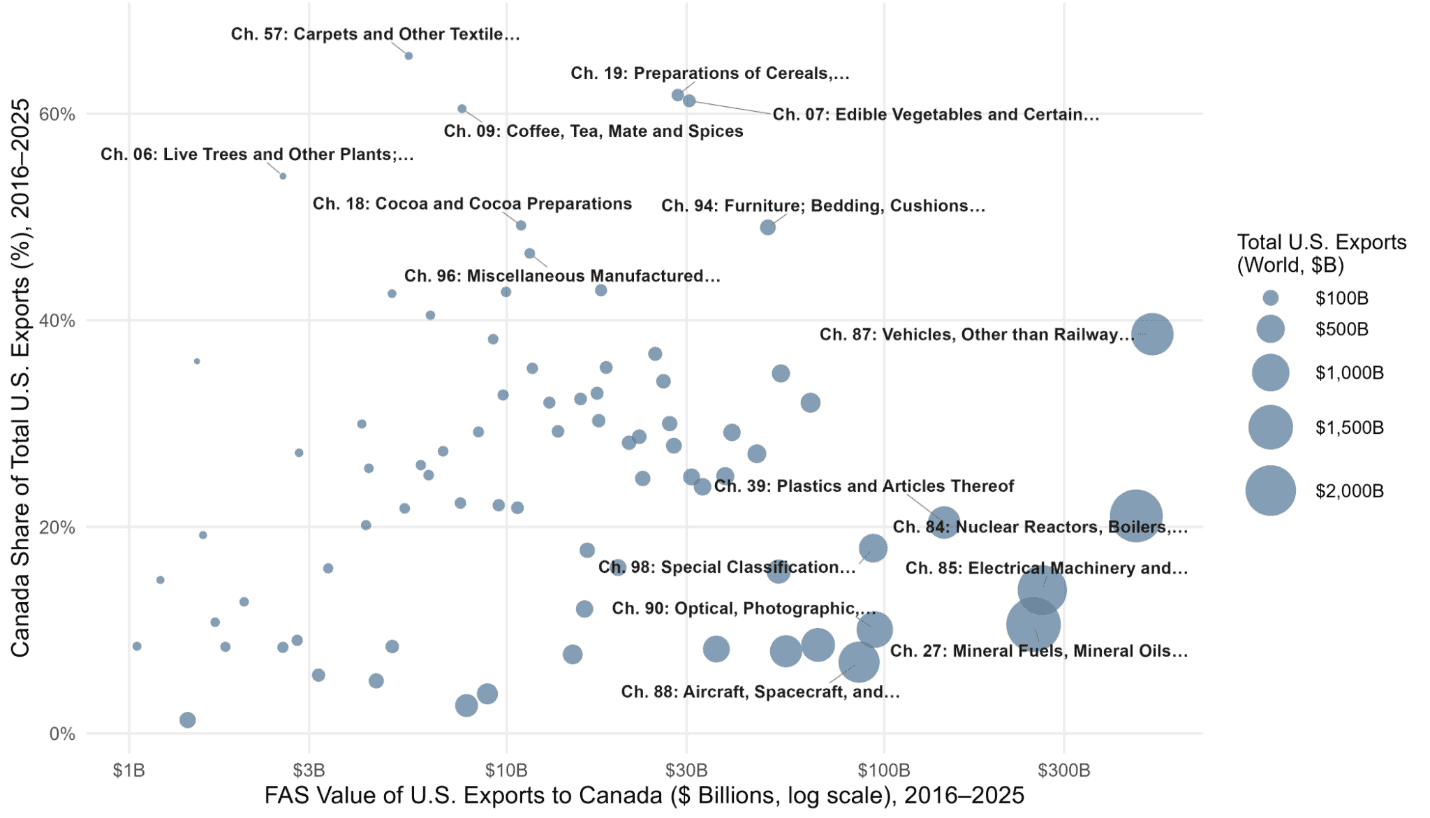
Just as U.S. consumers rely on purchasing Canadian products, U.S. businesses rely on exporting merchandise to the Canadian market. Figure 6 displays the share of U.S. exports to Canada as well as the total dollar value of exports at the HTS-2 level, aggregated from 2016–2025. This graphic visualizes the degree of exposure of U.S. exports to Canada, with export categories farther to the right and closer to the top being those most dependent on the Canadian market. Additionally, the dot size reflects the value of total U.S. exports to all countries for a particular HTS chapter which puts into perspective the overall importance of each export category.
Figure 6: U.S. Export Exposure to the Canadian Market by HTS Chapter, 2016–2025
Source: The United States International Trade Commission, Exports: Total, FAS Value, HTS-2 Commodity Aggregation Level, 2016–2025 cumulative.
Figure 7: FAS Value and Share of U.S. Exports to Canada at the HTS-2 Level
|
HTS-2 Level |
Chapter Description | FAS Value of U.S. Exports to Canada ($ Billions), 2016–2025 | Canada Share of Total U.S. Exports, 2016–2025 |
| 57 | Carpets and other textile floor coverings | $5.5 |
65.6% |
|
19 |
Preparations of cereals, flour, starch or milk; bakers’ wares | $28.4 | 61.8% |
| 07 | Vegetables and certain roots | $30.5 |
61.3% |
|
09 |
Coffee, tea, maté and spices | $7.6 | 60.5% |
| 46 | Manufactures of straw, of esparto or of other plaiting materials; basketware and wickerwork | $0.1 |
59.3% |
|
06 |
Live trees and other plants; bulbs, roots and the like; cut flowers and ornamental foliage | $2.6 | 54.0% |
| 18 | Cocoa and cocoa preparations | $10.9 |
49.2% |
|
94 |
Furniture | $49.2 | 49.0% |
| 96 | Miscellaneous manufactured articles | $11.5 |
46.5% |
|
66 |
Umbrellas, walking sticks, seat sticks, whips, riding-crops and parts thereof | $0.2 | 45.1% |
| 49 | Printed books, newspapers, pictures and other products of the printing industry | $17.8 |
42.9% |
|
16 |
Preparations of meat, of fish or of crustaceans, molluscs or other aquatic invertebrates | $10.0 | 42.8% |
| 01 | Live animals | $5.0 |
42.6% |
|
67 |
Prepared feathers and down and articles made of feathers or of down; artificial flowers; articles of human hair | $0.6 | 42.2% |
| 42 | Articles of leather; saddlery and harness; travel goods, handbags and similar containers | $6.3 |
40.5% |
|
87 |
Vehicles other than railway or tramway rolling stock, and parts and accessories thereof | $513.2 | 38.7% |
| 62 | Apparel and clothing accessories not knitted or crocheted | $9.2 |
38.2% |
|
45 |
Cork and articles of cork | $0.1 | 37.6% |
| 95 | Toys, games and sports requisites | $24.8 |
36.8% |
|
65 |
Headgear and parts thereof | $1.5 |
36.0% |
Source: The United States International Trade Commission
Detailing U.S. exports to Canada sheds light on what U.S. industries would be most impacted by a collapse in economic relations or targeted retaliation by the Canadian government. Figure 7 shows the share of U.S. exports that go to Canada as well as the free alongside ship (FAS) value of exports at the HTS-2 level. The FAS value is the value of exports at the U.S. port of exit based on the transaction price, including freight, insurance, and other costs incurred within the United States.
Agricultural Exports
Canada remains one of the top destinations for U.S. agricultural exports, with the Canadian market accounting for nearly 17 percent of all agricultural export categories in 2025. Between 2016 and 2025, U.S. exports to Canada of cereals, flour, and related products (HTS chapter 19) represented close to 62 percent of all U.S. exports within that category. Similarly, over 61 percent of vegetable exports (HTS chapter 7), 49 percent of cocoa exports (HTS chapter 18), and 43 percent of prepared meat and fish exports went to Canada during the same period.
Vehicle Exports
Between 2016 and 2025, U.S. exports of vehicles and related vehicle parts (HTS chapter 87) totaled over $500 billion, close to 39 percent of all U.S. exports within that category. This represents one of the most valuable U.S. exports by value due to the fact the U.S.-Canada automobile industries are closely intertwined. The closely knit North American auto industry was not possible before the North American Free Trade Agreement (NAFTA) and the USMCA which allowed for highly integrated, low-cost supply chains, with certain regions specializing in different aspects of automobile manufacturing. American-made cars will often cross the Canadian border and vice versa multiple times before assembly is finalized, with some analysts estimating that autos and auto parts can cross the U.S.-Canada border more than six times before completion. This inevitably means that U.S. tariffs on Canadian imports and retaliatory tariffs from Canada have a significant impact on U.S. auto manufacturing and the cost-effectiveness of various types of U.S. vehicles.
Furniture Exports
Canada is by far the largest export market for U.S. furniture exports (HTS chapter 94) as the country accounted for nearly half of all exports within that category from 2016 to 2025. This category includes furniture, bedding, cushions, lamps, and similar items. In 2025, exports to Canada totaled $3.7 billion, which was three times greater than Mexico, the second-largest export market for such products. President Trump has repeatedly stressed the importance of American-made furniture, targeting the industry with Section 232 national security tariffs that cover certain wood, furniture, and related imports. Disrupting the largest market for U.S. furniture and related goods will undoubtedly negatively impact U.S. manufacturers and independent artisans that cannot quickly or easily replace the Canadian market.
Appendix:
Figure 8: Change in U.S. Imports from Canada Impacted by Section 338 Tariffs ($ Billions, 2016-2025)
|
HTS-2 Level |
Chapter Description | Impacted Imports as of August 22 | Impacted Imports as of September 15 | Change in Impacted Import Value |
| 73 | Articles of iron or steel | $0 | $8.44 |
$8.44 |
|
76 |
Aluminum and articles thereof | $0 | $4.54 | $4.54 |
| 94 | Furniture | $18.58 | $20.03 |
$1.45 |
|
15 |
Animal or vegetable fats and oils | $0 | $1.37 | $1.37 |
| 83 | Miscellaneous articles of metal | $0.26 | $0.66 |
$0.39 |
|
89 |
Ships and boats | $0.23 | $0.59 | $0.36 |
| 4 | Dairy produce, eggs, and honey | $0.70 | $0.98 |
$0.27 |
|
41 |
Raw hides, skins, and leather | $0.004 | $0.12 | $0.12 |
| 43 | Furskins and artificial fur | $0.06 | $0.07 |
$0.01 |
|
17 |
Sugars and sugar confectionery | $0.04 | $0.02 | -$0.01 |
| 95 | Toys, games, and sports equipment | $2.91 | $2.82 |
-$0.09 |
|
29 |
Organic chemicals | $0.14 | $0.004 | -$0.14 |
| 87 | Vehicles and parts thereof | $1.13 | $0.16 |
-$0.97 |
|
48 |
Paper and articles of paper pulp | $13.01 | $11.21 | -$1.80 |
| 85 | Electrical machinery and equipment | $30.04 | $27.60 |
-$2.44 |
|
78 |
Lead and articles thereof | $2.49 | $0 | -$2.49 |
| 22 | Beverages, spirits, and vinegar | $7.27 | $3.92 |
-$3.35 |
|
25 |
Salt, sulfur, stone, and plastering materials | $5.41 | $0 |
-$5.41 |
|
Net Change: $0.25 |
||||
Source: The United States International Trade Commission
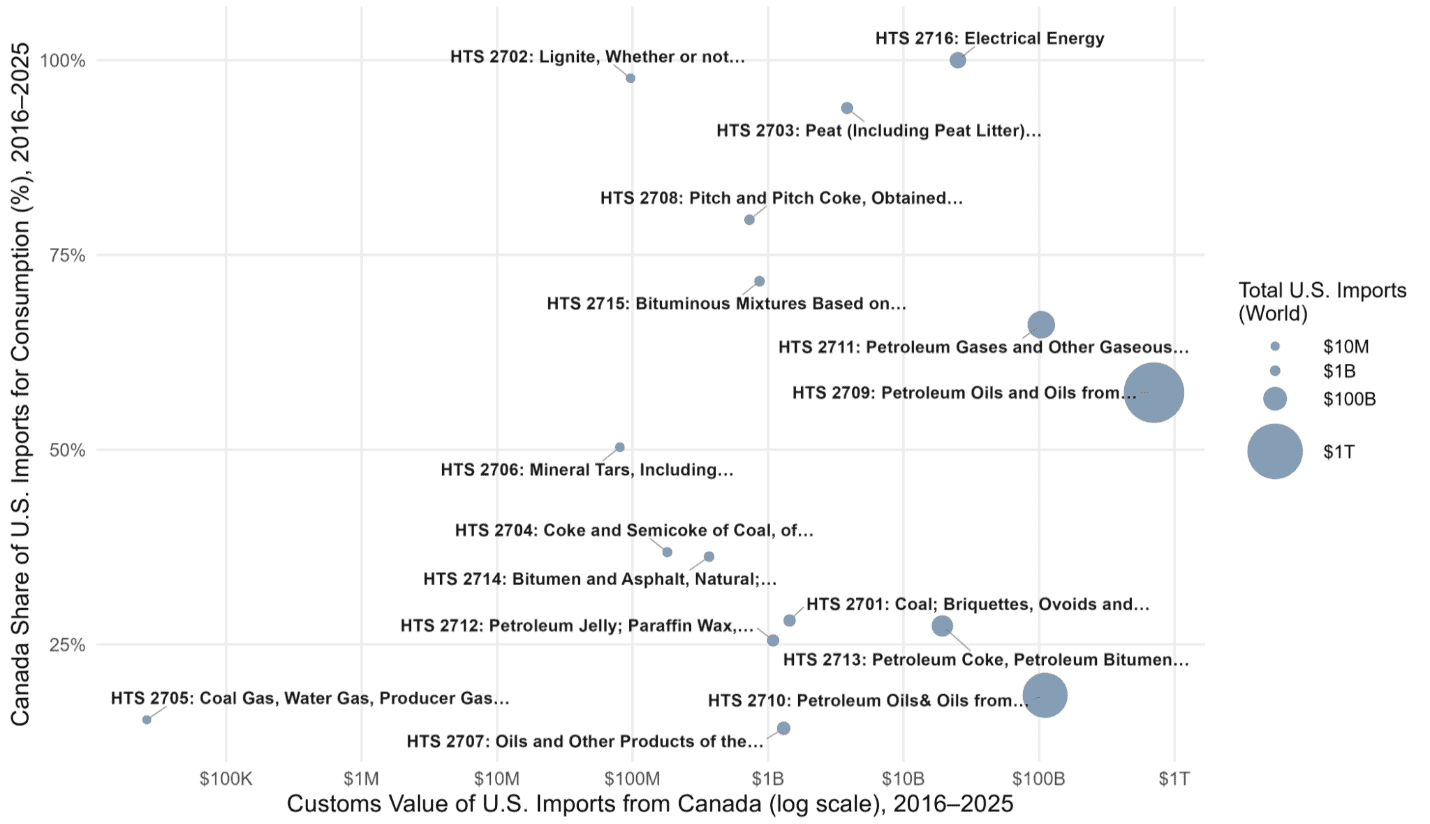
Source: The United States International Trade Commission, Imports: For Consumption, Customs Value, HTS-4 Commodity Aggregation Level, HTS Chapter 27 only, 2016–2025 cumulative.
Dot size reflects total U.S. imports for consumption from all countries for that HTS-4 code.
Note: x-axis uses a log10 scale.
Figure 10: Customs Value and Share of U.S. Imports From Canada at the HTS-4 Level
|
4-Digit HTS Code |
Description | Customs Value of U.S. Imports from Canada ($ Billions), 2016–2025 | Canada Share of U.S. Imports for Consumption,
2016–2025 |
| 0205 | Meat of horses, asses, mules or hinnies, fresh, chilled or frozen | $0.02 |
100.0% |
|
2716 |
Electrical energy | $25.21 | 100.0% |
| 2607 | Lead ores and concentrates | $0.27 |
100.0% |
|
0104 |
Live sheep and goats | $0.01 | 100.0% |
| 0701 | Potatoes, fresh or chilled | $2.94 |
100.0% |
|
0103 |
Live swine | $4.33 | 100.0% |
| 0105 | Live poultry of the following kinds: chickens, ducks, geese, turkeys and guineas | $0.43 |
99.8% |
|
8606 |
Railway or tramway freight cars, not self-propelled | $1.99 | 99.6% |
| 4801 | Newsprint, in rolls or sheets | $6.51 |
99.4% |
|
4701 |
Mechanical wood pulp | $0.12 | 99.3% |
| 2306 | Oilcake and other solid residues (in pellets or not), resulting from the extraction of vegetable fats or oils (except from soybeans or peanuts), nesoi | $10.69 |
98.4% |
|
1514 |
Rapeseed, colza or mustard oil, and fractions thereof, whether or not refined, but not chemically modified | $26.81 |
98.1% |
|
2702 |
Lignite, whether or not agglomerated, excluding jet | $0.10 | 97.7% |
| 4704 | Chemical wood pulp, sulfite, other than dissolving grades | $1.65 |
97.0% |
|
1004 |
Oats | $3.50 | 96.7% |
| 4705 | Wood pulp obtained by a combination of mechanical and chemical pulping processes | $0.47 |
95.0% |
|
1001 |
Wheat and meslin | $5.97 | 95.0% |
| 2829 | Chlorates and perchlorates; bromates and perbromates; iodates and periodates | $2.05 |
94.9% |
|
4707 |
Recovered (waste and scrap) paper or paperboard | $1.12 | 94.8% |
| 0209 | Pig fat, free of lean meat, and poultry fat, not rendered or otherwise extracted, fresh, chilled, frozen, salted, in brine, dried or smoked | $0.10 |
94.5% |
|
2703 |
Peat (including peat litter) whether or not agglomerated | $3.83 | 93.9% |
| 4410 | Particle board, oriented strand board (OSB) and similar board of wood or other ligneous materials, whether or not agglomerated with resins or other organic binding substances | $21.60 |
93.2% |
|
1213 |
Cereal straw and husks, unprepared, whether or not chopped, ground, pressed or in the form of pellets | $0.07 |
90.4% |
Source: The United States International Trade Commission
Figure 11: FAS Value and Share of U.S. Exports to Canada at the HTS-4 Level
|
4-Digit HTS Code |
Description | FAS Value of U.S. Exports to Canada ($ Billions), 2016–2025 | Canada Share of Total U.S. Exports, 2016–2025 |
| 2716 | Electrical energy | $5.95 |
100.0% |
|
9870 |
Items imported from Canada and returned to Canada; exhibits for Canadian public museums and institutions; and items for the Canadian governor general | $1.13 | 100.0% |
| 0707 | Cucumbers and gherkins, fresh or chilled | $0.58 |
98.2% |
|
0803 |
Bananas, including plantains, fresh or dried | $4.70 | 96.9% |
| 2706 | Mineral tars, including reconstituted tars | $0.57 |
96.4% |
|
1804 |
Cocoa butter, fat and oil | $1.28 | 96.0% |
| 0702 | Tomatoes, fresh or chilled | $3.13 |
95.8% |
|
8605 |
Railway or tramway passenger coaches, luggage vans, post office coaches and other special purpose rail or tramway coaches, not self-propelled, nesoi | $0.61 | 95.2% |
| 2708 | Pitch and pitch coke, obtained from coal tar or from other mineral tars | $0.17 |
94.5% |
|
2522 |
Quicklime, slaked lime and hydraulic lime, other than calcium oxide and hydroxide or heading 2825 | $0.43 | 89.8% |
| 3826 | Biodiesel and mixtures thereof, not containing or containing less than 70% by weight of petroleum oils or oils obtained from bituminous minerals | $5.97 |
89.6% |
|
0706 |
Carrots, turnips, salad beets, salsify, radishes and similar edible roots, fresh or chilled | $1.34 | 89.0% |
| 0807 | Melons (including watermelons) and papayas (papaws), fresh | $2.56 |
88.7% |
|
2521 |
Limestone flux; limestone and other calcareous stone, of a kind used for the manufacture of lime or cement (or for soil improvement) | $0.11 | 88.5% |
| 0704 | Cabbages, cauliflower, kohlrabi, kale and similar edible brassicas, fresh or chilled | $4.52 |
88.1% |
|
4902 |
Newspapers, journals and periodicals, whether or not illustrated or containing advertising material | $3.39 | 88.0% |
| 0302 | Fish, fresh or chilled, excluding fish fillets and other fish meat without bones; fish livers and roes, fresh or chilled | $1.86 |
87.4% |
|
4909 |
Printed or illustrated post cards, greeting cards, messages or announcements, with or without envelopes or trimmings | $0.77 | 86.7% |
| 1511 | Palm oil and its fractions, whether or not refined, but not chemically modified | $1.07 |
86.3% |
|
5511 |
Yarn (other than sewing thread) of manmade staple fibers, put up for retail sale | $0.22 | 86.3% |
| 7322 | Radiators, air heaters and hot air distributors having a motor-driven fan or blower, not electrically heated, and parts thereof, of iron or steel | $3.60 |
85.6% |
|
0705 |
Lettuce (lactuca sativa) and chicory (cichorium spp.), fresh or chilled | $4.81 | 85.1% |
| 8702 | Motor vehicles for the transport of ten or more persons, including the driver | $7.36 |
85.1% |