Insight
July 11, 2019
Understanding Job Loss Predictions From Artificial Intelligence
Executive Summary
- Researchers from the University of Oxford and other institutions have sought to predict how many jobs will be displaced by artificial intelligence (AI), but their results have varied widely, from 9 to 47 percent.
- Variations in methodology are responsible for the wide range, with one major difference being whether the researchers believed that the entire occupation would be automated or just a specific task.
- These studies ultimately say very little about the changing structure of work and even less about the appropriate policy responses; policymakers should proceed with caution.
The Variety of AI Job Loss Predictions
Worries about artificial intelligence (AI) tend to emanate from concerns about the impact of the new technology on work. Many fear that automation will destabilize labor markets, depress wage growth, and lead to long-term secular decline in the labor market and economy as a whole. Studies from the University of Oxford, the Organisation for Economic Co-operation and Development (OECD), and PwC (formerly PricewaterhouseCoopers) tend to legitimize such fears, suggesting that the number of jobs will decline by some 9 to 47 percent from their current levels.
Before formulating policy based on these figures, however, it is important to note several qualifications of these studies:
- Similar models charting AI job loss can result in widely different job prediction losses;
- Most AI job loss predictions aren’t compared against current economic baselines; and
- Implementing AI-based systems isn’t costless and is likely to take some time to accomplish.
The conflict over the competing methodologies points to a much deeper problem that policymakers should understand. Not only is there a lack of consensus on the best way to model AI-based labor changes, but more important, there is no consensus as to the best policy path to help us prepare for these changes.
Fears and Predictions of Job Losses
The “technoclerics” have prophesied the coming jobs apocalypse. Mark Cuban, for example, warned of the impending doom: “Literally, who you work for, how you work, the type of work you do is going to be completely different than your parents within the next 10 to 15 years.” Kai-Fu Lee, the founder of venture capital firm Sinovation Ventures, has claimed multiple times that robots are likely to take some 50 percent of jobs in the next decade. Vivek Wadhwa predicted that this number would be closer to 80 or 90 percent of jobs. Elon Musk, the perennial tech pessimist, predicted that, “There certainly will be job disruption. Because what’s going to happen is robots will be able to do everything better than us… All of us.”
Even with historical lows in unemployment, the message has been received. Around the world, majorities are convinced that in less than a lifetime robots will be doing much of the work humans currently do. In the United States, nearly 65 percent think robots, not humans, will be the primary workers in the next 50 years. In a bit of a paradox, surveys also suggest that most aren’t convinced that their job will be automated away.
The widespread fear can be traced to a series of papers predicting massive job loss, the most important of which is an influential report from Oxford researchers.
The Oxford Study
Pioneering work from Carl Benedikt Frey and Michael A. Osborne, based at the University of Oxford, first projected job losses due to automation in late 2013. The Oxford Study, as it is sometimes called, predicted that 47 percent of U.S. jobs could be lost due to automation. The study was cited widely, appearing in The Washington Post, The Economist, Ars Technica, and The Verge, among other outlets. But it is critically important for policymakers to understand how the Oxford Study calculated these numbers.
First, machine learning (ML) researchers classified occupations as being automatable or not automatable, and occupations were given either a 1 or a 0 if “the tasks of this job [could] be sufficiently specified, conditional on the availability of big data, to be performed by state of the art computer-controlled equipment.” The rest of the paper relied upon “the occupations about which we were most confident” whether they would be either automated or not, which totaled 70 jobs.
Frey and Osborne’s second step forms the intellectual core of the paper. They write, it is “largely already technologically possible to automate almost any task, provided that sufficient amounts of data are gathered for pattern recognition.” Assuming that every job is automatable, the researchers identified nine broad variables which could be routinized from O*NET data, which has detailed descriptions of the skills needed for various jobs across the world. Then, using a classification algorithm, they were able to determine the probability that 702 other occupations would be automated based on the original 70 using these variables.
Their algorithm put jobs into three risk categories. Low-risk jobs have less than a 30 percent chance of becoming automatable. Medium-risk occupations have a 30 percent to 70 percent chance of becoming automatable. Finally, high-risk jobs have a very high likelihood of being automated away, at ranges above 70 percent.
But initial assumptions about the 70 hand-labelled occupations don’t consistently match up with the conclusions of the subsequent model, as detailed in the Appendix. For example, the ML researchers thought that both surveyors and judicial law clerks would become automated, but the model predicted both were in the medium-risk category at 38 percent and 41 percent. Similarly, transportation, storage, and distribution managers were labelled as not becoming automatable, but the model predicted the occupation to have a 59 percent chance of disappearing. Finally, restaurant servers were also labelled as not becoming automatable, but the model predicted this job to have a 94 percent chance of going away.
There are reasons to be skeptical of the method of pooled predictions, which is the method Frey and Osborne used. As the report explains, the 70 selected occupations were those “whose computerisation label we are highly confident about, [which] further reduces the risk of subjective bias affecting our analysis.” But selecting those occupations which everyone agrees upon doesn’t reduce bias; it merely selects those jobs on which everyone agrees. For any estimation to be accurate, the pool of opinions should not err in the same way. A better method would have included all jobs where there is disagreement and then calculated probabilities from this uncertainty. In short, there are good reasons to believe that the estimates are biased.
The Organisation for Economic Co-operation and Development Report
The sheer magnitude of Frey and Osborne’s result sparked further estimations, and for good reasons. Research into the impacts of computer adoption on industries has found that advanced technology doesn’t wipe out entire industries. Rather, it automates certain functions of a job. Indeed, it was widely predicted that the introduction of the automated teller machine, the ATM, would put bank tellers out of work, but the opposite has been the case. As economist James Bessen explained,
The average bank branch in an urban area required about 21 tellers. That was cut because of the ATM machine to about 13 tellers. But that meant it was cheaper to operate a branch… And when it became cheaper to do so, demand for branch offices increased. And as a result, demand for bank tellers increased.
The first comprehensive response to the Oxford Paper with a task-based view came from work conducted for the OECD by economists Melanie Arntz, Terry Gregory, and Ulrich Zierahn. Their research builds on the core framework of Frey and Osborne, Because the Oxford study fundamentally relies upon a binary choice–either a job can be automated or not—a good deal of nuance is lost. Jobs might not be completely automated away, but partly automated. For example, tractors didn’t destroy farming, but instead shifted the kinds of tasks farmers engaged in. Relying upon a binary choice means that the job estimations have the potential to be inflated.
To make a task-based estimation, the authors worked with the OECD’s Programme for the International Assessment of Adult Competencies (PIAAC) database. Since it contains data on the breakdown of tasks by job for countless occupations, the researchers were able to replicate the Oxford Study’s techniques to find that just 9 percent of U.S. jobs would be lost due of automation. In other words, a small shift in methodology had the effect of completely changing the impact of AI.
PwC and McKinsey Respond
Other reports about AI job loss estimates have gained traction and similarly suggest a wave of automation is coming. The accounting firm PwC took the speculation a step further with their 2017 report, which was based on both the Oxford and the OECD studies. PwC combined the PIAAC dataset from the OECD with the automatibility data from Frey and Osborne to produce an entirely new projection of job loss. They found that 38 percent of U.S. jobs are at risk of automation by 2030, a result closer to Frey and Osborne’s original study.
McKinsey took data from the World Bank and the U.S Bureau of Labor Statistics O*Net database to break down 800 occupations into 2,000 activities. McKinsey then surveyed all of the jobs currently available and broke down those jobs into “performance capabilities needed for each activity based on the way humans currently perform them.” It further broke down activity into 18 capabilities and assessed their automation potential. From here it assumed that “each hour of work that could be automated will result in proportional job loss, for example if 10 percent of current work activity hours in an occupation will be automated, then 10 percent of jobs in that occupation will be displaced.”
McKinsey organized its projections into early-, mid-, and late-adoption scenarios, and provided a range of how many jobs worldwide that will face automation. At the mid-point scenario, 400 million jobs worldwide will face automation by 2030, while 800 million jobs worldwide will face automation in the fastest rate. McKinsey suggested that United States could lose between 16 million and 54 million jobs between 2016 and 2030.
What Policymakers Should Know
Altogether, there are four primary issues of concern in these prediction reports.
First, the projections mentioned above aren’t compared against current economic baselines, and thus there is no counterfactual on which to compare the job loss projections. For policymakers, it is important to know how these projections diverge from the current baseline rate of change.
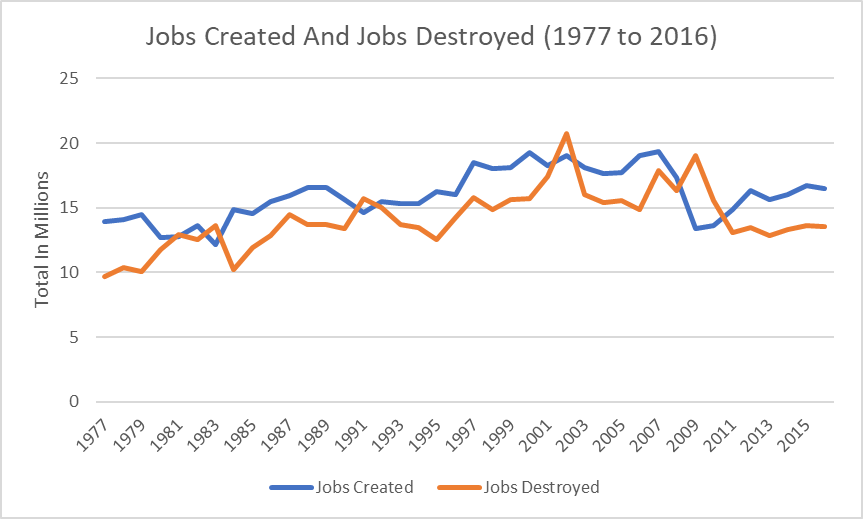
In the decade between 2006 and 2016, for example, over 51 million jobs were destroyed, while 179 million jobs were created. The chart below details the number of jobs created and destroyed since data was first collected. Since jobs totaled 152 million in December 2016, the total number of job deaths over the previous decade amounted to about a third of that amount—not that far off from some estimates of AI job loss.
Job-opening and labor-turnover measures further underscore the dynamism of the economy. In any given month in 2018, around 3.5 to 4 percent of the total workforce left a job and devoted their time somewhere else. Most workers stay at a job for 4 years and then move on.
All of this dynamism is the result of an innovative and shifting economy. Among the best known fallacies in economics, first written about in 1891, is the assumption that there is a fixed amount of work, known as a lump of labor, that is simply shifted around. Of course, the number of jobs has expanded massively since the 1890s. Old jobs might disappear, but new opportunities come into the market.
Second, each of the studies assumes a unidirectional impact, which simply doesn’t comport to reality. Economists typically talk about technologies as having a complementary or substitutionary effect on jobs. That is, they can either complement people by making their work more productive, which typically leads to higher wages, or technology can replace people. But automation technologies will impact specific tasks within specific jobs within specific firms within specific industries, all at different rates and directions. The differential effectiveness in different tasks means that the diffusion of automation technology will be uneven.
In the case of nursing homes, the implementation of automation technologies decreased the staffing levels by 5.8 percent in high-end nursing homes, while low-end homes saw an increase in staffing by 7.6 percent. As the authors of the study pointed out, “these findings suggest that the impact of automation technology on staffing decisions depends crucially on a facility’s strategic position in the local marketplace.” A study of Spanish manufacturing firms found that more productive firms are more likely to adopt robots, which leads to substantial output gains. In total, these firms tend to see an increase of jobs. At the same time, the report found “substantial job losses in firms that do not adopt robots, and a productivity-enhancing reallocation of labor across firms, away from non-adopters, and toward adopters.” Research into one specific Dutch company undergoing automation found similarly complex impacts. Overall, workers were more likely to separate from the firm and see a decrease in days worked, leading to lower wage incomes, but the overall wage rate didn’t change. These lost wage earnings were only partially offset by various benefits systems, but the lost earnings were disproportionately borne by older workers and workers with longer firm tenure.
Third, most of the studies detailed assume that AI will be costless to adopt, but like all innovations, AI will take time and capital to diffuse. As Frey and Osbourne wrote in a follow up to their original piece, “Our study wasn’t even a prediction. It was an estimate of how exposed existing jobs are to recent developments in artificial intelligence and mobile robotics. It said nothing about the pace at which jobs will be automated away.” As economists Daron Acemoglu & Pascual Restrepo made clear, there should be “no presumption that adjustment to the changed labor market brought about by rapid automation will be a seamless, costless and rapid process.”
It takes time for companies to adopt new technologies, incorporate them into decisions processes, and bring them to market. This reality was clearly true of the development of electricity, which took decades to diffuse because it was generally unwise to immediately replace manufacturing plants with a new and expensive technology that didn’t yield a huge return. As AAF detailed last summer, current efforts to switch to AI processes have come at a high cost. But since that research was published, countless other projects speak to the cost involved. For example:
- BMW and Daimler, long-time competitors, have been pooling resources to create autonomous vehicles because of the astronomical costs involved;
- Uber recently raised a $1 billion for its autonomous vehicles unit;
- McDonald’s purchased Silicon Valley VC-backed AI company Dynamic Yield, which was reportedly for over $300 million, making it the fast-food giant’s largest acquisition since it bought Boston Market in 1999;
- Ford invested nearly $1 billion in Argo for its work in autonomous vehicles;
- After a series of setbacks and tepid earnings, IBM Watson is cutting off sales of its artificial intelligence drug-discovery tool;
- Johnson & Johnson paid $3.4 billion to pick up surgical robotics pioneer Auris Health and its FDA-cleared Monarch platform in March;
- Total private investment into AI businesses in the United Kingdom exceeded £3.8 billion in 2018;
- SAS intends to spend $1 billion on AI research in the coming three years; and
- According to data from CB Insights, a record $9.3 billion went to U.S.-based AI startups in 2018, an $8.2 billion increase from the $1.1 billion raised in 2013.
And even if a company pumps money into AI, it doesn’t mean the end result will be more productive. A survey by Protiviti, a consulting firm on AI projects, found that only 16 percent of business leaders say they are getting significant value from AI. Furthermore, while businesses are aware of the importance of AI, the process of adopting such technology has been slow, particularly among small and medium enterprises. A report from Bluewolf found that only one in five (21 percent) small businesses have implemented AI-based solutions. And in the case of surgery, robots tend to be slower and more expensive.
Fourth, most predictions assume, as the Oxford Report does, that it is “largely already technologically possible to automate almost any task, provided that sufficient amounts of data are gathered for pattern recognition.” Yet, the jury is out on this very bold assumption. As a technical matter, much of the recent advancements are simply extensions of work done decades ago. Judea Pearl of the UCLA Computer Science Department, who is highly regarded for his research in this area, recently commented that, “All the impressive achievements of deep learning amount to just curve fitting.” Because of the difficulty in developing autonomous systems, many startups have simply hired humans to look like AI. Pseudo-AI, as it is known, is fairly common. Indeed, London-based venture capital firm MMC Ventures found that nearly 40 percent of Europe’s 2,830 AI startups had nothing to do with automation. Perhaps some skepticism is warranted.
Conclusion
The conflict and problems with these models illustrate the fundamental uncertainty on which they are based. Policymakers should observe the findings from these studies with caution. Altogether, these predictions say little about the changing structure of work. But they say even less about the appropriate policy responses.
Appendix 1
This table below lists the 70 occupations Frey and Osborne originally labelled. The rank of all 702 occupations can be found in their appendix. The occupations in bold are notable.
| SOC Code | Occupation | Label (Given by FO) | Predicted Probability |
| 29-1060 | Physicians and Surgeons | 0 | 0.0042 |
| 29-1021 | Dentists, General | 0 | 0.0044 |
| 11-9151 | Social and Community Service Managers | 0 | 0.0067 |
| 25-2011 | Preschool Teachers, Except Special Education | 0 | 0.0074 |
| 21-2011 | Clergy | 0 | 0.0081 |
| 29-1111 | Registered Nurses | 0 | 0.009 |
| 21-1013 | Marriage and Family Therapists | 0 | 0.014 |
| 11-1011 | Chief Executives | 0 | 0.015 |
| 11-9031 | Education Administrators, Preschool and Childcare Center/Program | 0 | 0.015 |
| 17-2051 | Civil Engineers | 0 | 0.019 |
| 27-1022 | Fashion Designers | 0 | 0.021 |
| 21-1011 | Substance Abuse and Behavioral Disorder Counselors | 0 | 0.033 |
| 23-1011 | Lawyers | 0 | 0.035 |
| 13-1121 | Meeting, Convention, and Event Planners | 0 | 0.037 |
| 17-1012 | Landscape Architects | 0 | 0.045 |
| 29-9799 | Healthcare Practitioners and Technical Workers, All Other | 0 | 0.055 |
| 13-1041 | Compliance Officers | 0 | 0.08 |
| 39-9011 | Childcare Workers | 0 | 0.084 |
| 35-1011 | Chefs and Head Cooks | 0 | 0.1 |
| 17-2071 | Electrical Engineers | 0 | 0.1 |
| 19-2012 | Physicists | 0 | 0.1 |
| 39-5012 | Hairdressers, Hairstylists, and Cosmetologists | 0 | 0.11 |
| 39-6012 | Concierges | 0 | 0.21 |
| 27-2021 | Athletes and Sports Competitors | 0 | 0.28 |
| 19-1023 | Zoologists and Wildlife Biologists | 0 | 0.3 |
| 47-2152 | Plumbers, Pipefitters, and Steamfitters | 0 | 0.35 |
| 53-2031 | Flight Attendants | 0 | 0.35 |
| 17-1022 | Surveyors | 1 | 0.38 |
| 23-1023 | Judges, Magistrate Judges, and Magistrates | 0 | 0.4 |
| 23-1012 | Judicial Law Clerks | 1 | 0.41 |
| 19-3011 | Economists | 0 | 0.43 |
| 13-1051 | Cost Estimators | 1 | 0.57 |
| 11-3071 | Transportation, Storage, and Distribution Managers | 0 | 0.59 |
| 13-1161 | Market Research Analysis and Marketing Specialists | 1 | 0.61 |
| 53-5022 | Motorboat Operators | 1 | 0.62 |
| 53-3021 | Bus Drivers, Transit and Intercity | 1 | 0.67 |
| 53-3033 | Light Truck or Delivery Services Drivers | 1 | 0.69 |
| 37-2012 | Maids and Housekeeping Cleaners | 0 | 0.69 |
| 17-3022 | Civil Engineering Technicians | 1 | 0.75
|
| 35-9021 | Dishwashers | 1 | 0.77 |
| 45-3021 | Hunters and Trappers | 0 | 0.77 |
| 35-2011 | Cooks, Fast Food | 1 | 0.81 |
| 17-3012 | Electrical and Electronics Drafters | 1 | 0.81 |
| 47-2211 | Sheet Metal Workers | 1 | 0.82 |
| 43-5041 | Meter Readers, Utilities | 1 | 0.85 |
| 51-4011 | Computer-Controlled Machine Tool Operators, Metal and Plastic | 1 | 0.86 |
| 53-6021 | Parking Lot Attendants | 1 | 0.87 |
| 31-9094 | Medical Transcriptionists | 1 | 0.89 |
| 27-3042 | Technical Writers | 1 | 0.89 |
| 51-6031 | Sewing Machine Operators | 1 | 0.89 |
| 53-3041 | Taxi Drivers and Chauffeurs | 1 | 0.89 |
| 43-4161 | Human Resources Assistants, Except Payroll and Timekeeping | 1 | 0.9 |
| 13-2081 | Tax Examiners and Collectors, and Revenue Agents | 1 | 0.93 |
| 53-7051 | Industrial Truck and Tractor Operators | 1 | 0.93 |
| 13-2011 | Accountants and Auditors | 1 | 0.94 |
| 35-3031 | Waiters and Waitresses | 0 | 0.94 |
| 43-5021 | Couriers and Messengers | 1 | 0.94 |
| 23-2011 | Paralegals and Legal Assistants | 1 | 0.94 |
| 51-2022 | Electrical and Electronic Equipment Assemblers | 1 | 0.95 |
| 43-2011 | Switchboard Operators, Including Answering Service | 1 | 0.96 |
| 39-3011 | Game Dealers | 1 | 0.96 |
| 13-1074 | Farm Labor Contractors | 1 | 0.97 |
| 41-2011 | Cashiers | 1 | 0.97 |
| 43-4071 | File Clerks | 1 | 0.97 |
| 43-4041 | Credit Authorizers, Checkers, and Clerks | 1 | 0.97 |
| 13-1031 | Claims Adjusters, Examiners, and Investigators | 1 | 0.98 |
| 13-2041 | Credit Analysts | 1 | 0.98 |
| 13-2072 | Loan Officers | 1 | 0.98 |
| 43-9021 | Data Entry Keyers | 1 | 0.99 |
| 13-2053 | Insurance Underwriters | 1 | 0.99 |
Frey and Osborne labelled the occupation “surveyors” as becoming automatable (1), but their model predicted it to have a 38 percent chance of becoming automatable, falling into the medium-risk category. They labelled “judicial law clerks” as becoming automatable (1), but their model predicted it to have a 41 percent chance of becoming automatable. Frey and Osborne labelled “transportation, storage, and distribution managers” as not becoming automatable (0), but their model predicted the occupation to have a 59 percent chance of becoming automatable. They also label “maids and housekeeping cleaners” as not becoming automatable (0), but their model predicted it to have a 59 percent chance of becoming automatable. “Hunters and trappers” were labelled as not becoming automatable (0), but the model predicted it to have a 77 percent chance of becoming automatable, which falls into the high-risk category. “Waiters and waitresses” were also labelled as not becoming automatable (0), but the model predicted this occupation to have a 94 percent chance of becoming automatable. In short, of the occupations that Frey and Osborne chose as the ones they were most confident would either be automated or not, their modeling did not always result in probabilities that corresponded to how Frey and Osborne originally labelled them.