Insight
July 20, 2021
Understanding the National Increase in House Prices
Executive Summary
- National house prices are fifteen percent higher than at the same point in the previous year.
- Housing demand is high as a result of historically low mortgage rates and a coronavirus-inspired flight from heavily populated urban areas to smaller cities.
- Housing supply is low as a result of insufficient new builds due to an absence of labor, high construction costs, and restrictive local zoning; existing homeowners have proven reluctant to return their homes to the market.
- Despite these factors, available housing data suggest that future movement will be away from the extremes as both mortgage rates and housing supply increase.
Context
As housing data for the first quarter of 2021 have become available, the national media is considering with increasing alarm the rising price of housing. Bloomberg notes that real estate prices are soaring and considers the parallels to the previous financial crisis. The Financial Times comments that the rate of housing-price increase has been higher than at any point in the previous 30 years. Reuters notes the steady decrease in home sales, crediting not just high prices but also low inventory.
While data at the national level are readily available, the vast interconnected networks that make up the national housing market make the precise reason or reasons for these changes difficult to identify with certainty. Conversely, it is comparatively simple to identify the general trends impacting the housing market in order to understand the factors impacting the steady and, more recently, sharp increase in prices.
Housing demand is especially high as a result of low mortgage rates and a coronavirus-inspired flight from large urban centers and into homes better suited for remote working. Despite high prices, the risks of an economic crash as a result of a collapse of the housing market appear low due to the low availability of mortgage credit. The rate of homeownership is on track to fall, however, and housing inequalities will be exacerbated. Housing supply is constrained by a dearth of new construction as a result of labor availability, the cost of materials, and restrictive local regulations. Existing homes are not returning to the market at typical rates as economic stresses, the low mortgage rate environment, and the unknowns of listing a home in the backdrop of a global pandemic caused homeowners to delay or cancel their plans to list. Despite these factors, housing inventory is increasing, indicating that housing supply will start to rise to meet these exceptional demands.
A National Increase in House Prices
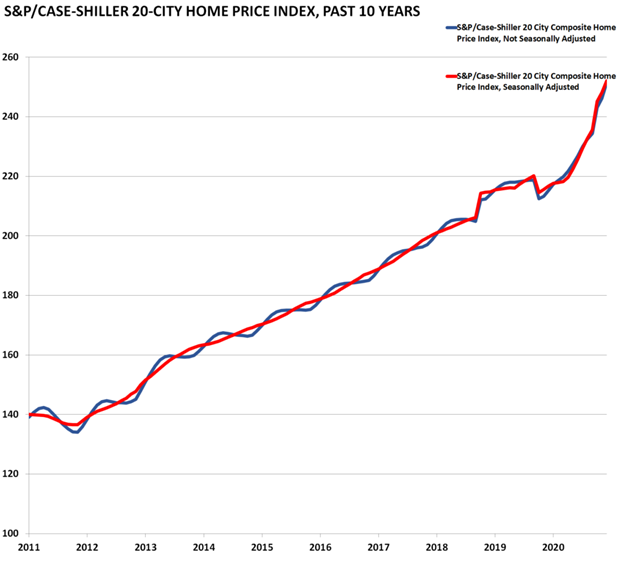
Source: The Federal Reserve Bank of St. Louis
The S&P/Case-Shiller home price index is released near the end of each month for the two previous months. The release is an index of home prices in 20 of the largest metropolitan areas across the country. It is a reputable and widely reported indicator of home prices.

Source: The Federal Housing Finance Agency
Similar to the Case-Shiller Index, the Federal Housing Finance Agency’s House Price Index (HPI) is a broad measure of single-family house prices. Information for the index is derived from properties whose mortgages have been purchased or securitized by Fannie Mae or Freddie Mac from all 50 states and DC.
By either S&P/Case Shiller 20-City or the FHFA indices, a relatively steady increase in house prices over the last decade is obvious. This trend in itself is a valuable data point in trying to understand this rise, as it seems to imply that the rise in house prices is not entirely tied to one-off factors, from recessions to the unique economic implications of the coronavirus pandemic, and are therefore the result of trends across a broader timeframe. This argument, however, begins to break down when housing prices are viewed not simply as a point in time but by reference to the best possible data point to adjust for seasonal and other factors – the same month, the year before.
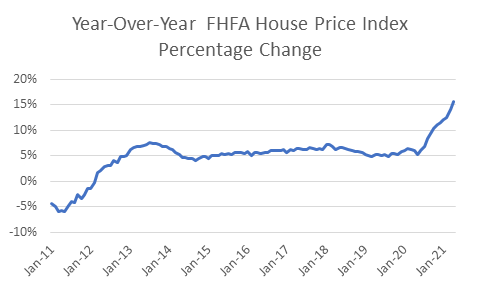
Between 2014 and 2020 the United States saw a steady increase in house prices of roughly five percent each month when compared to that same month the year before. While the five percent growth is in itself interesting, and can clearly be tied to those much wider housing market trends, the shocking rise seen in 2021 of between 12 and 16 percent from the previous year indicates a specific cause: Occam’s Razor would suggest the impacts of the coronavirus pandemic.
The size of the housing market and the sheer number of interconnected nodes in the network make assigning discrete causes to the rising cost of houses difficult, a task made more complex by the lag in the reporting of housing-market data. The levers of the housing market are themselves known, however, and it is these factors, including the more specific and unusual impacts due to the coronavirus pandemic, that are likely causing the increase in housing prices.
Unprecedented Demand
Low Mortgage Rates
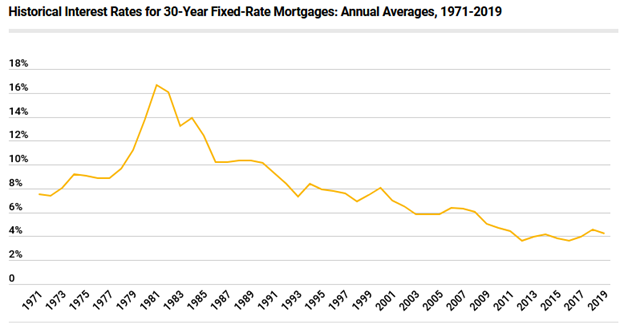
Source: Lending Tree
The cost of borrowing to buy a house has been falling since 1981. As the interest rates on fixed-rate mortgages fall, so too does the amount above principal that homeowners will have to spend over the life of their mortgage. A homeowner buying a $200,000 home with a 20 percent deposit in 1991 might receive a 10 percent fixed-rate mortgage and pay $577,000 over the life of that mortgage. The same homebuyer today might receive a 3 percent fixed-rate mortgage and pay $314,000 over the life of the mortgage, making the 2021 home $263,000 cheaper than the same home 30 years ago. (Without accounting for inflation and other contextual economic factors, these figures are only a guide.) Although rates are hovering at about 3.1 percent in July 2019, the Mortgage Bankers Association estimates that mortgage rates will rise to about 3.3 percent by the end of the year as part of a trend of at the very least a highly arrested descent.
These attractive financial circumstances come as the United States’ largest generation, millennials, are now reaching peak home-buying age, creating a large pool of buyers financially incentivized to buy. This tech-savvy generation’s use of virtual tours, coupled with the stay-at-home guidelines, led to an astonishing 63 percent of all homes in 2020 sold sight unseen.
Despite demand reaching record heights, mortgage credit availability has sharply declined. Mortgage credit availability quantifies how difficult it is to obtain a mortgage by measuring mortgage lenders’ tolerance for risk.
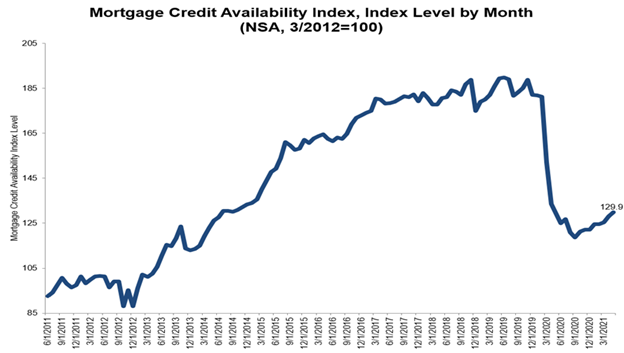
Source: Mortgage Bankers Association
Mortgage lenders have raised lending standards near continuously, and above the requirements of the 2010 Dodd-Frank Act. Loans are smaller in relation to house prices and borrower income, and borrowers must have better credit ratings. This shift has two key implications. First, house demand may in fact be understated due to higher barriers to entry (although the last year has seen some improvement in credit availability, this uptick does not seem to be significant enough to explain such a dramatic upswing in house prices alone). Second, reduced risk in the housing market makes the chances and possible impact of a housing finance collapse less concerning. Further, adjustable mortgages, which run the risk of making mortgages uneconomic in the event of rising rates, represent less than a tenth of a percent of mortgages issued, in comparison to 60 percent at the time of the previous financial crisis.
While it is good news that the economy might avoid a financial collapse if this is a housing bubble and it does collapse, rising house prices do have a negative impact on housing inequality. Over the next two decades, younger millennials will have a home ownership rate of 64 percent, lower than the 72 percent of boomers who owned homes at the same age. The racial home ownership gap will also increase as much as four percentage points for the elderly Black population.
Coronavirus-Inspired City Flight
With roughly 25 percent of U.S. workers working from home or remotely over the pandemic, the coronavirus has caused a unique re-consideration of what people demand of their home, whether it be a home office, home gym, or to not be located in a metro center at all. Almost 16 million people moved in the first six months of the pandemic, and the vast majority of moves were from densely populated areas and high-cost areas such as California to smaller cities in less expensive states.
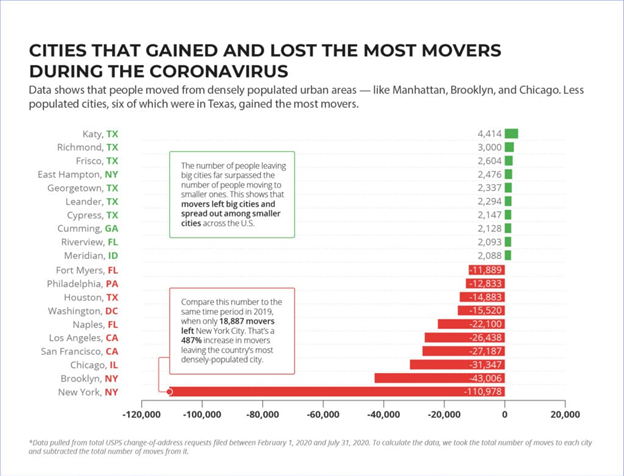
Source: MyMove
These findings were also born out within the FHFA house price index when considering how house prices have increased year-over-year by region.
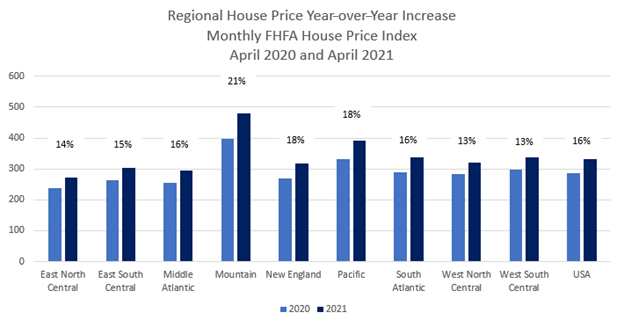
Nationally house prices rose the most in the month of April for the Mountain region, defined by the U.S. Census as Montana, Idaho, Wyoming, Nevada, Utah, Colorado, Arizona, and New Mexico. In May 2021, the highest year-over-year rise in housing prices was in Coconino County Arizona, at 31.5 percent, double the national average. Coconino County had a population of only 143,476 in 2019. Online real estate market Zillow estimates that the average home spent 25 days on the market in 2020, but noted that homes in Columbus, OH, Denver, CO, Raleigh, NC, and Seattle, WA all spend an average of less than 10 days on the market.
Supply-Side Shortages
Insufficient Construction of New Homes
The total inventory of homes available for sale fell 26 percent in January 2021 year-over-year. At its lowest point, the Federal Reserve Bank of St. Louis estimated that there remained only three and a half months of total housing inventory – in other words, only three and a half months without construction before there would be no homes available in the United States.
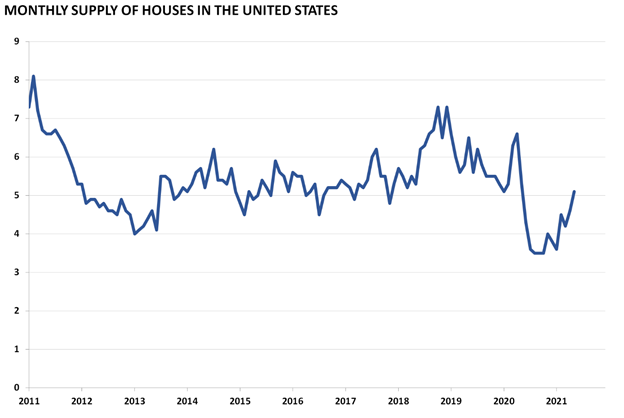
Source: The Federal Reserve Bank of St. Louis
Data on the construction of new homes (or “housing starts”) are released by the Census Bureau as part of its “New Residential Construction” report. Starts and permits are important indicators on the supply side of the housing market as new homes tadd to the total inventory of homes available.

Housing starts took a severe hit across all regions in 2020, indicating that, as before, while underlying trends were not positive the coronavirus pandemic magnified these movements and added new complications. Several reasons are usually given for the lack of new housing starts. While labor costs have not risen significantly in the last year, over the previous decade labor costs have factored into the rising costs of homes. The coronavirus pandemic and stay-at-home orders, however, significantly limited the availability of labor. The rising cost of lumber against the background of supply chain disruption and global inflation is also cited as a key aspect, with softwood prices recording a 154.3 percent increase year over year in May 2021, and import prices up 11 percent year over year. Burdensome local zoning restrictions impacting new builds have restricted new construction even in municipalities keen to expand the supply of available housing.
Despite the 2020 results, housing starts are returning to normal levels and growing at a level expected prior to the pandemic. While this increase is to be welcomed, housing inventory was low prior to the pandemic and dismal performance of the last year means that total supply of new homes remains low, albeit improving.
Existing Homes are Not Returning to the Market
The above-mentioned large class of millennials reaching home-buying age and a growing homeowner wealth disparity has fueled an expansion in first-time and second-home purchases. In neither instance does the buyer return their existing home to the market, decreasing total housing inventory. Even where homeowners are not seeking to buy a different home, there is a slower release of homes to the market. The economic stresses of the pandemic, low rates, and an unwillingness to allow in-person tours of the home are all suggested to have contributed to homeowners who might otherwise have listed their home delaying their plans or cancelling them altogether. Nonetheless, a rebound in the existing home sale inventory can also be seen in addition to new starts, growing from a low of 1,030,000 units in January 2021 to 1,230,000 units in May 2021.
Conclusions
Many of the exceptional data points seen over the last two years under the coronavirus pandemic are beginning to return to normal. Mortgage rates are predicted to rise, decreasing both the financial incentive to buy and consumer demand. Total home inventory is expected to rise, allowing supply to come closer to demand. The direction of monthly housing data results appear to be toward normal, although demand and supply are likely to be adversely impacted by the end of federal aid programs. Lumber and other material prices may continue to rise in the background of increasing inflation. Even outside of the economics of the pandemic, however, it seems likely that demand will continue to outpace supply, particularly as Americans continue to reassess what they need from their living spaces. High demand, a growing housing inequality, and an increasing class of millennials unable to become homeowners suggest that even though the unique stresses of the pandemic may have been weathered, policy challenges will remain even as the United States returns to a post-pandemic normal.