


Insight
July 17, 2018
Understanding the U.S. Poverty Rate
The White House Council of Economic Advisers (CEA) recently put a spotlight on the U.S. poverty rate in a report that argued for “strengthening and expanding” work requirements in the social safety net.[1] In particular, the CEA argued that although the official poverty rate measured by the Census Bureau has essentially been flat since the 1960s, when “correctly measured” it has actually fallen considerably due to safety net programs. The ensuing media coverage and debate have glossed over the many complexities and nuances underlying poverty measurement.
Last year, an American Action Forum (AAF) study drew three important conclusions regarding the Census Bureau’s official measure of the U.S. poverty rate.[2]
- The official poverty measure is not very useful.
The official poverty measure, developed in the 1960s, is not a very useful metric, particularly when applied to public policy. For policymakers, there are two major components to consider when determining the extent of poverty in the United States. First, how often are individuals in the United States unable to earn enough money on their own in order to avoid poverty? Second, how often do individuals remain in poverty even after receiving assistance from the government? The former indicates how well markets on their own are distributing resources to the least advantaged. The latter indicates how well the federal government is providing assistance to those in need.
Unfortunately, the Census Bureau’s official poverty rate tells us neither. To understand the first component, a poverty measure should only take into account the income households earn on their own. To understand the second component, a poverty measure should take into account all the income households earn on their own plus all the benefits they receive from the government. The official poverty measure takes into account the income households earn on their own as well as some, but not all, benefits they receive from the government. In particular, the metric includes income received from government cash assistance, but it excludes non-cash benefits and does not account for the impact of taxes. So, the poverty rate indicates neither how often households are unable to support themselves nor how often they remain in poverty despite receiving government benefits. In order to determine the best ways for the government to help low-income households, however, policymakers must be able to understand both.[3]
- Self-sufficiency has not changed in over 30 years.[4]
When re-measuring the Census Bureau’s official poverty rate by excluding all government assistance and only incorporating income households earn on their own, the AAF study found that in recent years households have been unable to support themselves at the same rate as in the early 1980s. Chart 1 below contains the official poverty rate when excluding all government benefits from 1980 to 2013.
Chart 1: Self-Sufficiency Poverty, 1980-2013
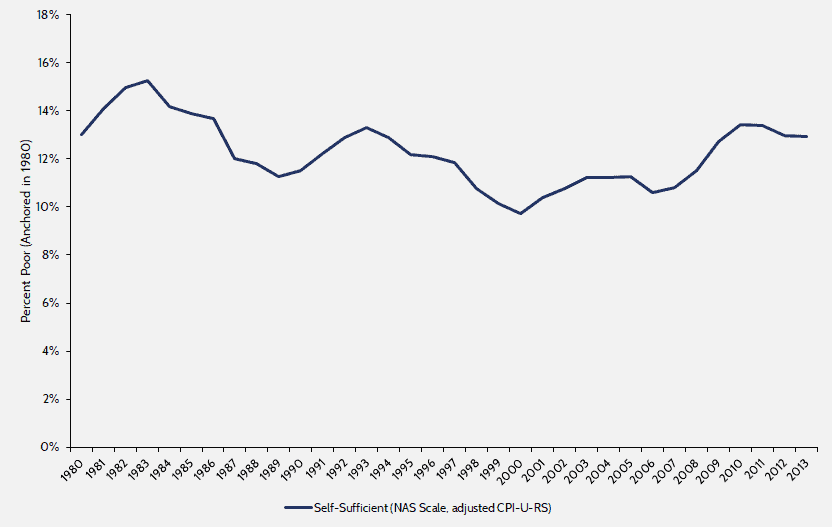
In 1980, 13 percent of individuals lived in households that did not earn enough on their own to escape poverty. In 2013, the “self-sufficiency” poverty rate was unchanged. These figures suggest that despite spending billions of dollars on the War on Poverty, the government has failed to raise self-sufficiency, as individuals on their own are no more likely to be free of poverty today than they were over 30 years ago.
- Thanks to safety net programs, material deprivation has declined dramatically since the 1980s.
When re-measuring the official poverty rate by including all government assistance and considering the impact of taxes (or tax benefits in most cases for low-income households), the AAF study found that households in recent years have been much less likely than households in 1980 to be in poverty. Chart 2 adds to Chart 1 the official poverty rate when taking into account government assistance and taxes.
Chart 2: Self-Sufficiency and Material Deprivation Poverty, 1980-2013
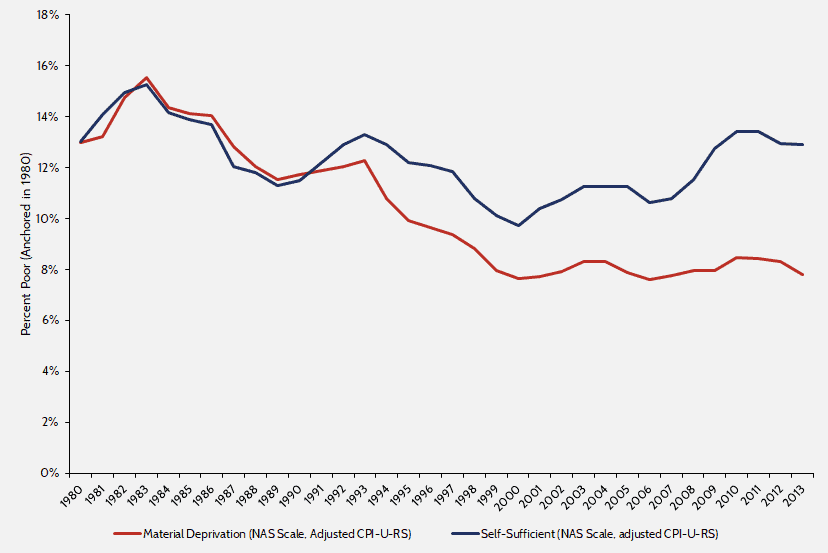
As of 2013, the “material deprivation” poverty rate indicates that 7.8 percent of individuals lived in households that were in poverty even after receiving government benefits. That’s a 5.2-percentage point drop from the 13 percent “self-sufficiency” poverty rate in 2013 or a difference of about 16.2 million people. In other words, government benefits kept 16.2 million individuals out of poverty in 2013.
Additionally, a large and growing literature indicates that government surveys like the Current Population Survey do not adequately record income that low-income households earn, and the government benefits they receive.[5] This literature often concludes that consumption, rather than income, is a more adequate measurement of household material well-being. The literature argues that data measuring consumption are more accurate and better reflects all resources available to households.[6]
Chart 3 adds to Chart 2 the rate at which household consumption fell below the poverty threshold from 1980 to 2013.
Chart 3: Self-Sufficiency, Material Deprivation, and Consumption Poverty, 1980-2013
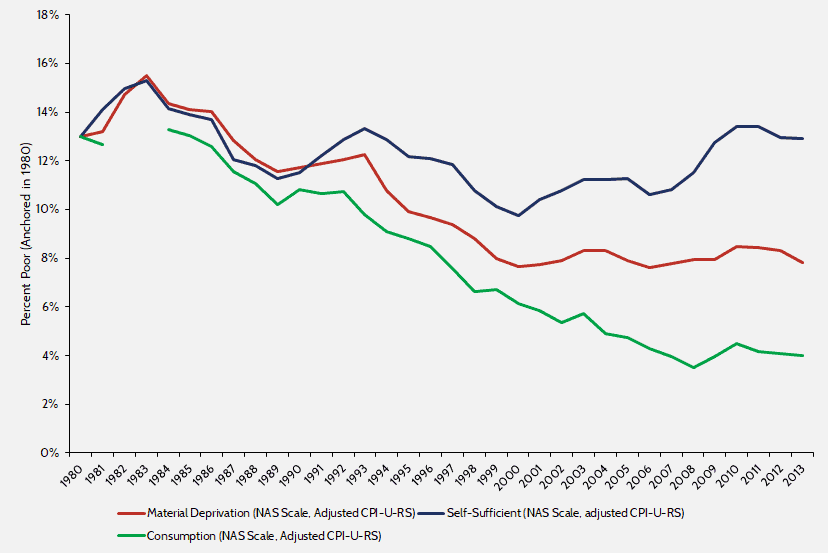
In 2013, the “consumption” poverty rate suggests that only 4 percent of individuals lived in households that spent less than the poverty thresholds. That’s a 3.8-percentage point drop from the 7.8 percent material deprivation poverty rate, or a difference of 12.1 million people. Additionally, it is a 9-percentage point decline from the 2013 “self-sufficiency” poverty rate or a difference of 28.3 million people.
Conclusion
Measuring poverty is a complex and nuanced issue, and it is vital that policymakers understand the limitations of the Census Bureau’s official poverty measure. This measure indicates neither how often households are unable to support themselves nor how often they remain in poverty even after receiving government benefits.
Both the “material deprivation” and “consumption” poverty rates indicate that safety net programs have successfully reduced material deprivation and have prevented millions of people from living in poverty. Yet, the unmoved “self-sufficiency” poverty rate indicates that safety net programs have not helped individuals become more able to support themselves. This conclusion suggests that future efforts to enhance the safety net should aim to improve self-sufficiency, primarily through education and work.
[1] “Expanding Work Requirements in Non-Cash Welfare Programs,” The Council of Economic Advisers, Executive Office of the President of the United States, July 2018, https://www.whitehouse.gov/wp-content/uploads/2018/07/Expanding-Work-Requirements-in-Non-Cash-Welfare-Programs.pdf.
[2] Ben Gitis and Curtis Arndt, “Material Well-Being vs. Self-Sufficiency: How Adjusting Poverty Measurements Can Reveal a Diverging Trend in America,” American Action Forum, March 9, 2017, https://www.americanactionforum.org/research/material-well-vs-self-sufficiency-adjusting-poverty-measurements-can-reveal-diverging-trend-america/.
[3] The official poverty rate also contains two mechanical flaws. First, it does not appropriately compare incomes among households of different sizes and compositions. For instance, $50,000 is a lot more to a one-person household than it is to a three-person household. When examining the various poverty metrics, AAF corrects for this flaw by using the equivalence scale recommended by the National Academy of Sciences (NAS). Second, the Census Bureau uses the Consumer Price Index for all Urban Consumers (CPI-U) to adjust the poverty thresholds for inflation each year. The CPI-U, however, is well understood to overstate inflation by roughly 1 percentage point annually. AAF corrects for this problem by using the CPI-U-RS, a research series that incorporates improvements to the price index. The AAF study found that these two changes together lower the 2013 official poverty rate from 14.5 percent to 9.4 percent.
[4] All measures of poverty reported in points 2 and 3 are anchored to the official poverty rate in 1980, which was 13 percent. This means that after making adjustments to address flaws in the measure, the poverty thresholds are set in 1980 so that under each measure 13 percent of people are considered to be in poverty in 1980. For the following years, these poverty thresholds are held constant (in inflation-adjusted dollars using CPI-U-RS). This anchoring technique allows for a direct comparison between the various poverty measures.
[5] See Bruce D. Meyer & James X. Sullivan, “Winning the War: Poverty from the Great Society to the Great Recession,” NBER Working Paper, January 2013, http://www.nber.org/papers/w18718.
[6] Bruce D. Meyer & James X. Sullivan, “Identifying the Disadvantaged: Official Poverty, Consumption Poverty, and the New Supplemental Poverty Measure,” Journal of Economic Perspectives, Volume 26, Number 3, Summer 2012, http://www.dicdoha.net/sites/default/files/MeyerSullivanJEP2012.pdf.
