Research
March 9, 2017
Material Well-Being vs. Self-Sufficiency: How Adjusting Poverty Measurements Can Reveal a Diverging Trend in America
Executive Summary
The United States has a long history of anti-poverty policy and since the 1960s the Census Bureau has published official rates of poverty. Unfortunately, there are two interesting aspects of poverty – material well-being and the capacity for economic self-sufficiency – and the official poverty measure tells us neither. In this paper, we examine the Census Bureau’s official poverty measure, how it was developed, and the reasons it is an ambiguous indicator of resource deprivation. Then we illustrate ways to adjust the measure so that it either more closely reflects all the resources available to households (to measure material deprivation) or more closely reflects the income households earn on their own (to measure self-sufficiency).
Summary Chart: Official, Material Deprivation, and Self-Sufficient Poverty Rates, 1980-2013
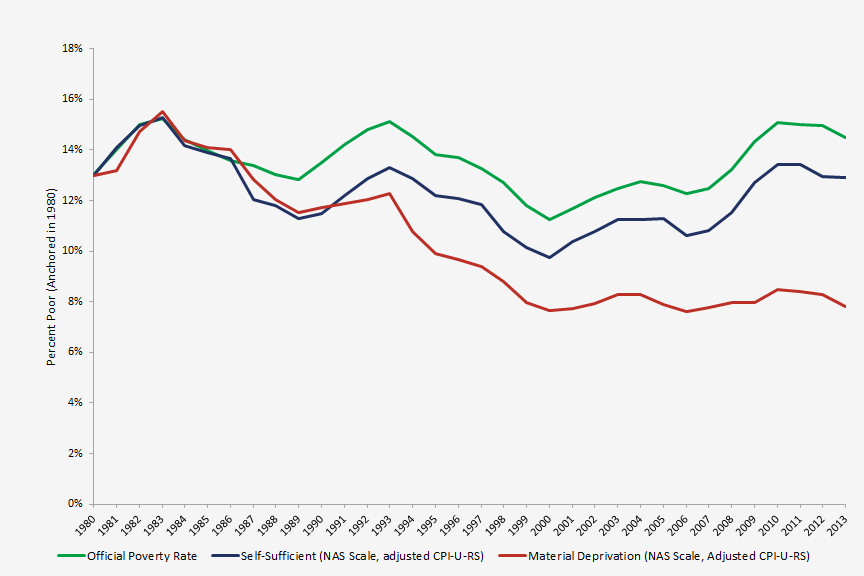
Overall, we find two diverging trends: while public policy has effectively reduced material hardship, it has not improved self-sufficiency. In particular, between 1980 and 2013, despite the official poverty rate increasing from 13 percent to 14.5 percent, material deprivation poverty fell to 7.8 percent. Self-sufficient poverty, however, remained flat at 13 percent. These trends have the following implications:
- In 2013, 21.2 million fewer people suffered material hardship than the official poverty thresholds indicate.
- But, 16.2 million more people in 2013 were in self-sufficient poverty than in material deprivation poverty, meaning that 16.2 million more people would have been in poverty if they did not receive any government assistance.
These findings indicate that federal anti-poverty programs have greatly reduced suffering in low-income households. However, those programs have not enabled more households to earn enough income on their own to support themselves. So, the next stages in federal anti-poverty policy should emphasize ways to increase independence by pursuing pro-work solutions that build skills and place low-income workers onto stable career paths.
Introduction
There are many forms of resource deprivation. People who are homeless are deprived of a roof over their head, those who cannot afford adequate food are deprived of a nutritious diet, and anyone who cannot pay for a vehicle or public transportation is deprived of an opportunity to go to work. People facing deprivation live in households that lack adequate income to afford the basic necessities of life. The U.S. government attempts to identify the prevalence of resource deprivation in the United States with its official poverty measures. Specifically, the U.S. Census Bureau establishes household income thresholds deemed to be the bare minimums required to meet basic life necessities. Any household with an income below those thresholds is identified as impoverished.
In this paper, we dive into the official poverty measure, examining its effectiveness as a metric of deprivation. While the actual income thresholds for poverty are somewhat arbitrary, the trend in the poverty rate over time should reveal how deprivation has changed in recent history. Overall, there are two useful ways to examine poverty. First, after accounting for all sources of income and assistance, both government and non-government, how often do people still face material deprivation? Second, how many people are self-sufficient and able to earn enough income on their own to afford basic necessities? Unfortunately, the official poverty rate measures neither, making it difficult to analyze how public policy has influenced low-income households.
To address this issue, we adjust the official poverty measure to derive two separate metrics of deprivation. For the first, we examine how deprivation changes when taking into account all sources of income, resulting in a measure of material well-being. For the second, we strip out all sources of income except for those that a household generates on its own, leading to a measure of self-sufficiency. In the end, we find two distinct trends: Poverty as a measure of well-being has fallen dramatically over the last three decades, but poverty in terms of self-sufficiency remains high. So, while federal and state benefits have gone a long way toward improving material well-being, they have failed to increase self-sufficiency of low-income households. This suggests that the next steps in federal anti-poverty policy should focus on increasing independence through pro-work initiatives that develop skills and place low-income workers on stable career paths.
Mollie Orshansky and the Development of the Official Poverty Measure
The U.S. government’s official poverty measure is based on household income thresholds, under which a household is considered to have inadequate resources. Those income thresholds were originally developed in the early 1960s by Mollie Orshansky, an economist for the Social Security Administration. Besides a few minor revisions, the thresholds have only been adjusted for inflation ever since.[1]
Orshansky indicated that she did not establish her income thresholds in order to measure poverty generally. Rather, she wanted a measure that would allow analysts to evaluate risks in vulnerable households and how those risks compare based on household size and family type. Moreover, instead of using a “market basket” of the minimum set goods and services a household needs for an adequate standard of living, Orshansky based her income thresholds only on a household’s ability to afford adequate food. Orshansky only took food into account because at the time, she believed it was the only good that had any established guidelines for adequate consumption.[2]
Using food plans established by the Department of Agriculture, Orshansky estimated for each household size and type the minimum income required to afford adequate diets. Orshansky originally developed two separate sets of poverty thresholds, one based on the Department of Agriculture’s lowest cost “economy” food plan, and the other was based on the department’s second-lowest cost “low-cost” food plan. Each food plan indicated a minimum amount of food an individual requires, with the “economy” plan representing a bare minimum intended for temporary use.[3]
To estimate the minimum income required to afford each food plan, Orshansky made use of the Department of Agriculture’s 1955 Household Food Consumption Survey. In particular, she calculated the portion of household income generally spent on food and assumed that in order to afford each food plan, the same portion of income would be spent on food, with households using their remaining income on other life necessities. In effect, she multiplied the inverse of the portion of income spent on food by each food plan to establish two sets of poverty thresholds for all household sizes and types.[4]
Using the 1955 Household Food Consumption Survey, Orshansky found that for households with three or more people, the average value of food consumed each week represented one-third of household income. Accordingly, Orshansky developed two thresholds by multiplying the economy food and low-cost food plans by three (the inverse of one-third) for each household type with at least three people. Households with two people spent an average 27 percent of incomes on food. So, for those households, Orshansky set the two poverty thresholds by multiplying each food plan by 3.7 (the inverse of 27 percent). For one-person households, the poverty thresholds were set to 80 percent of the thresholds for two-person households with only adults. Since the value of the food required and the multiplier used differed by household size and type, the result for each food plan was a set of income thresholds, one for each household type. The thresholds varied by total number of household members, number of children, number of adults, and whether or not the household head was married.[5]
Although Mollie Orshansky did not intend for her income thresholds to be used as general poverty indicators, her work was quickly circulated after President Lyndon Johnson declared his War on Poverty in 1964. In 1965, the newly established Office of Economic Opportunity (OEO) implemented Orshansky’s lower “economy” threshold as its definition of poverty for statistical and budgetary purposes. In 1969, after minor revisions to the thresholds, the Bureau of the Budget officially adopted Orshansky’s thresholds as the official government measure of poverty. Going forward, the poverty thresholds would rise each year with the increase in the Bureau of Labor Statistics’ Consumer Price Index (CPI) to account for inflation. Outside of additional minor changes in 1981, no other adjustments have ever been made to the federal government’s official poverty thresholds.[6]
Flaws in the Official Poverty Measure
Usually, the federal government has two fundamental goals when implementing anti-poverty programs. The first is to provide relief to low-income households and improve their material well-being by issuing benefits like food stamps, welfare benefits, and health care. The second is to increase self-sufficiency among low-income households by increasing labor skills and imposing work requirements for accessing certain benefits.
Since President Johnson declared a War on Poverty, the federal government implemented multiple anti-poverty programs. These include Medicaid, Medicare, the Earned Income Tax Credit (EITC), food stamps, and others. But, according to the official poverty thresholds, despite all of these programs, there has been no change in the amount of deprivation in the United States.
Using the Current Population Survey (CPS), we recreated the Census Bureau’s poverty statistics using the official poverty thresholds.[7] Chart 1 illustrates official U.S. poverty rate from 1980 to 2013.
Chart 1: The Official Poverty Rate, 1980-2013
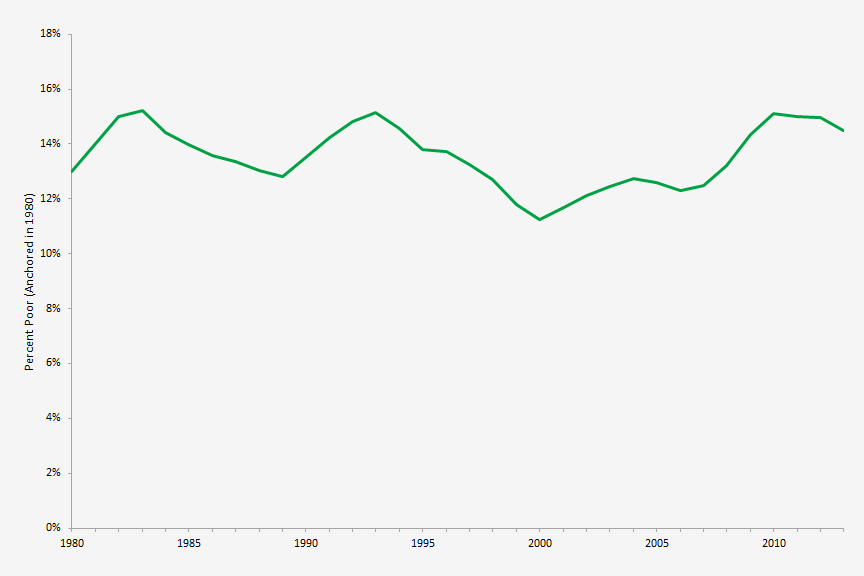
The official poverty measure offers a very bleak view of the hardship in the United States. In 1980, 13 percent of the U.S. population was in poverty and by 2013, the rate rose to 14.5 percent. This suggests that even with billions of federal dollars going towards poverty relief, the poverty rate has been flat for several decades.
The official poverty measure, however, faces several major flaws, making it a very ambiguous indicator of resource deprivation that does not clearly identify what it means to be in poverty. One obvious issue is the basis for the thresholds themselves. The official U.S. poverty thresholds are based on nutritional recommendations and spending patterns in the 1950s and 1960s. Clearly times have changed. Using data from the latest Bureau of Labor Statistics’ (BLS) Consumer Expenditure Survey, in Table 1 we examine the distribution of average household expenditures in 2015.
Table 1: Average Household Expenditures in 2015[8]
| Major Expenditure Category |
Average Spending |
Average Spending as Percent of Total Spending |
Average Spending as Percent of After-Tax Income |
| Total Spending |
$55,978 |
100.0% |
92.6% |
| Food |
$7,023 |
12.5% |
11.6% |
| Alcohol |
$515 |
0.9% |
0.9% |
| Housing |
$18,409 |
32.9% |
30.5% |
| Apparel |
$1,846 |
3.3% |
3.1% |
| Entertainment |
$2,842 |
5.1% |
4.7% |
| Transportation |
$9,503 |
17.0% |
15.7% |
| Healthcare |
$4,342 |
7.8% |
7.2% |
| Entertainment |
$2,842 |
5.1% |
4.7% |
| Personal Care |
$683 |
1.2% |
1.1% |
| Reading |
$114 |
0.2% |
0.2% |
| Education |
$1,315 |
2.3% |
2.2% |
| Tobacco and Smoking Supplies |
$349 |
0.6% |
0.6% |
| Miscellaneous |
$871 |
1.6% |
1.4% |
| Charity |
$1,819 |
3.2% |
3.0% |
| Insurance and Pensions |
$6,349 |
11.3% |
10.5% |
Orshansky’s poverty thresholds assume that the average household spends one-third of its after-tax income on food. That is no longer true. In 2015, the average household only spent 11.6 percent of its after-tax income on food. Households are spending more on housing (30.5 percent of after-tax income) and transportation (15.7 percent of after-tax income).
While this is a major issue that likely presents problems for federal benefits that use the official thresholds to determine household needs, in this paper we focus on separate problems that cause the poverty thresholds to have no analytical meaning. Primarily, the official poverty rates do not indicate if those in poverty are simply unable to afford basic needs on their own or if those in poverty still suffer resource deprivation after receiving assistance from the government. The official poverty thresholds do not enable analysts to make this distinction because of the forms of income the Census Bureau considers when identifying poverty.
There are three major flaws that cause the official poverty thresholds to be so ambiguous. First, the thresholds are based on a measure of income that is not comparable across household sizes and types. Second, annually, the thresholds rise with an inflation index that likely overstates the growth in prices in the United States. And third, the household income measure used to determine poverty status includes cash assistance from the government, but it excludes non-cash benefits and does not take into account taxes.
Consequently, since the official poverty measure does not take into account the effect of all government benefits, it does not fully represent how the material well-being of low-income households has changed over time. However, since it includes some government benefits, one is unable to use the threshold to understand how often people are unable to lift themselves out of poverty without any government assistance. This leaves the official poverty measure fairly useless and policymakers blind in judging the effectiveness of federal anti-poverty efforts.
Adjusting the poverty measurement to better understand material well-being and self-sufficiency, however, reveals how public policy has and has not impacted low-income households.
Addressing the Flaws in the Official Poverty Measure
We use the Current Population Survey to build alternative measures of poverty that address these shortcomings.[9] For each alternative poverty measure, we anchor the poverty rate to the official rate in 1980, which was 13 percent. This means that after making the adjustments to household income to address flaws in the official measure, for 1980 each poverty threshold is set so that the bottom 13 percent of income are identified as in poverty. For the following years, those poverty thresholds are held constant and only adjusted with appropriate inflation measures. By anchoring the alternative measures to match the official rate of 13 percent in 1980, we are able to directly compare the various poverty measures over time. This is the same method employed by Meyer & Sullivan (2013).[10]
Mechanical Issues
The first two flaws of the official poverty thresholds are technical issues regarding how the thresholds compare household income across family types and how they rise each year with inflation. The net effect of these two problems is that the official poverty measure overstates the poverty rate.
Equivalence Scale
To appropriately compare incomes among households of different sizes and composition, it is important that income is adjusted to reflect those differences. For instance, a household with only one person who earns $50,000 annually is in better shape than a household with two people with a total combined income of $50,000. Likewise, $50,000 is different for a household with three adults than it is for a household with two adults and one child.
To address this, standard practice is to apply an equivalence scale to household income that reflects diminishing marginal cost of expenses for each additional adult or child. For instance, if two adults each individually earn $25,000, living expenses would be less if they live together than if they live separately. Since Mollie Orshanksy developed the poverty thresholds using varying food requirements by household size and type, the official poverty thresholds used an implied equivalence scale. Many researchers, however, believe that it does not properly reflect diminishing marginal cost of living expenditures for larger households. Meyer & Sullivan (2013) recommend applying the equivalence scale (A + 0.7K)0.7, where A is the number of adults and K is the number of children.[11] This is also the equivalence scale recommended by a National Academy of Sciences (NAS) panel in 1995, as it accounts for both children costing less than adults (the equivalence scale assumes 30 percent less) and the diminishing marginal cost of each additional household member.[12]
Inflation Adjustment
To ensure that the purchasing power of official poverty thresholds remain constant each year as prices rise, the Census Bureau increases the thresholds at the rate of inflation, as measured by the BLS’s Consumer Price Index for all Urban Consumers (CPI-U). While adjusting the thresholds for inflation should ensure that the real values of the thresholds do not change, the CPI-U is known to overstate inflation. In 1996, the Boskin Commission concluded that the CPI-U overstates inflation by 1.1 percentage points annually.[13] So by using the CPI-U to adjust for inflation, each year the Census Bureau may be increasing the poverty thresholds at a quicker rate than inflation and, as a result, may be overstating poverty.
A better option is the CPI-U-RS, a research series that incorporates improvements in the price index. According to Meyer & Sullivan (2013), however, even the CPI-U-RS tends to overstate inflation by 0.8 percentage points annually. To address this, Meyer & Sullivan (2013) recommend utilizing an adjusted CPI-U-RS, where annual inflation is 0.8 percentage points lower than the BLS reports with the CPI-U-RS.[14]
Adjusted Official Poverty Rate
Chart 2 compares the official U.S. poverty rate to a poverty rate that incorporates the NAS equivalence scale and the adjusted CPI-U-RS. Going forward, we will refer to this alternative measure as the adjusted official poverty rate.
Chart 2: Official Poverty Rate and Adjusted Official Poverty Rate, 1980-2013
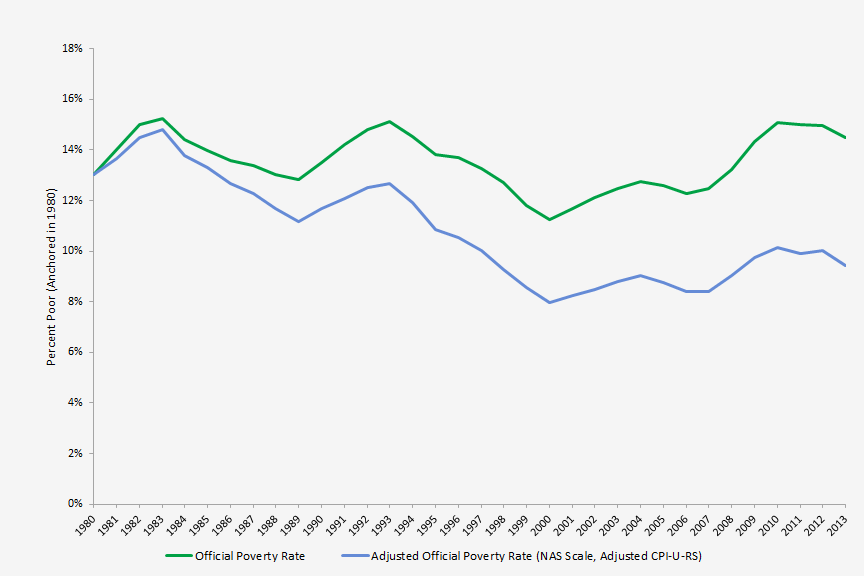
These two changes alone make a major difference in official measure of household deprivation. Because of the anchoring technique, 13 percent of people were in poverty in 1980 under both poverty measures. But by 2013, while the official poverty rate increased to 14.5 percent, the adjusted official rate fell to 9.4 percent. This 5.1 percentage point difference in the poverty rate represents 16 million people who under the adjusted rate were considered to be in poverty in 2013.
Material Well-Being
Although the adjusted official poverty rate indicates that the poverty rate is not as frequent as the official poverty thresholds suggest, it still overstates the rate of material deprivation in the United States. The best measure of material well-being is one that takes into account all resources available to the household after paying taxes and receiving government benefits.
The official poverty rate and adjusted official poverty rate are based on a household income measure that includes all income people earn on their own and cash assistance from the government. The cash assistance includes benefits like Social Security, unemployment compensation, and welfare. However, household income is measured before taxes and it excludes tax credits and noncash benefits. This means that payroll taxes, as well as state and federal income taxes, are not subtracted from household income before the poverty measurement is taken. Moreover, since the official poverty threshold is measured against pre-tax household income, it does not add to income the benefits that are distributed through the tax code, like the earned income tax credit and the child tax credit. In addition, the household income measure excludes noncash benefits from the government like food stamps, Medicaid and Medicare, and housing subsidies. Finally, the measure also excludes from income the value of non-cash benefits received in the private sector, such as employer health benefits.
To examine overall material deprivation in the United States, household income must be adjusted by adding to it all non-cash benefits and benefits received through the tax code and subtracting all taxes paid to federal, state, and local governments. A fuller explanation of all the sources of income included under each poverty threshold is available in the appendix.
Chart 3 compares the adjusted official poverty rate with an after-tax income plus noncash benefits poverty rate, which more closely represents the rate at which people in the United States suffered material deprivation.
Chart 3: Adjusted Official and Material Deprivation Poverty Rates, 1980-2013[15]
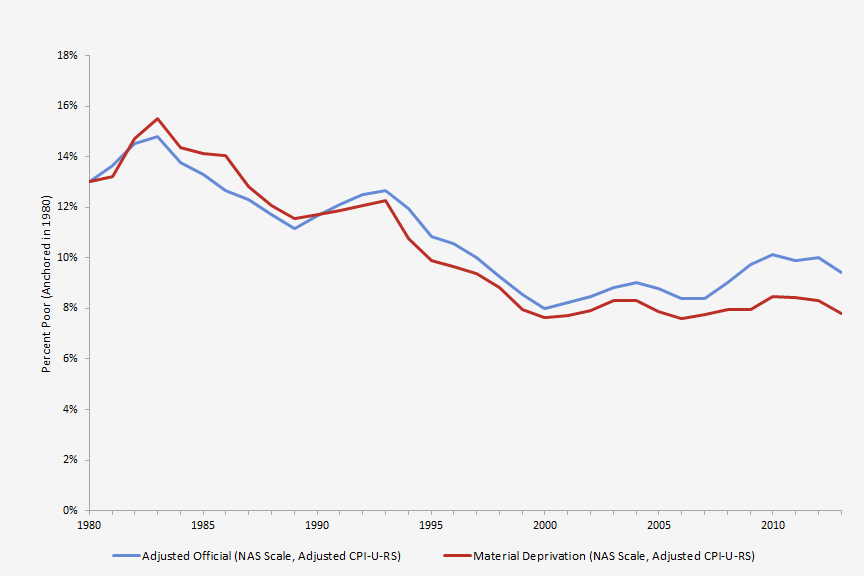
After taking into account the impact of taxes and all government benefits on material well-being, the rate of deprivation falls even further. In 2013, while the adjusted official poverty rate indicates that 9.4 percent of Americans were in poverty, the material deprivation poverty rate was 7.8 percent, an additional 1.6 percentage point drop. That is a 5.2 million person difference between the material deprivation poverty rate and the adjusted official poverty rate. Overall, the material deprivation poverty measure indicates that 21.2 million fewer people in 2013 lacked adequate resources than the official Census Bureau poverty rate suggests.
Consumption Poverty
After taking into account all income resources available to households and all taxes paid to the government, an income-based poverty measure may still overstate material deprivation. Due to certain limitations, statistical surveys underestimate the resources available to low-income households. Specifically, surveys of low-income households tend to underreport household income earned in the private sector and benefits received from the government.[16] Basing poverty thresholds on household income, consequently, may not only lead the official census poverty thresholds to overestimate the number of people in poverty, but it may also potentially lead to other household income based poverty thresholds to overstate deprivation. This includes the material deprivation poverty rate, which incorporates all sources of income available to families.
Perhaps the best measure of household well-being is not income, but rather consumption. While income measures all resources available to households to purchase basic life necessities, consumption measures the value of the items that households actually use. Moreover, evidence indicates basing poverty thresholds on consumption does a better job of identifying material hardship than does basing poverty thresholds on income.[17]
Like the adjusted official poverty rate, the consumption poverty rate uses the NAS equivalence scale and increases each year with the adjusted CPI-U-RS. Also like the other poverty measures, consumption poverty is anchored to the official poverty rate in 1980. So, the consumption poverty threshold is set in 1980 by designating the bottom 13 percent of consumers as being in poverty and increasing that threshold each year with the adjusted CPI-U-RS.
Chart 4 adds to Chart 3 a consumption measure of poverty.[18]
Chart 4: Adjusted Official, Material Deprivation, and Consumption Poverty Rates, 1980-2013
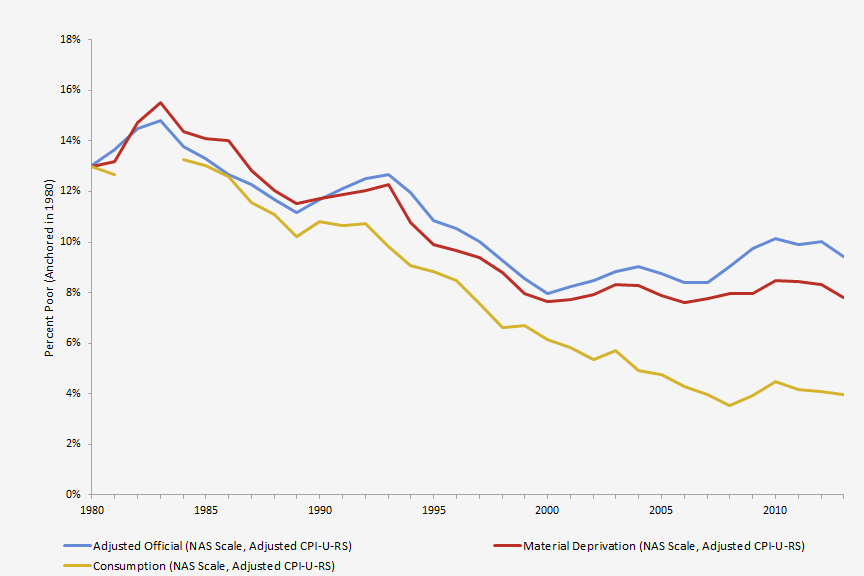
Clearly, poverty as measured by consumption is far less pressing than poverty as measured by income. Specifically, relative to material deprivation poverty, consumption poverty lowers deprivation from 7.8 percent to 4.0 percent of Americans in 2013. This 3.8 percentage point drop represents a difference of 12.1 million workers. Overall, as of 2013 the consumption poverty measure is 10.5 percentage points lower than the official poverty threshold, indicating that 33.3 million fewer workers lack adequate resources.
Self-Sufficiency
Between the material deprivation and consumption measures of poverty, federal anti-poverty programs appear to be achieving one of their primary goals: reducing material hardship in low-income households. But, what about the other primary goal, to increase self-sufficiency among low-income workers? How many households have not been able to earn enough income on their own to stay out of poverty without government assistance?
To address these questions, it is important to examine a measure of poverty based only on household income earned without assistance from the federal government. We develop this measure of poverty by removing all government cash and non-cash benefits from the material deprivation poverty threshold and only include household private sector earnings. Again, see the appendix for a more detailed look at the types of income included and excluded from each poverty measure.
Chart 5 adds to Chart 4 this self-sufficient measure of poverty.
Chart 5: Adjusted Official, Material Deprivation, Consumption, and Self-Sufficient Poverty Rates, 1980-2013
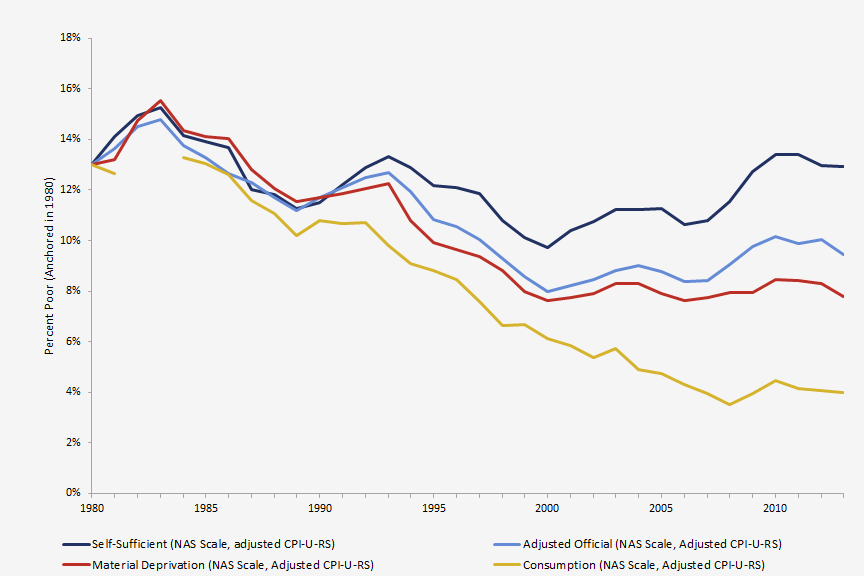
After removing all government benefits from household income, poverty increases back to levels similar to those reported by the official poverty measurement. Like the official rate, the self-sufficient poverty rate has essentially been flat since 1980. In fact, in 2013, 13 percent of people were identified as in poverty under the self-sufficient poverty measure, unchanged from 1980. The 13 percent rate is also 3.6 percentage points higher than the adjusted official rate, which includes government cash benefits. This suggests that government cash benefits kept 11 million people out of poverty. In addition, in 2013 the self-sufficient poverty rate was 5.2 percentage points higher than the material deprivation poverty rate, indicating that the combination of all cash and non-cash benefits kept 16.2 million people out of poverty.
Material Well-Being vs. Self-Sufficiency
Measuring poverty in terms of material deprivation tells a very different story than poverty measured in terms of self-sufficiency. Chart 6 compares the two poverty thresholds.
Chart 6: Material Deprivation and Self-Sufficient Poverty Rates, 1980-2013
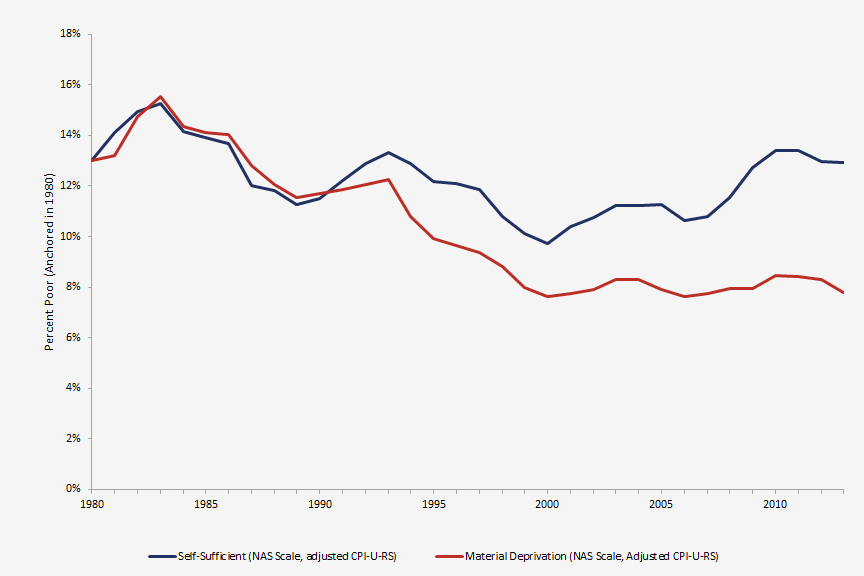
Since 1980, while material deprivation has fallen considerably, self-sufficiency has not changed. Specifically, between 1980 and 2013 material deprivation declined 5.2 percentage points from 13 percent to 7.8 percent. Poverty in terms of self-sufficiency, meanwhile, remained at 13 percent. Despite significantly improved living conditions, households were just as likely to be unable to earn enough income on their own to be out of poverty in 2013 as they were in 1980.
These two diverging trends indicate that the next steps in federal anti-poverty policy should focus on increasing self-sufficiency in low-income households. One way to accomplish this is to implement pro-work safety net programs that require able bodied people to engage in work or work-related activities in order to receive federal benefits. By incentivizing program beneficiaries to work and build skills, work requirements give households in poverty the best path to self-sufficiency.
In the mid-1990s, Congress replaced the primary welfare program, Aid to Families with Dependent Children (AFDC), with Temporary Assistance to Needy Families (TANF). With TANF, Congress introduced work requirements into the welfare system. As illustrated in Chart 6, there was a substantial drop in self-sufficient poverty, coinciding with these new work requirements. Specifically, self-sufficient poverty dropped 3 percentage points from 13 percent in 1994 to 10 percent in 2000. Material deprivation declined along with it, as work is the best way to stay out of poverty. Unfortunately, that success was cut short after a recession in the early 2000s followed by the Great Recession beginning in 2007.
“Better Way” Anti-Poverty Agenda
The self-sufficient poverty trend in Chart 6 highlights the need for pro-work antipoverty policies like the ones outlined in House Speaker Paul Ryan’s “Better Way” blueprint to fight poverty.[19] The “Better Way” blueprint aims to use public assistance programs to connect able-bodied people to work and support skills development through affordable adult education. For instance, while TANF already has work requirements to receive benefits, states have allowed many benefit recipients to not work. Speaker Ryan’s policy would require states to have more able recipients engaging in work or work-related activities. In addition, the Speaker suggests that work development activities be connected to child-support enforcement, food stamps, and housing assistance.[20]
Conclusion
In this paper, we outlined many ways to measure deprivation in the United States. Between all of the poverty measures, a clear pattern emerged: since 1980 material deprivation has fallen substantially to the point where only 4 to 8 percent of people in America actually lack the ability to afford life’s basic necessities. This decline in material deprivation is a vindication that federal anti-poverty initiatives have been very successful in alleviating suffering. Those initiatives, however, have fallen short in raising self-sufficiency among lower-income households. Households were no less likely to be unable to support themselves in 2013 than they were in 1980. This suggests that federal programs have been unable to successfully attach able-bodied people to the workforce and build worker skills to help households support themselves. While the federal government should ensure that no American families suffer from material deprivation, going forward it is essential that lawmakers pursue pro-work solutions, like Speaker Ryan’s “Better Way” initiative, to begin improving self-sufficiency. After all, a career will always be the most effective way out of poverty.
Appendix
The Poverty Measures were developed using the 1981-2014 March CPS supplement.[21] The components used by the different measures are as listed:
Official Poverty Rate: The official poverty rate considers all private sector household income and income from public transfer cash payments. Types of household private sector income are the following: earnings, interest, dividends, rents, pension or retirement income, royalties, alimony, child support, and trusts. Types of public transfer payments are the following: unemployment compensation, workers’ compensation, social security, supplemental security income, public assistance, veteran’s payments, and educational assistance. The 13th percentile of the distribution of this income measure in 1980 becomes the base poverty threshold. To account for inflation, the poverty threshold increases annually by the CPI-U.
Adjusted Official Poverty Rate: Developed by Meyer and Sullivan, the adjusted official poverty rate uses the same money income from the official poverty rate but adjusted for family size and type. We used the equivalence scale recommended by the NAS to make this adjustment. The 13th percentile of the scaled money income in 1980 is the base poverty threshold. However, instead of using the CPI-U inflation adjustment, we use an adjusted CPI-U-RS, which is a version of the CPI-U-RS that increases 0.8 percentage points less annually.
Material Deprivation Poverty Rate: Using the figures from Meyer and Sullivan, this poverty rate is an after-tax measure of income that includes all forms of income in official poverty income measure plus noncash benefits. For this poverty measure, income is adjusted for taxes by subtracting payroll, state, and federal taxes and adding any tax credits, like the earned income tax credit. The imputed value of the noncash benefits added to household income are food stamps, Medicaid and Medicare, employer health benefits, housing subsidies, school lunch programs, and net return on housing equity. The material deprivation poverty measure also uses the NAS equivalence scale and anchors the threshold to the 13th percentile of incomes in 1980. The annual inflation index used for the material deprivation poverty threshold is also the adjusted CPI-U-RS (CPI-U-RS less 0.8 percentage points).
Consumption Poverty Rate: Using the figures from Meyer and Sullivan, the consumption poverty rate looks at consumption expenditures, from the Current Expenditure Interview Survey, instead of household income to create a poverty threshold. The 13th percentile of household consumption expenditures for 1980, after being adjusted by the NAS equivalence scale, establishes the base poverty threshold. The inflation index used to annually adjust the consumption poverty threshold is also the adjusted CPI-U-RS (CPI-U-RS less 0.8 percentage points).
Self-Sufficient Poverty Rate: This poverty measure includes all household earnings incorporated in the official poverty thresholds except public transfer payments (unemployment compensation, workers’ compensation, social security, supplemental security income, public assistance, veteran’s payments, and educational assistance). Before finding the poverty threshold, the self-sufficient income is adjusted per the NAS equivalence scale. The 13th percentile of the NAS adjusted income in 1980 is the base poverty threshold. The self-sufficient poverty threshold also uses the adjusted CPI-U-RS (CPI-U-RS less 0.8 percentage points).
[1] Gordon M. Fisher, “The Development of the Orshansky Poverty Thresholds and Their Subsequent History as the Official U.S. Poverty Measure,” U.S. Census Bureau, U.S. Department of Commerce, May 1992, revised September 1997, https://www.census.gov/hhes/povmeas/publications/orshansky.html
[2] Ibid.
[3] Ibid.
[4] Kenneth Hanson, “Mollie Orshansky’s Strategy to Poverty Measurement as a Relationship between Household Food Expenditures and Economy Food Plan, Review of Agricultureal Economics, Volume 30, Number 3, October 2008, https://academic.oup.com/aepp/article-abstract/30/3/572/8133/Mollie-Orshansky-s-Strategy-to-Poverty-Measurement?redirectedFrom=fulltext
[5] Gordon M. Fisher, “The Development of the Orshansky Poverty Thresholds and Their Subsequent History as the Official U.S. Poverty Measure,” U.S. Census Bureau, U.S. Department of Commerce, May 1992, revised September 1997, https://www.census.gov/hhes/povmeas/publications/orshansky.html
[6] Ibid.
[7] Current Population Survey Annual March Supplement, obtained from the National Bureau of Economic Research, http://www.nber.org/data/current-population-survey-data.html
[8] AAF analysis of Consumer Expenditure Survey, Bureau of Labor Statistics, https://www.bls.gov/cex/tables.htm
[9] Current Population Survey Annual March Supplements, 1981-2014, obtained from the National Bureau of Economic Research, http://www.nber.org/data/current-population-survey-data.html
[10] Bruce D. Meyer & James X. Sullivan, “Winning the War: Poverty from the Great Society to the Great Recession,” NBER Working Paper, January 2013, http://www.nber.org/papers/w18718
[11] Ibid., pg. 11
[12] Constance F. Citro & Robert T. Michael, Measuring Poverty: A New Approach, eds., National Academies Press, 1995, https://www.nap.edu/catalog/4759/measuring-poverty-a-new-approach
[13] Boskin Commission Report, “Toward a More Accurate Measure of the Cost of Living,” Social Security Administration, 1996, https://www.ssa.gov/history/reports/boskinrpt.html
[14] Meyer & Sullivan, 2013, pg. 15
[15] We thank Bruce Meyer and James Sullivan for providing this material deprivation poverty rate data, which is based on post-tax, post-cash non-cash benefits household income.
[16] Meyer & Sullivan, 2013, pg. 12
[17] Bruce D. Meyer & James X. Sullivan, “Identifying the Disadvantaged: Official Poverty, Consumption Poverty, and the New Supplemental Poverty Measure,” Journal of Economic Perspectives, Volume 26, Number 3, Summer 2012, http://www.dicdoha.net/sites/default/files/MeyerSullivanJEP2012.pdf
[18] We thank Bruce Meyer and James Sullivan for providing this consumption poverty rate data.
[19] House Speaker Poverty Task Force, “A Better Way: Poverty, Opportunity, and Upward Mobility,” June 2016, http://abetterway.speaker.gov/_assets/pdf/ABetterWay-Poverty-PolicyPaper.pdf
[20] Ben Gitis, “The Speaker’s Blueprint to Fight Poverty,” American Action Forum, June 2016, https://www.americanactionforum.org/insight/speakers-blueprint-fight-poverty/
[21] Current Population Survey, http://www.census.gov/programs-surveys/cps.html