Insight
July 9, 2019
Understanding Why the EPA’s Clean Power Plan Replacement Is Regulatory and Not Deregulatory
EXECUTIVE SUMMARY
- The Trump Administration’s replacement for the Obama-era Clean Power Plan (CPP), the Affordable Clean Energy (ACE) rule, was projected to be a major deregulatory action, but a shift in the economic analysis between the proposed and final versions of the rule made it net regulatory instead.
- The proposed version of the ACE rule made similar assumptions about emissions and the power sector as the Obama Administration did in its CPP rule, but neither assumption accounted for the stark declines in emissions that occurred independently of any regulation.
- These emissions declines over the last several years essentially rendered the CPP superfluous, so the Trump Administration changed the baseline for its economic analysis to assume that the CPP never existed and that there was no regulation at all – a change that provides a more realistic economic impact analysis of the new ACE rule.
INTRODUCTION
When the Environmental Protection Agency (EPA) released its final Affordable Clean Energy (ACE) rule last month, the most surprising aspect was not the rule itself, but the regulatory impact analysis (RIA) underpinning it. While the RIA in the proposed version of the rule projected nearly $60 billion in savings, the final RIA projects nearly a billion in net costs – an emphatic and unexpected swing.
The reversal was so stark, in fact, that it warrants further exploration. Was this reversal reasonable, or was it a case of regulators manipulating figures to suit their needs?
An analysis shows that the assumptions underlying the EPA’s final RIA are much closer to reality than their assumptions from the proposed RIA, and therefore its estimate of net costs is more appropriate than a projection of billions in savings.
FROM DEREGULATORY TO REGULATORY
The final ACE rule is a combination of two proposed rules: one repealing the Obama Administration’s Clean Power Plan (CPP), and one identifying heat rate efficiency improvements for states to implement on a per power-plant basis (to satisfy the Clean Air Act’s requirement of specifying the Best System of Emissions Reduction). In its proposed rules, the EPA expected the CPP repeal to result in net savings of $51.6 billion, while the second rule was expected to achieve about $6.4 billion in savings, for a total of $58 billion in net savings. According to the Trump Administration’s guidelines for implementing its regulatory budget, these net savings meant the rule was deregulatory.
In the final combined RIA, however, the EPA estimated the ACE rule would have $970 million in net costs – meaning it is now regulatory according to the regulatory budget guidelines. The reason for the massive swing in estimated economic impacts is a change in the baseline.
The proposed RIA used a baseline assuming the CPP would be implemented in its final, 2015 form. In order to calculate the savings in avoided costs, the EPA re-analyzed the CPP to estimate the costs (with some accounting differences, including the social cost of carbon, which is discussed later), and then simply reversed the compliance costs from the 2015 final rule. Since these projected costs were large, most of the projected savings came from this reversal. While the Trump Administration’s estimate of the CPP’s costs was significantly larger than the Obama Administration’s, the two administrations were essentially looking at the same emissions and economic reality – including relatively high emissions from the power sector.
In the final RIA, in contrast, the EPA adjusted its baseline to account for changes in domestic emissions patterns. Since the CPP was first introduced, the fuel supply for power plants had shifted away from coal and toward natural gas and other cleaner sources, and utilities had made public commitments to reduce their greenhouse gas emissions into the future. For the final RIA, the EPA modeled the CPP again, but took into account these changes in emissions, and this new modeling showed that 27 states would no longer be subject to the CPP’s mandates at all, up from seven in the 2015 final rule’s analysis. That modeling, however, stuck with Obama-era assumptions to ensure consistency with the analysis of the CPP. In line with the Obama Administration, it assumed a CPP that goes into effect as scheduled in 2022. It also did not assume interstate trading of emissions allowances, where states that did not meet their target could trade for credits from nearby states that were below their target (even though the CPP allowed such trading, the Obama Administration did not include it in its analysis).
The final ACE RIA did a second model of the CPP that changed these fundamental assumptions about the regulation to account for today’s conditions. These new assumptions are that the earliest the CPP could be implemented is 2025 – a fair assumption given it is already more than three years behind schedule – and that states would participate in a regional emissions allowance trading scheme, as the CPP permitted. When these assumptions are modeled, every state’s emissions would fall below the CPP’s targets by 2033.
Put simply, the CPP, when modeled in line with the present reality, would be essentially superfluous less than a decade after its promulgation. The energy market was shifting to lower-emissions sources without regulatory requirements, and the Trump Administration’s EPA decided that “the weight of evidence” supported the conclusion that the repeal of the CPP would not make a meaningful difference in emissions. Further, the shifting fuel mix meant that the CPP’s regulations would not be as costly as initially assumed, so simply assuming all of those benefits from repealing the CPP as it was originally envisioned did not make analytic sense. Therefore, the EPA decided to drop the CPP entirely from its baseline and compare the costs of its new rule against an environment with no regulation at all. The information needed to determine the appropriateness of this analytical decision lies in the data used to generate these emissions projections, which is explored below.
SHIFTING EMISSIONS ASSUMPTIONS
How did the EPA conclude that the CPP was superfluous? The most influential data for this conclusion come from significant changes in the Annual Energy Outlook (AEO) projections from the Energy Information Agency (EIA) between when the Obama Administration originally promulgated the CPP and today.
The following graphic, from the EPA’s final RIA, depicts the current EPA assumptions regarding carbon dioxide emissions vis-a-vis past projections.
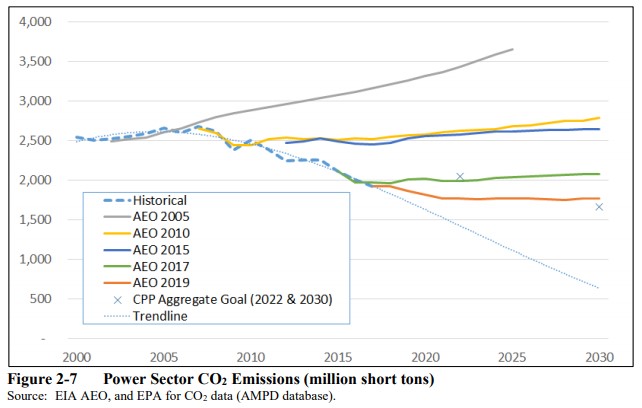
As this graph shows, the expectation under this data up until quite recently was that emissions would continue to grow if not for some limiting action such as the CPP. The EPA claims that the cause for this recent course-correction comes primarily from the continuingly expanding share of natural gas and renewable sources in the past few years. The agency notes, “Only after 2015 did the AEO begin to more concretely factor these trends into the projections, which can be seen in the notable decline in the CO2 emissions projection.” Drilling down even further into the past five years of EIA data further illustrates how much these assumptions have changed.
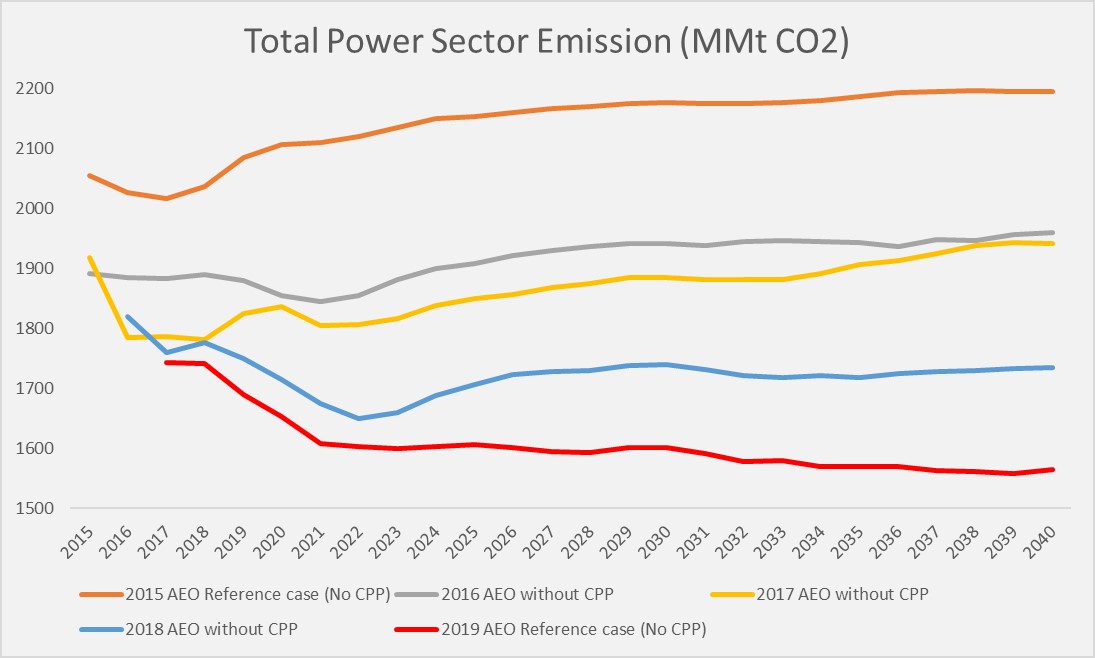
The above chart includes only those AEO cases from 2015 to 2019 that posit a CPP-less situation – in other words, emissions apart from any regulation. From the jump, there is a significant drop between the first two years, with a 163 million metric tons (MMt), or roughly 8 percent, gap between the expected 2015 of the 2015 AEO (orange) and the preliminary 2015 estimate in the 2016 AEO (gray). The subsequent editions show a continued trend toward 1) lower absolute emissions and 2) an increasingly negative rate of emissions growth in the outyears. But what of the cases involving the CPP?
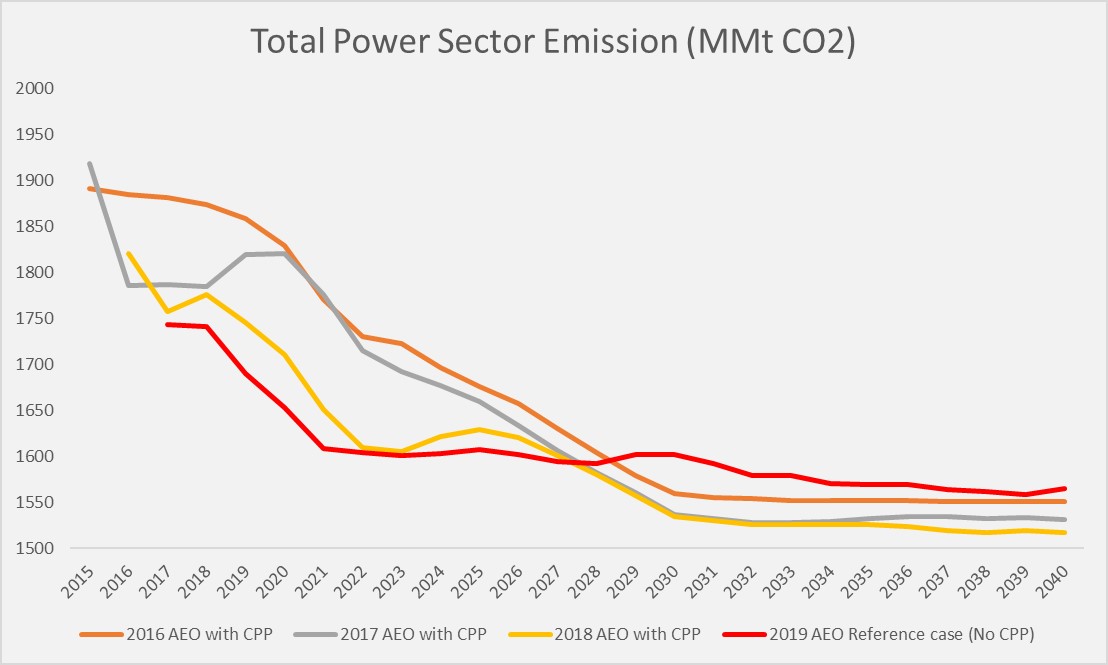
The above chart shows the trends of the available estimates that include the CPP, alongside the CPP-less 2019 case as a comparison point. Compared to the preceding chart, there is a high degree of confluence among these trends. It is also notable that, while slightly higher than all others after 2028, the CPP-less scenario begins at a lower level than CPP cases projected. Even beyond that point there is no more than a 4 percent gap between it and any of the other scenarios. By way of comparison, the gap between 2016 CPP base case and its CPP-less case (the first such pair of scenarios) was upwards of 21 percent. In other words, actual emissions have come in far lower than projections expected without any regulatory intervention.
The crux of the EPA’s newfound cost-benefit rationale in the ACE rule lies in the closing of this gap between the expected emissions without regulation and the expected emissions under the CPP. It contends that a series of concurrent market trends drove emissions reductions and allowed power plants to reach the CPP’s goals without the CPP’s requirements, thus rendering the CPP superfluous. Assuming the implementation of the CPP therefore doesn’t make sense, and the EPA chose to ignore the CPP and use present power-sector projections (for emissions and fuel types) without any regulation as the new baseline. The ACE rule, and its accompanying costs and benefits, then simply builds upon this now-neutral baseline.
NO CHANGE IN SOCIAL COST OF CARBON
Much has been made about the vastly different approaches to calculating the Social Cost of Carbon (SCC) between the Obama Administration and the Trump Administration (a helpful discussion of those approaches can be found here). Therefore, it’s worth looking at whether the Trump Administration made further changes to its SCC calculation between its proposed and final rules that might account for some of the disparity between the estimated economic impacts. A review of the final ACE RIA shows the Trump Administration adhered to the same methodology as in its proposed RIA. Accordingly, the drastic change from net savings to net costs between the proposed and final ACE rules must come from the change in EIA’s emissions projection, and is not in any way affected by the SCC.
CONCLUSION
The EPA’s reversal on the economic impact of the ACE rule was stark. A rule that was supposed to yield more than $50 billion in net savings in its proposed form suddenly emerged as a final rule imposing nearly $1 billion in net costs. A closer look at the underlying emissions data used by the EPA indicates that this shift is based on a more realistic interpretation of the data, as emissions from the electricity sector underwent dramatic changes since the introduction of the CPP, primarily due to large increases in natural gas and renewable energy. As a result, the final RIA shows a more realistic economic impact than EPA would have shown had it adhered to the assumptions underlying its proposed RIA.