Insight
August 6, 2025
What the U.S. Trade Deficit Really Means
Executive Summary
- On April 2, 2025 – dubbed “Liberation Day” by the Trump Administration – the president signed an executive order declaring that the “large and persistent” goods trade deficit constituted a threat to national security due, in part, to its role in “hollowing out” the U.S. manufacturing base.
- Using the International Emergency Economic Powers Act, President Trump levied tariffs on trade partners designed to shrink bilateral trade deficits and, by extension, the overall trade deficit by “rebalanc[ing] global trade flows.”
- In fact, targeting bilateral trade deficits will have little or no impact as it does not address the underlying macroeconomic conditions responsible for trade deficits; moreover, the mathematical relationship between capital inflows and trade balances suggests that attempts to narrow, or eliminate, the U.S. trade deficit could lead to slower global growth, reduced ability to finance the budget deficit, and less foreign investment in the United States.
Introduction
On April 2, 2025 – dubbed “Liberation Day” by the Trump Administration – the president signed an executive order declaring that the “large and persistent” goods trade deficit constituted a threat to national security due, in part, to its role in “hollowing out” the U.S. manufacturing base.
Using the International Emergency Economic Powers Act, the president levied tariffs on trading partners with the intent of shrinking bilateral trade deficits and, by extension, the overall trade deficit by “rebalanc[ing] global trade flows.”
In fact, targeting bilateral trade deficits will have little or no impact as it does not address the underlying macroeconomic conditions responsible for trade deficits; moreover, the mathematical relationship between capital inflows and trade balances suggests that attempts to narrow, or eliminate, the U.S. trade deficit could lead to slower global growth, reduced ability to finance the budget deficit, and less foreign investment in the United States.
Current Tariff Policy
A tariff is a tax placed on the value or quantity of imports entering a country for business or consumer purposes. Countries primarily use tariffs to protect domestic industries from foreign competition by artificially increasing the cost of foreign products for end consumers, who inevitably pay the import tax or opt to purchase more domestic products instead. President Trump has attempted to use tariffs as a tool to reduce the U.S. goods trade deficit, largely by making imports more costly compared to domestic alternatives. The greatest example of this was on April 2, dubbed “Liberation Day,” due to the administration’s desire to utilize universal tariffs to reduce the U.S. trade deficit.
Looking at trade data between January and May of this year, tariffs have not had a significant impact on the overall trade deficit. The trade deficit during this period is just over $600 billion, a 35-percent increase from the same period last year. At the same time, the trade deficit with certain countries has declined, the most notable example being a 1-percent decrease with China compared to last year. This indicates that while it is possible to reduce bilateral trade deficits – by imposing a 100-percent tariff on China, for example – it is difficult to reduce the overall trade deficit in U.S. goods, as trade often re-routes between countries to minimize tariff impacts.
Levying tariffs can make imports more expensive, but it cannot reduce the comparative advantage that led to trade between nations in the first place. If the United States places a tariff on Vietnamese coffee, it will not suddenly become cheaper to produce Hawaiian coffee, which currently accounts for less than 1 percent of all U.S. coffee consumption. Instead, Americans will likely buy more coffee from Colombia, which has a comparative advantage in producing cheaper coffee in larger quantities than the United States.
To counteract the fact that trade is caused by comparative advantage, President Trump has instated universal tariffs, which restrict the importation of certain goods from any country. Yet doing so this will not allow the United States to produce enough coffee to keep up with demand. Instead, coffee will simply become more expensive.
It is also important to note that solely looking at the trade deficit does not paint the full picture of the benefits of trade. Since the administration implemented large-scale tariffs on China, there has been a 22-percent drop in U.S. exports to China and a 9-percent drop in imports. The deficit has declined slightly but so have U.S. sales and the products available to U.S. consumers.
It is notable that April and May saw a slightly lower overall monthly trade deficit compared to 2024 after the large-scale imposition of “Liberation Day” tariffs.
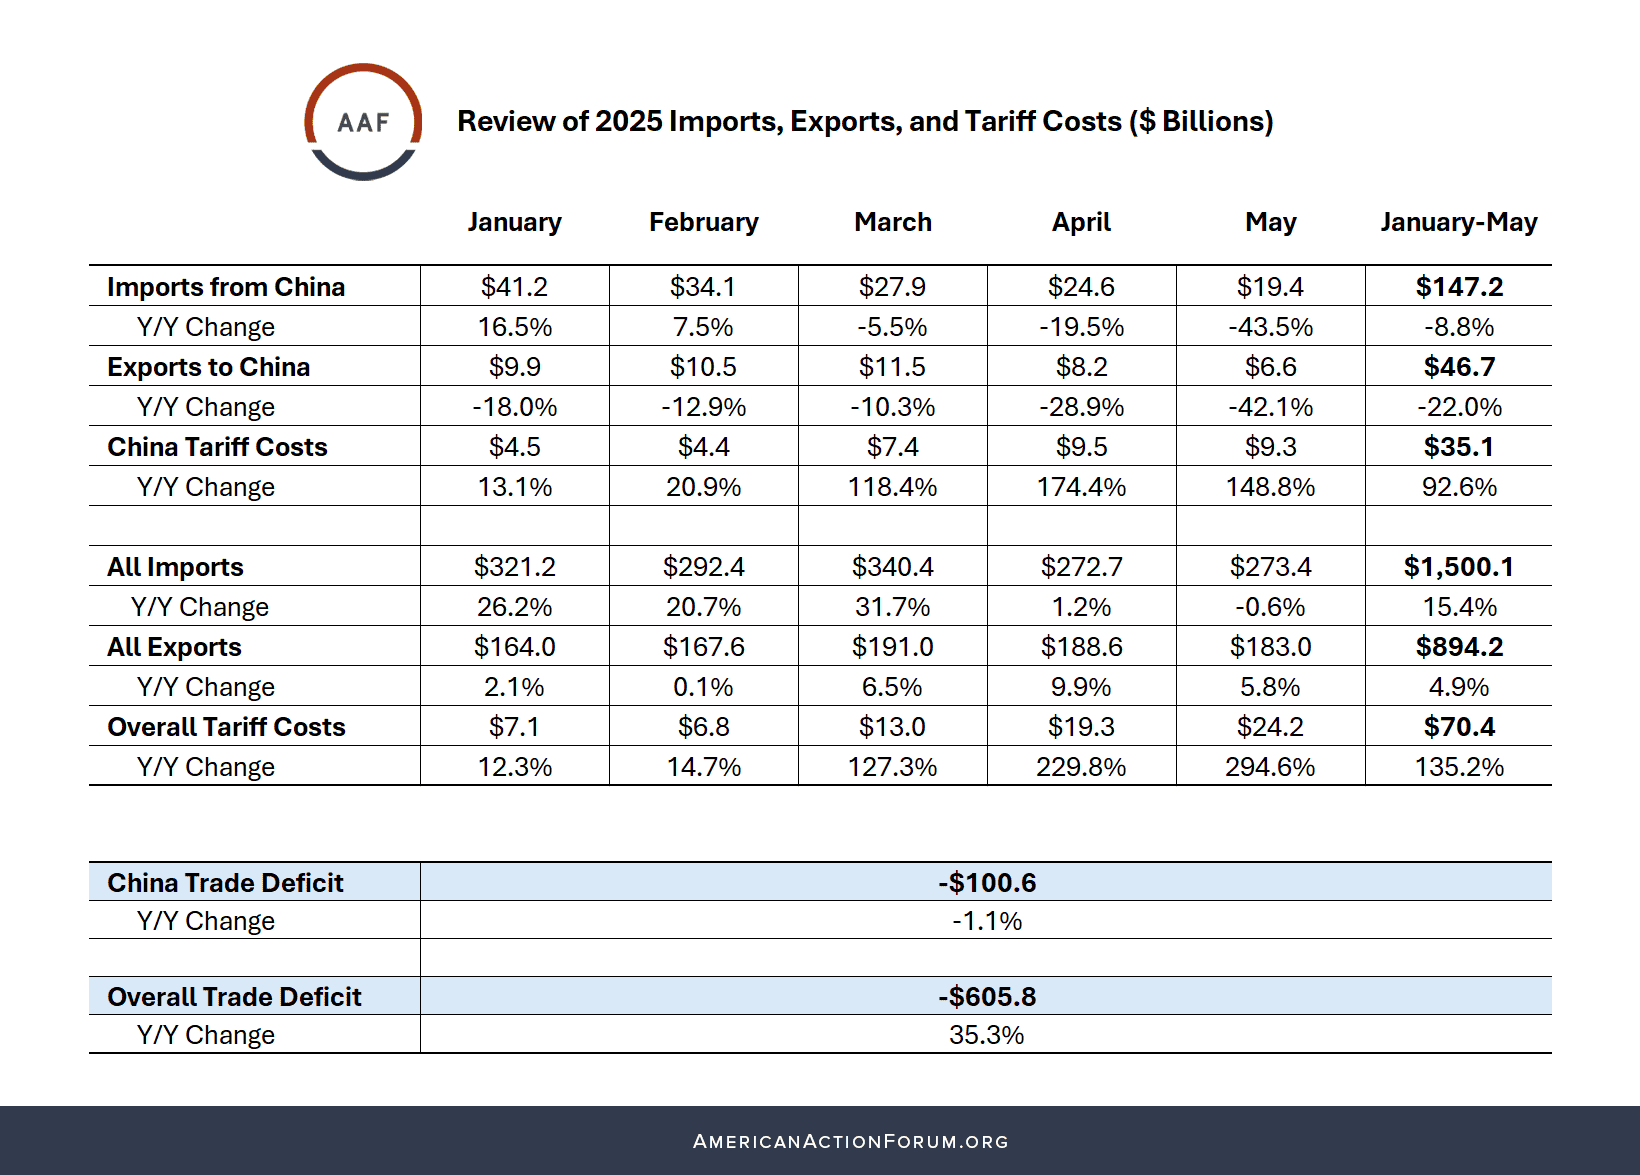
*Source: Dataweb
Why the White House Worries About Trade Deficits
The Trump Administration’s tariffs have been its tool of choice to reduce bilateral trade deficits. In a March 2017 opinion piece for The Wall Street Journal entitled “Why the White House Worries About Trade Deficits,” President Trump’s top trade adviser Peter Navarro claimed:
Growth in real [gross domestic product] GDP depends on only four factors: consumption, government spending, business investment and net exports (the difference between exports and imports). Reducing a trade deficit through tough, smart negotiations is a way to increase net exports—and boost the rate of economic growth.
Navarro is referring to the national accounting identity, which holds: GDP = C +I + G + (X–M), where C is consumption, I is Investment, G is government spending, X is exports, and M is imports.
Navarro makes a mistake when he claims that a lower trade deficit would result in an “increase in the growth of America’s GDP.” The GDP accounting identity subtracts imports simply to prevent double counting, as imports are consumed and are included in consumption, C.
He compounds the error with his example of offshoring production of the Ford Focus to Mexico for export back into the United States. He claims that because the Ford Focus is “imported from Mexico rather than assembled in Detroit – the trade deficit rises, further reducing growth.” In his understanding, an imported Ford Focus increases the level of imports (M), and because it was produced abroad, it is subtracted from GDP. Yet this increase in M is offset by an increase in C, resulting in no net effect on the level of GDP or GDP growth. Navarro’s narrow focus on the demand side of the economy assumes that production of the Ford Focus done in Mexico is lost U.S. output. Yet the labor and capital that was not used in making the Ford Focus in Detroit is not sitting idle but is likely being used in other, more efficient production. This production will be consumed and be captured in C.
Navarro also mistakes GDP growth for the level of GDP. While an increase in net exports (X–M) would increase the level of GDP, it says nothing about the rate of growth. Growth in GDP often requires an increase in the labor force, capital stock, or some technological advancement that boosts productivity.
Adjusting policy to narrow the gap between exports and imports must first assess the underlying macroeconomic conditions that result in “large and persistent” trade deficits. Any attempt to shrink the trade deficit must consider the unintended consequences of doing so. Finally, it would be sensible to evaluate whether trade deficits are good or bad. It could be that U.S. trade deficits are neither; they just are. In other words, trade deficits simply reflect several macroeconomic factors, and using tariffs and bilateral trade negotiations to shrink the trade deficit will likely have little effect.
Balance of Payments
The United States balance of payments data (BOP) summarize economic transactions between residents of the country and the rest of the world. BOP data are collected by the U.S. Bureau of Economic Analysis as part of the U.S. National Income and Product Accounts and are broken into three accounts. The current account measures trade and income flows, the capital account measures the use and acquisition of nonfinancial assets, and the financial account measures the financial assets and liabilities of the United States. In much of the economic literature, the term “capital account” groups the capital account and the financial account together. This insight does the same.
The sum of the current account and capital account always equals zero (although there is often a small statistical discrepancy). In other words, if a country runs a current account deficit, like the United States, it necessarily has a capital account surplus, which the United States does.
This is because the sum of all income in the economy, which is referred to as GDP, can either be spent by individuals and business (C) or paid in taxes (T). What is not spent is private saving (PS). Setting this and Navarro’s identity equal:
C + PS + T = GDP = C + I + G + (X–M)
And after rearranging the variables:
PS + (T-G) – I = X-M
The difference between taxes paid and government spending is equal to government saving (T-G). Collectively, private saving (PS) and government saving (T-G) is equal to national saving, or S.
Simplified, this reveals that net exports, or X-M, are equal to the difference between national saving and investment, or S-I.
U.S. Saving and Foreign Investment
The imbalance between domestic saving and investment results in the large and persistent current account deficit. The Federal Reserve Bank of New York explained that an open economy in this scenario “requires funds from abroad to finance domestic investment spending.” It must “borrow[] from the rest of the world because domestic saving is insufficient to fully finance investment spending.” It explained that if “export revenues don’t cover imports, then a country has to offer up IOUs,” meaning that the United States is a net borrower of foreign capital as these “foreign funds buy[] domestic assets instead of U.S. exports.”
This high level of foreign investment in the United States is directly linked to its low saving rate compared to the G7 countries and other advanced economies.
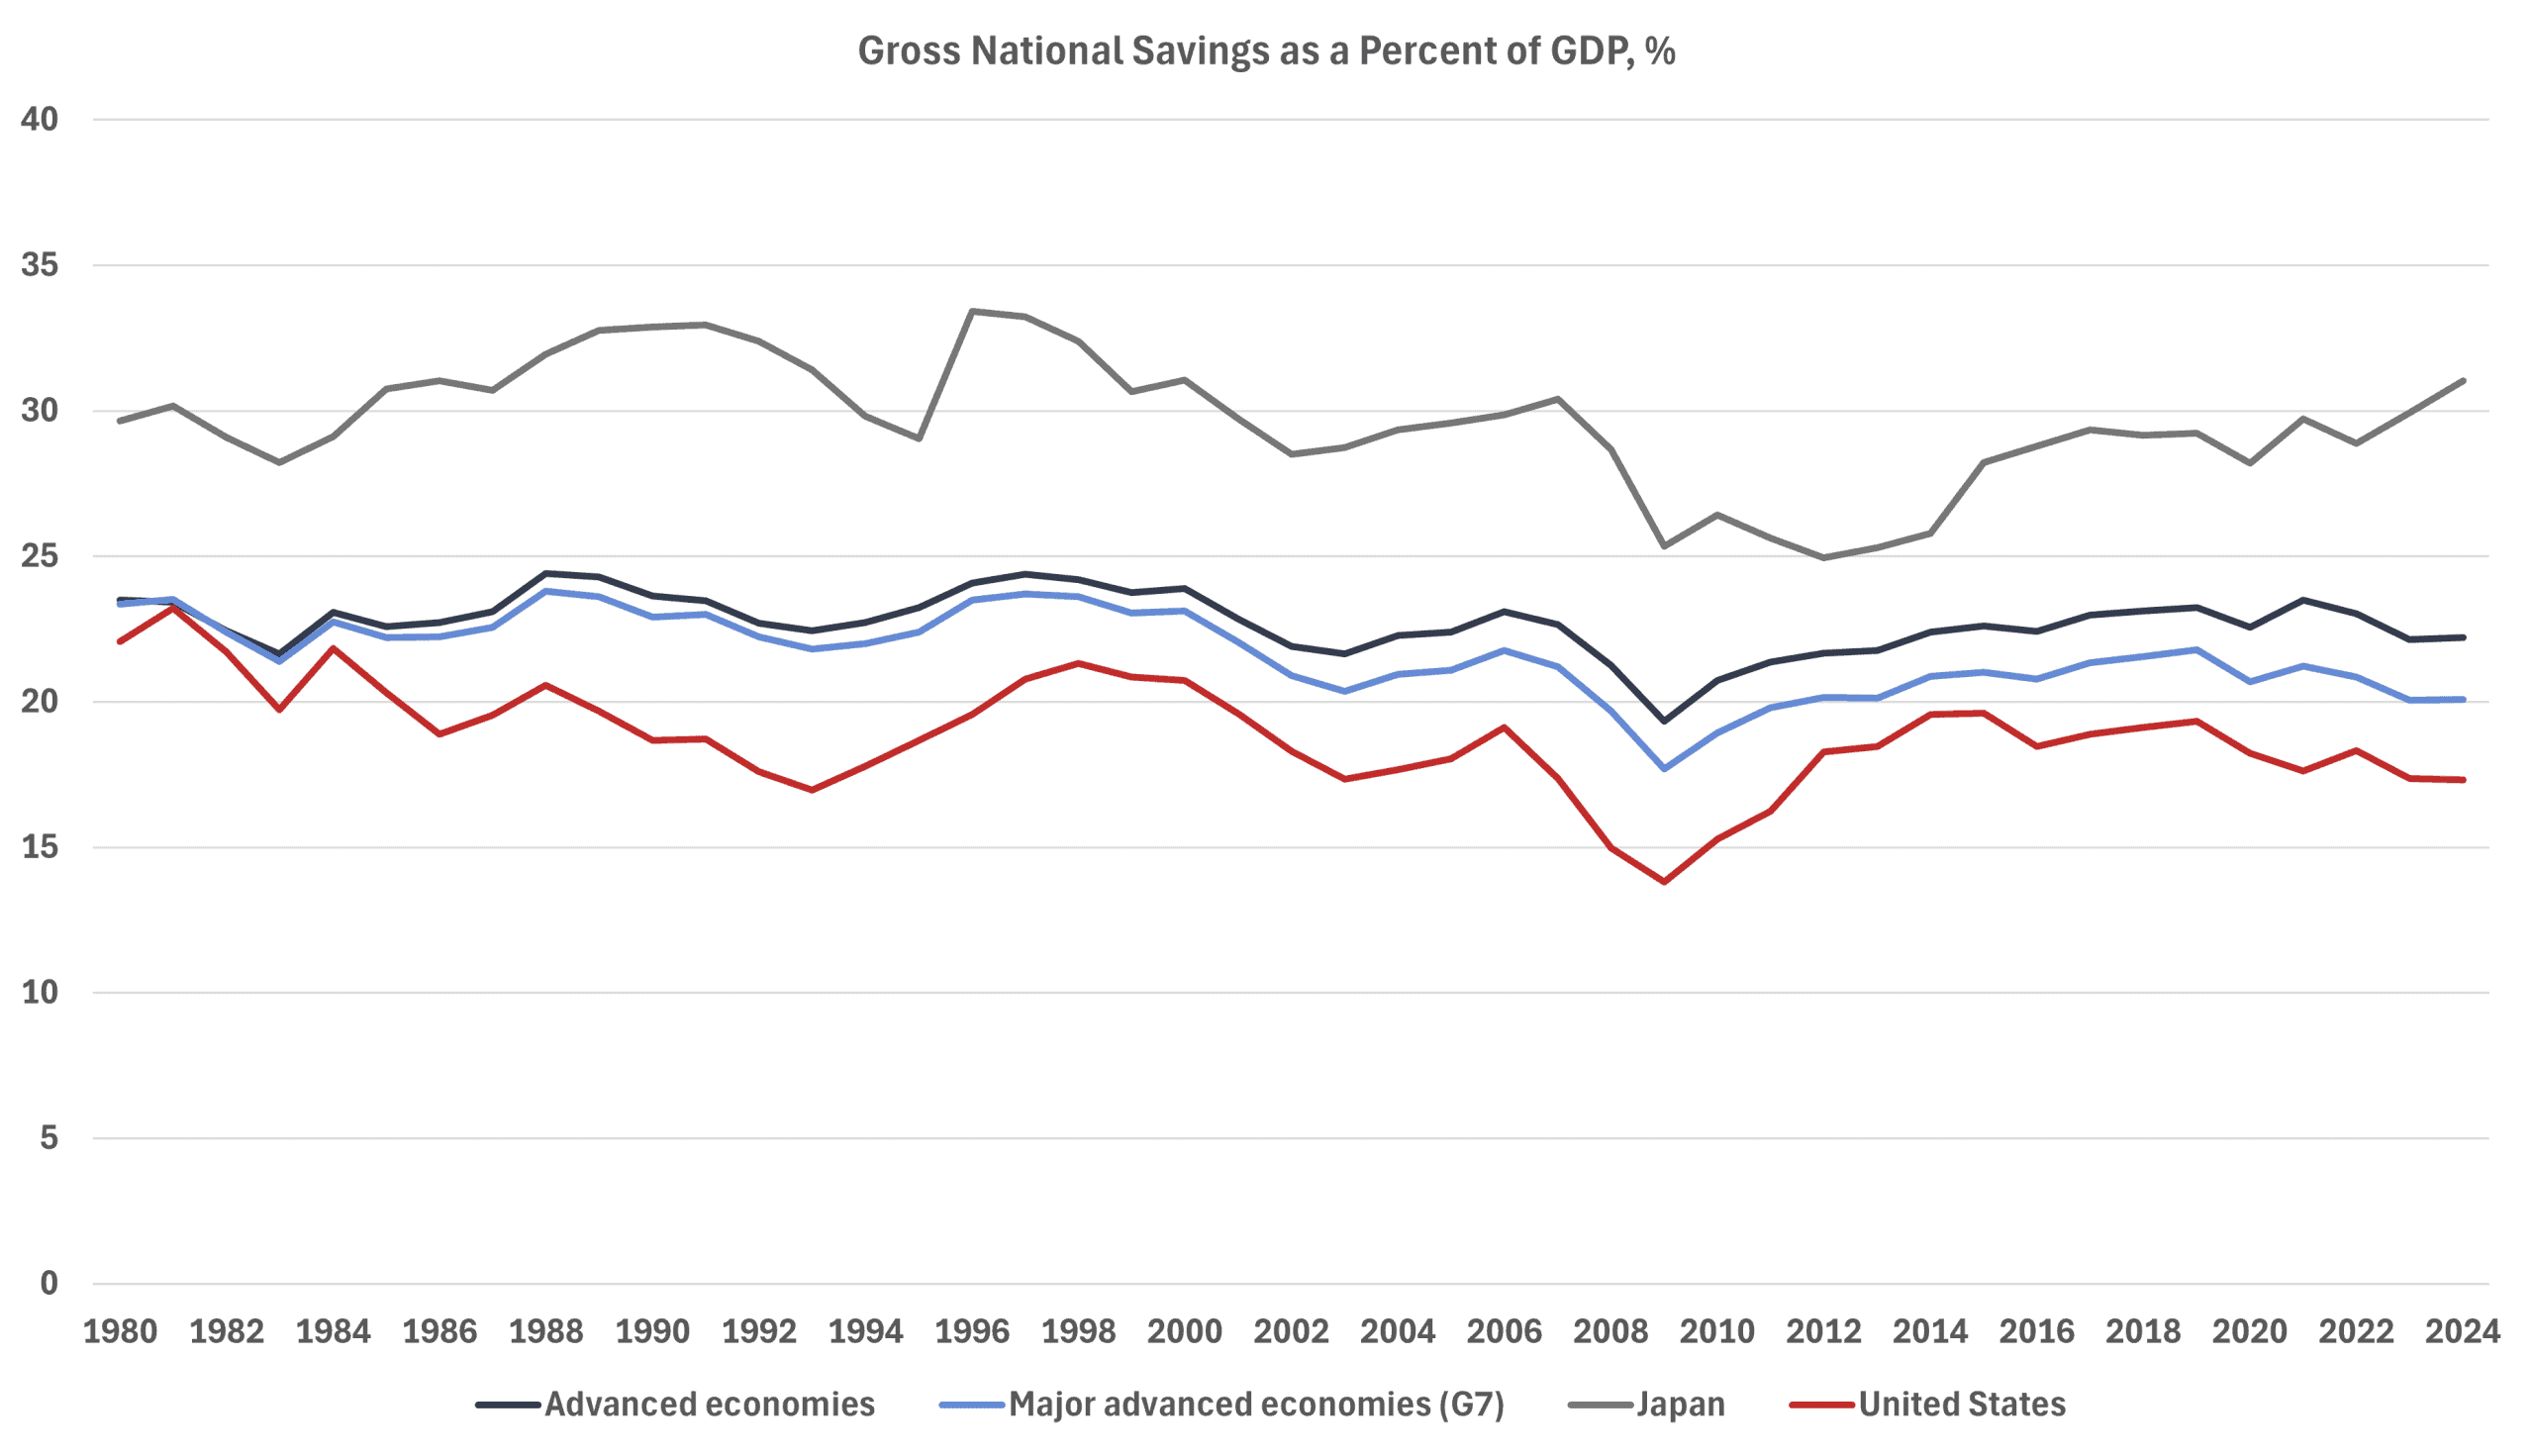
*Source: IMF WEO database
A low saving rate, in part, is caused by high consumer spending. The United States’ robust banking institutions increase the availability and safety of credit, which may be either a cause or effect of Americans’ cultural acceptance of spending and being in debt. Other institutional processes, such as tax codes, also incentivize spending over saving. For example, a certain amount of home equity can be extracted without capital-gains tax when house prices increase. Banks encourage homeowners to spend against this home equity on other large purchases at low interest rates through home equity lines of credit (HELOCs) and refinancing structures. All these structural benefits make buying a house with credit more appealing, and similar reasons to spend can be found throughout the U.S. economy.
Ballooning federal fiscal deficits also help explain a low national saving rate. Mandatory spending for Medicare, Medicaid, and Social Security – which made up 60 percent of federal spending in 2024 – is only expected to increase. The Congressional Budget Office (CBO) found that for every dollar increase in the federal deficit, private saving increases by 43 cents and the national saving rate decreases by 57 cents. In turn, every dollar decrease in national saving increases net foreign investment by 24 cents.
The more the government spends, the less individuals and businesses spend. This effect is mitigated slightly by an inverse relationship between public and private saving, the reasons for which are unclear. Regardless, the overall trend is downward, meaning Americans will continue to require access to foreign savings in order to spend on future investments.
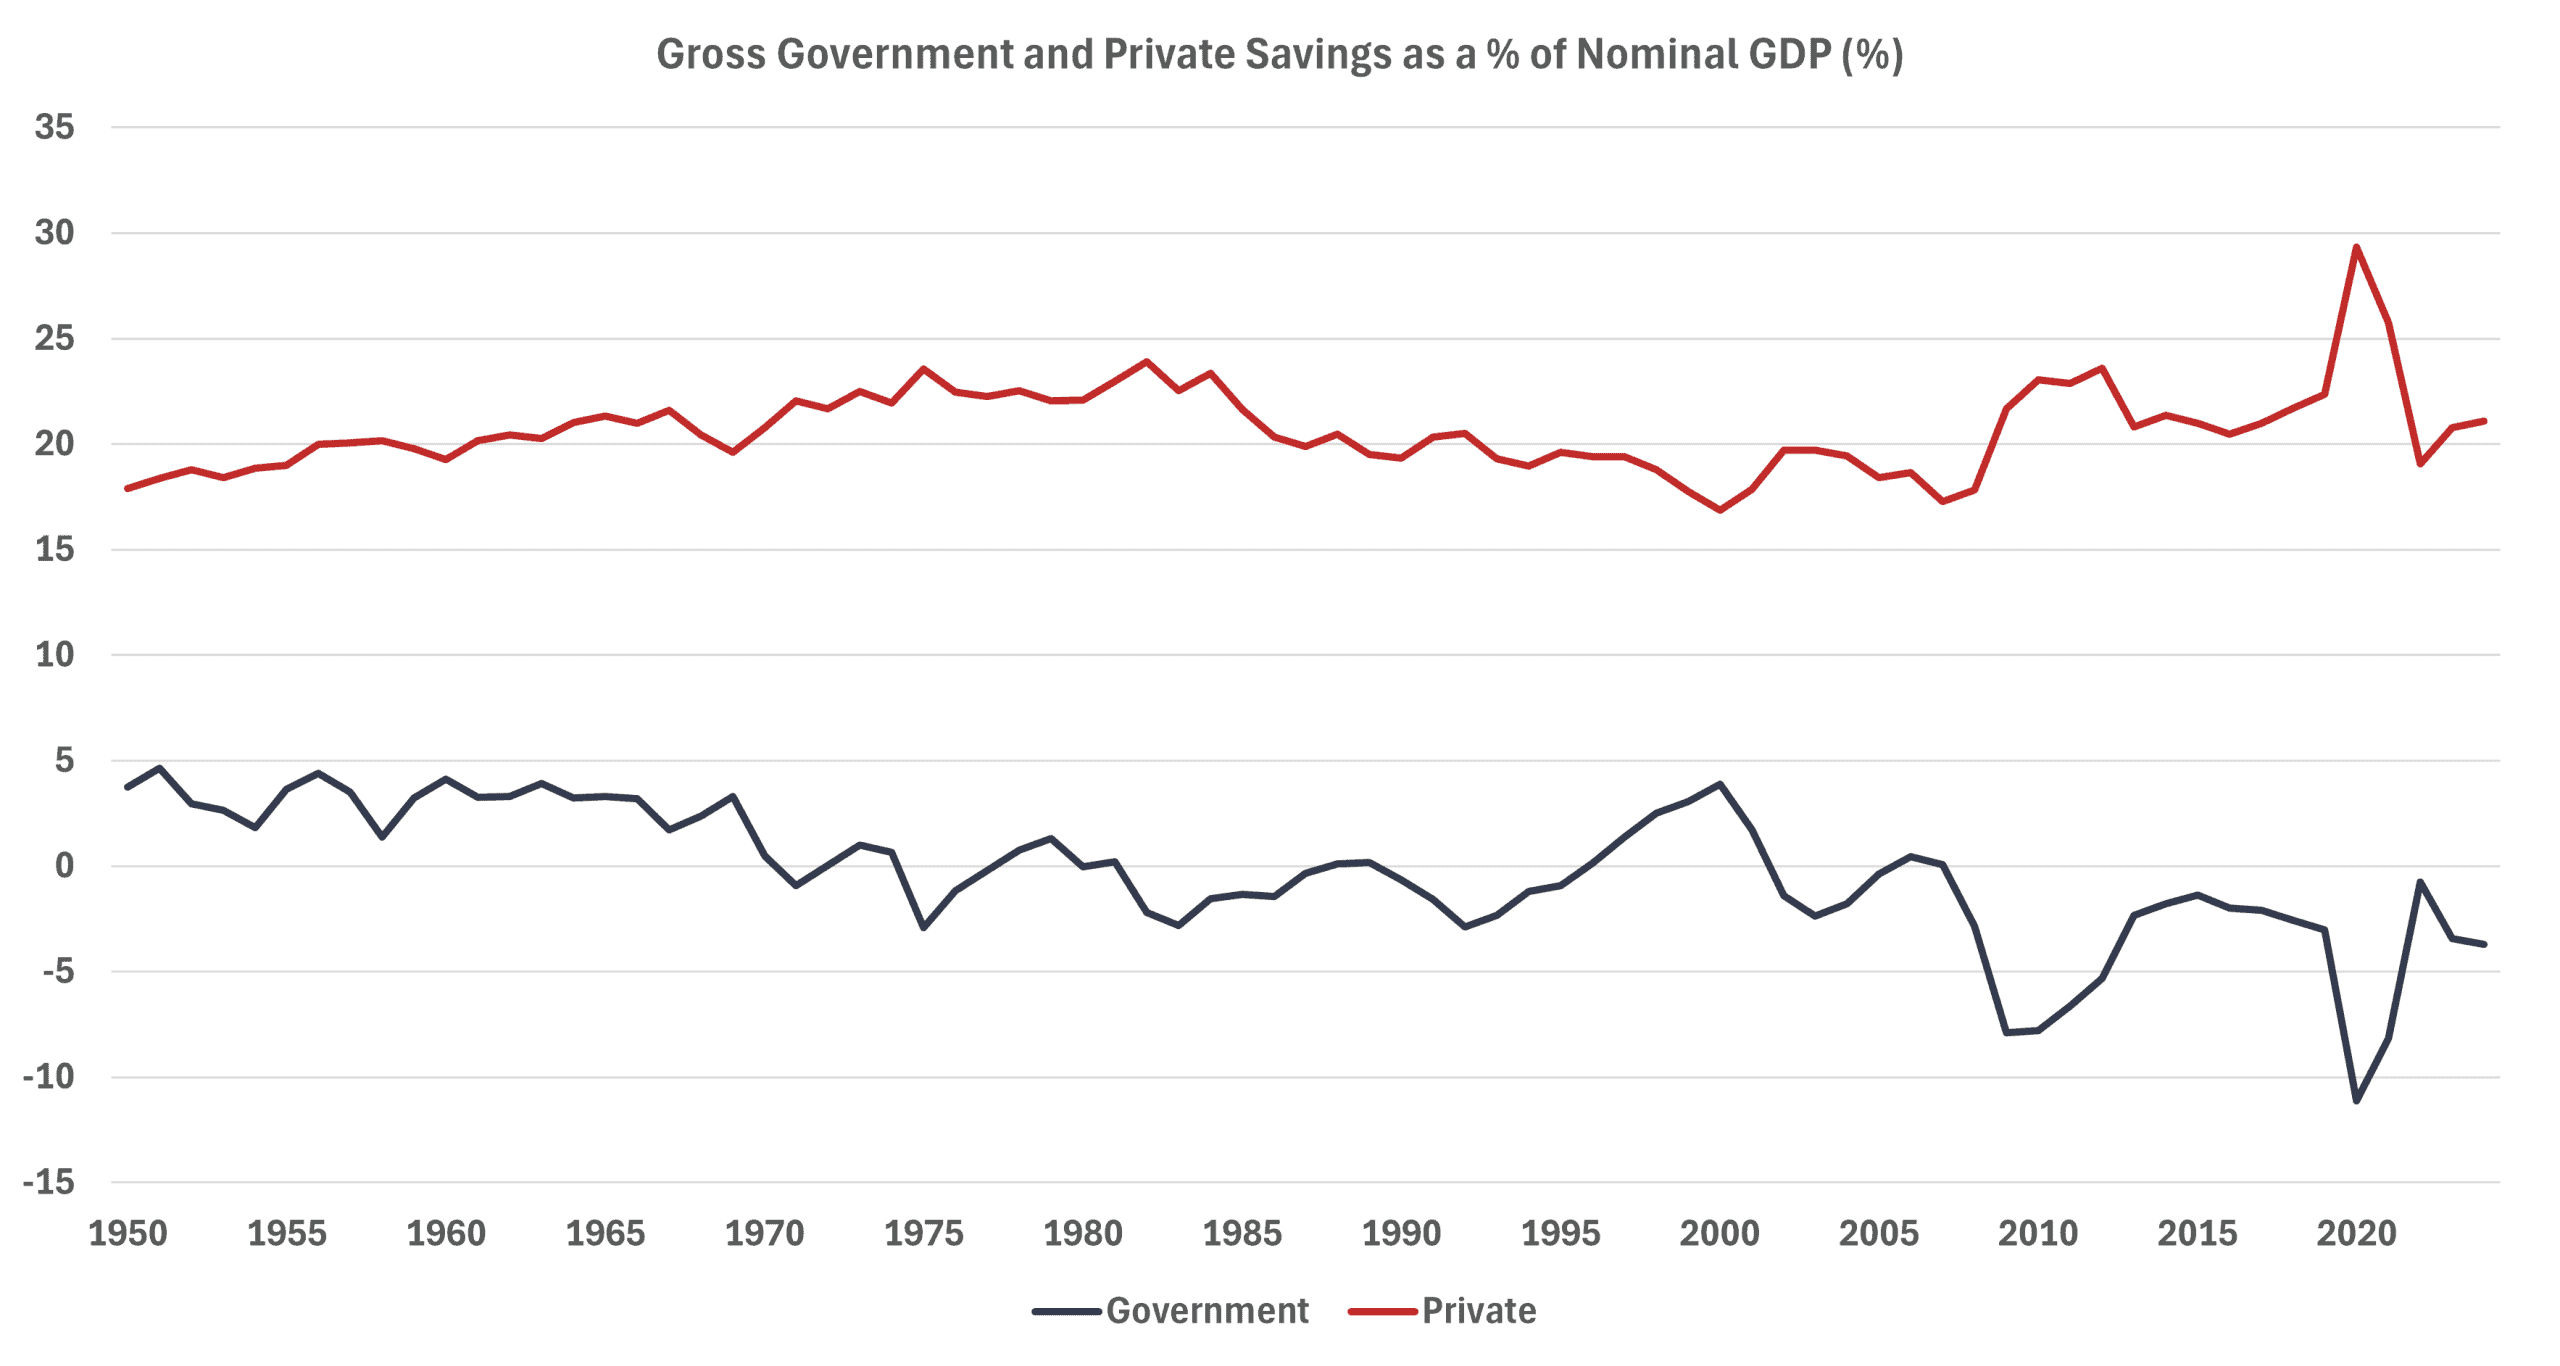
*Source: Bureau of Economic Analysis
The Capital Account Surplus
Navarro addressed the balance of payments equilibrium in his op-ed and correctly pointed out that “foreigners return our trade-deficit dollars to American shores by investing in U.S. bonds and stocks and perhaps by building new production facilities.” He concluded that “the extra capital keeps mortgage rates lower, the stock market abundantly capitalized, and Americans more fully employed.”
With all these benefits, why would Navarro advocate for eliminating the trade deficit? He pointed, in part, to the investment portion of GDP and suggested that offshoring “shows up in government data as reduced nonresidential fixed investment – and a growth rate lower than it would be otherwise.” But that is only half the story.
Since 2018, the United States has been the largest recipient of foreign direct investment (FDI) and has consistently been a popular destination for portfolio investment. According to data from the U.S. Bureau of Economic Analysis, FDI position in the United States stood at $5.7 trillion in 2024. This FDI also generates high-paying jobs. The Bureau of Economic Analysis showed that FDI from multinationals created nearly 8.4 million jobs in 2022, offering an average annual compensation of $89,296.
Furthermore, the U.S. Treasury Department reported that foreign investors owned 21 percent of all U.S. securities, valued at $30.9 trillion at the end of June 2024. Broken down by investment type, foreign investors owned 33 percent of U.S. Treasuries, 27 percent of U.S. corporate debt, and 18 percent of U.S. equities outstanding. In contrast, the Treasury found that U.S. investors held only $15.3 trillion of foreign securities at the end of 2023, mostly in the form of long-term debt issued by private corporations. This clear difference in investment inflows and outflows is what creates the capital account surplus.
Impacts of Shrinking Capital Account Surplus
Less foreign investment into the United States poses two key risks to the federal fiscal deficit. First, with foreign investors holding a third of Treasury bonds, a decline in foreign demand for U.S. debt would increase borrowing costs for the federal government, making it more difficult to roll over federal debt. The bond market reacted to President Trump’s tariff announcements with a strong and immediate pushback. The 30-year Treasury has hovered near 5 percent since May, following Moody’s downgrading of the United States’ triple-A credit rating.
The second risk will materialize if the United States sees a decline in FDI inflows. Foreign companies paid 19 percent of all federal corporate income taxes in 2022, representing a significant source of revenue for the federal government. Concerns about the fiscal deficit are mounting, especially as CBO estimates that the recently passed budget reconciliation bill will increase the deficit by around $4 trillion over the next decade.
Successfully reducing the trade deficit is unlikely to be achieved through a series of bilateral trade agreements. It is more likely that a fundamental shift in the U.S. economy, in which the United States consume less and saves more, will lead to a narrowing of the trade deficit. The impact of such shifts, however, would be felt not just in the current account balance of the United States but throughout the global economy.
Conclusion
President Trump’s efforts to reduce bilateral trade deficits are unlikely to succeed but are likely to harm levels of foreign investment inflows. As the administration continues to roll out bilateral trade agreements, it should carefully consider the macroeconomic forces that tie the United States’ capital account to its current account balance. Less foreign direct and portfolio investment entering the United States would make it more difficult for the federal government to roll over its debt, posing risks to financing the budget deficit.