Research
April 12, 2016
“Accounting for the Rise in College Tuition”: Applying the Model to State Tuition Data
Summary
For over a century policymakers have aided students interested in attending college in an effort to achieve a level playing field. These efforts, however, have required ever-higher levels of assistance, as taxpayers find themselves paying ever-higher tuition. Recent research by Gordon and Hedlund indicates that financial assistance itself may be the problem – more expansive loan programs and more generous grants combine to explain over 70 percent of recent tuition inflation.
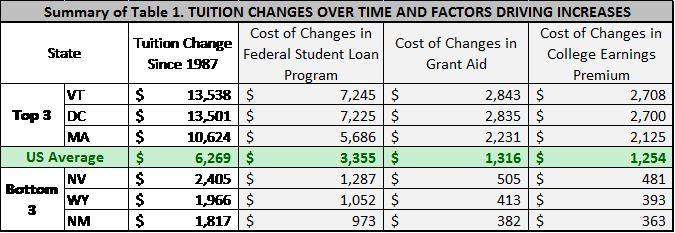
In this paper, I apply their findings to state-by-state changes in average tuition since 1987. Summary Table 1 shows a flavor of the results, with expansions in federal student loan programs pushing tuition up from $973 in New Mexico to above $7,200 in Vermont. Similarly, expansions of grant aid have tuition impacts that range from $382 to $2,843. (Full results are in Table 1, below).
These results suggest several policy implications:
- There is room for improving federal aid programs and limiting the growth of federal dollars,
- However, simply restricting access to the programs is not likely to be successful, and
- Policy makers should look to slow tuition hikes, perhaps through growing dual enrollment programs or enacting policies that increase the availability of advanced placement and international baccalaureate credits.
Background
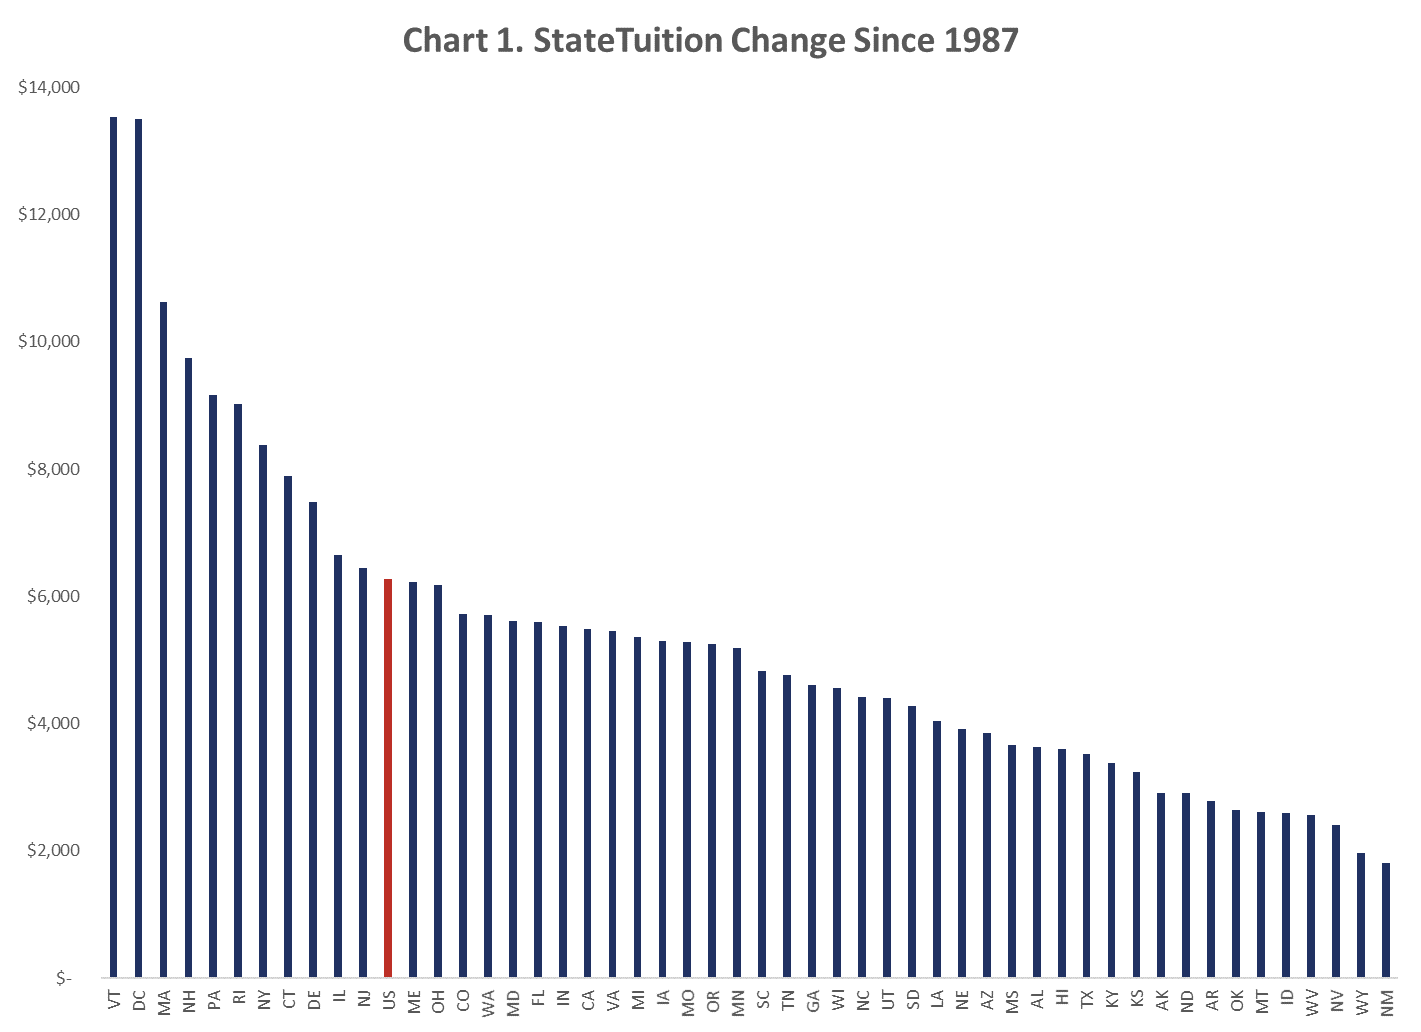
Over the past 30 plus years college tuition has more than doubled, outpacing inflation by 2 to 4 percent, while pushing the volume of student debt to over $1.3 trillion. In response to the rising tuition (and related debt levels), colleges have argued that reduced state funding combined with continued enrollment growth has increased pressure on tuition rates. What’s unclear is if these arguments alone can account for more than three decades of tuition hikes. In particular, budget cuts to higher education are a relatively recent development, as state and federal funding showed steady growth prior to the 2009 recession. What is clear, however, as Chart 1 shows, is that all states have succumbed to pressures to increase state tuition rates. And while the difference between the cost increases in the states vary by 150 percent, on average the U.S. has seen the net price for college soar more than $6,000. Meanwhile, the colleges and universities have been able to enjoy the best of both worlds: continued growth in public assistance and increased tuition – a seemingly never ending revenue stream as long as enrollment continues to grow.
What’s Driving Up Tuition?
In “Accounting for the Rise in College Tuition,” Gordon and Hedlund develop a sophisticated economic model to assess the degree to which federal financial aid policies, labor market trends, and other changes to college funding sources explain the rise in college tuition. Using this analytic approach to identify the drivers of average tuition growth in the United States, the authors found that:
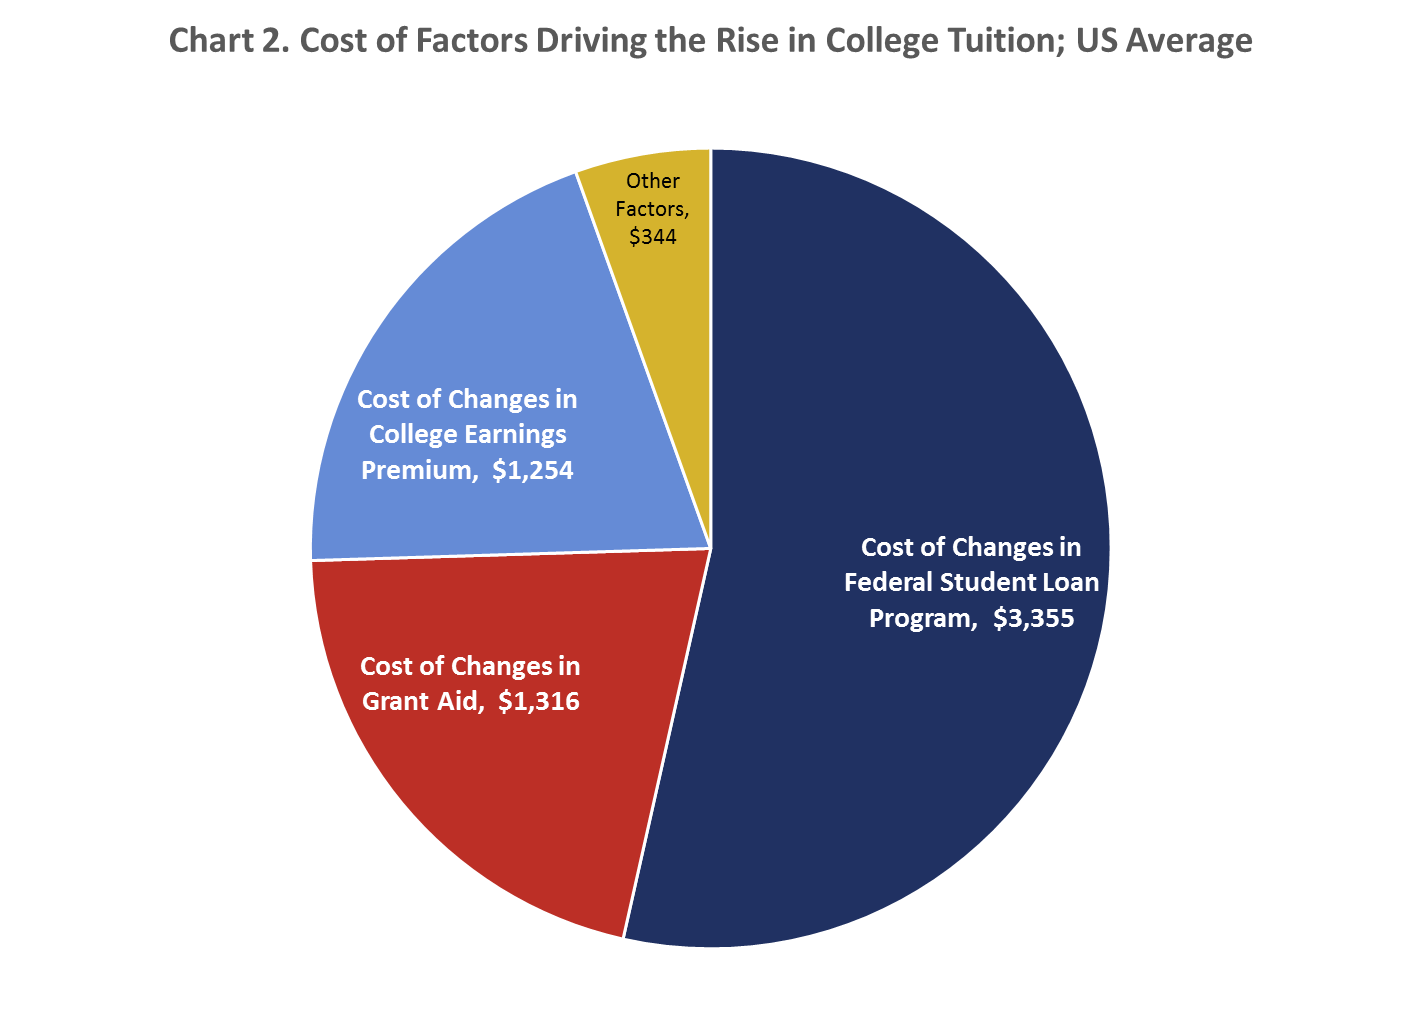
- The combined effect of all policies and non-policy factors they studied generated a $6,300 increase in net tuition;
- Of this, increased student borrowing facilitated by expansions in the federal student loan program explains nearly $3,400, or over 50 percent, of the rise in tuition;
- More generous grant aid contributes just over $1,300 (over 20 percent) to the rise in tuition; and
- Pressure on enrollment from the increased value of a college education is responsible for $1,250, or nearly 20 percent, of the increase in tuition.
As demonstrated in Chart 2 these three changes nearly account for the total change in tuition that has occurred since 1987.
Applying the Model to State Level Tuition Changes
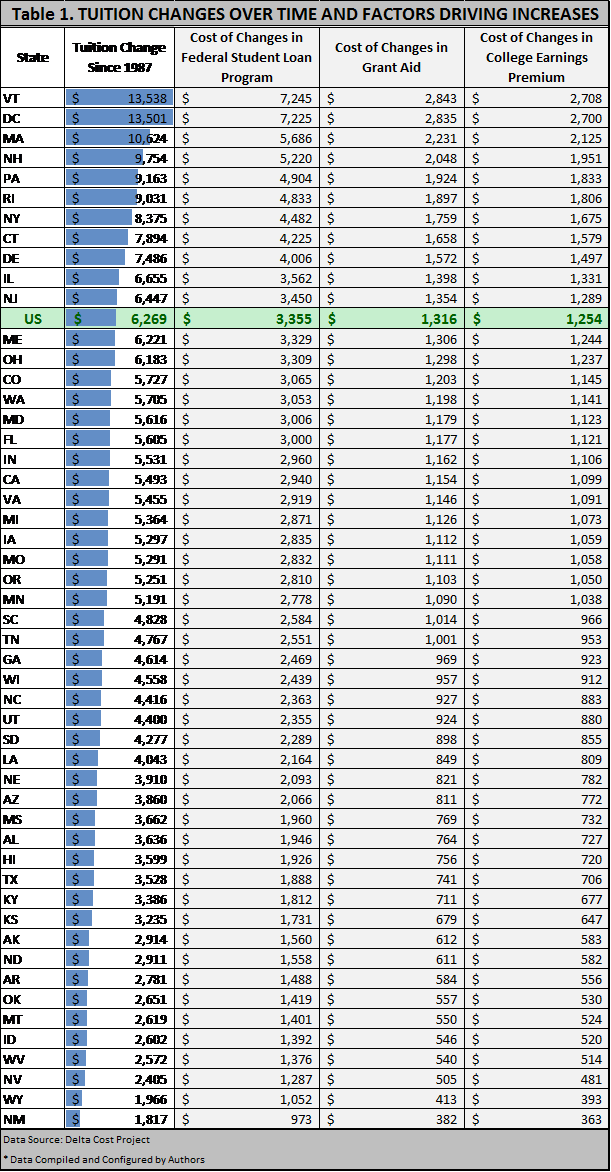
AAF applied these findings to state level data in order to understand the tuition change over time, as well as the factors driving up costs. In doing so, we found that 11 states outpaced the national average for tuition change, with Vermont seeing the greatest change of more than $13,500. New Mexico showed the smallest tuition change of $1,817, a full 110 percent difference from the national average. Table 1 details the change in tuition and cost drivers for all states.
Conclusion
For over a century policymakers have sought to level the playing field by assisting students in attaining a college education. They have achieved this goal primarily through funding assistance in the form of loans or grants; however, 150 years after the federal government began higher education financial assistance, the taxpayers find themselves paying a high price for ever-higher tuition.
Couple the skyrocketing cost of college and the level of debt students incur along the way with evidence of federal financial aid acting as a key factor in driving up the net price, and it’s easy to come to the logical conclusion that restrictions need to be placed on taxpayer funded financial aid. Unfortunately, effective policy solutions are not as simple as limiting aid to scholars.
While there is room for improving federal aid programs, simply reducing funding for the programs will not likely produce the results we are looking for. There are other solutions that policy makers should look toward when considering how to slow tuition hikes. Finding ways to assist states in growing dual enrollment programs or enacting policies that increase the availability of advanced placement and international baccalaureate credits are but two examples, but they are real solutions that shorten the time to completion and have proven to lower the cost of college for students.