Research
July 30, 2018
Calculating the Costs of the U.S.-China Trade War: The Administration’s New Tariffs on $200 Billion
Executive Summary
- Recently, the Trump Administration announced new Section 301 tariffs on approximately $200 billion of imports from China, which follows the previously announced tariffs on $50 billion of imports from China.
- These tariffs could raise overall costs for both consumers and businesses by roughly $19.7 billion per year.
- Seventy percent of the proposed tariffs are on goods that U.S. businesses use in domestic production, and over 98 percent affect the manufacturing industry. This will disproportionally harm U.S. manufacturing, increasing production costs in the United States.
Background
Two weeks ago, the U.S. Trade Representative (USTR) released a list of over 6,000 imports from China, worth approximately $200 billion annually, that the Trump Administration is planning to target with a new 10 percent tariff. This tariff is the latest of several that the president has imposed on trading partners like China, Canada, Mexico, and the European Union.
Earlier this month, President Trump imposed tariffs on $34 billion of imports from China and proposed tariffs on an additional $16 billion, both under Section 301 of the Trade Act of 1974. Section 301 gives the president authority to impose trade restrictions if “an act, policy, or practice of a foreign country is unreasonable or discriminatory and burdens or restricts United States commerce.” In this case, USTR determined that China was engaging in unfair trade practices such as forced technology transfer and unreasonable restrictions on foreign investment.
The latest tariffs on $200 billion of imports are a modification to the original Section 301 tariffs. This comes after China retaliated dollar-for-dollar against the United States for its first round of Section 301 tariffs on $34 billion of imports. In response to the latest tariff threat, China has launched a case against the United States at the World Trade Organization.
Quantifying the Costs
To quantify the potential cost of the latest tariffs on $200 billion, this study analyzes 2017 data from the U.S. International Trade Commission (USITC). USITC has data on approximately $197 billion of the targeted imports, which are displayed in Table 1 along with the projected cost of the tariffs. This analysis assumes that current import levels will not change and 100 percent of the cost of the tariffs will be passed onto U.S. consumers. Under these assumptions, the latest tariffs on China are expected to raise nationwide consumer prices by nearly $20 billion annually.
Table 1: Breakdown of Products Affected by the Modification to Section 301 Tariffs, by HTS Classification
| HTS Category |
Value of Imports (Billions) |
Percent of Total New Tariffs |
Additional Cost with Tariffs (Billions) |
| Food and Agricultural Products |
$6.0 |
3.1% |
$0.6 |
| Minerals, Chemicals, Plastics, and Rubber |
$20.8 |
10.5% |
$2.1 |
| Wood and Wood Products |
$6.7 |
3.4% |
$0.7 |
| Leather and Leather Products |
$7.4 |
3.8% |
$0.7 |
| Textiles and Headgear |
$5.3 |
2.7% |
$0.5 |
| Stones, Metals, Cement, and Glass |
$21.1 |
10.7% |
$2.1 |
| Machinery and Mechanical Appliances, Electrical and Television Equipment |
$87.2 |
44.2% |
$8.7 |
| Aircraft, Vehicles, and Transportation Equipment |
$11.8 |
6.0% |
$1.2 |
| Miscellaneous |
$30.9 |
15.7% |
$3.1 |
| Total |
$197.2 |
100.0% |
$19.7 |
The imports listed in Table 1 above are categorized using the Harmonized Tariff Schedule (HTS). The products most affected by the new tariffs will be mechanical and electrical equipment, which includes goods such as electrical motors, machines used in manufacturing, semiconductor parts, and parts used to assemble televisions. The tariffs also target raw materials such as wood, metals, plastics, and chemicals, as well as miscellaneous items such as medical equipment, photographic equipment, watch parts, and furniture.
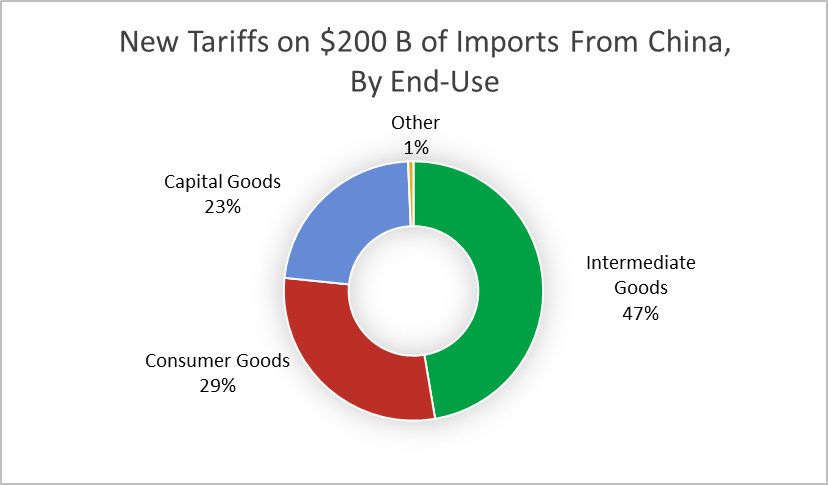
These imports can further be broken down into broad economic categories.[i] Of the $200 billion of imports that may be exposed to new to tariffs, 29 percent are consumer goods. Seventy percent are either capital goods or intermediate goods, both of which are used by U.S. businesses in production. Tariffs on these goods will significantly harm U.S. manufacturers, raising the cost of production in the United States.
The tariffs’ heavy focus on production goods over consumer goods should be expected given the current distribution of U.S. imports from China. AAF previously found that 27 percent of all imports from China are consumer goods, compared to 64 percent that are either intermediate or capital goods. Placing 70 percent of the new tariffs on production goods suggests that the administration is disproportionally targeting production overall. The first round of Section 301 tariffs had a similar focus, as 95 percent of the $50 billion of imports targeted were either intermediate or capital goods.
A final way to analyze these new tariffs is to break them down according to the North American Industry Classification System (NAICS), which categorizes commodities by industry. The following data come from the U.S. Census Bureau, and all import values are from 2017. Table 2 below classifies the $200 billion of products facing tariffs by industry, and Table 3 provides the same breakdown for all $505 billion of U.S. imports from China.[ii]
Table 2: Breakdown of Products Affected by the Modification to Section 301 Tariffs, by NAICS Classification
| Industry |
Value of Imports (Billions) |
Percent of Total New Tariffs |
| Agriculture, Forestry, Fishing and Hunting |
$2.5 |
1.3% |
| Mining, Quarrying, and Oil and Gas Extraction |
$0.2 |
0.1% |
| Manufacturing |
$194.1 |
98.4% |
| Other |
$0.4 |
0.2% |
| Total |
$197.2 |
100.0% |
Table 3: Breakdown of Total U.S. Imports from China, by NAICS Classification
| Industry |
Value of Imports (Billions) |
Percent of Total Imports from China |
| Agriculture, Forestry, Fishing and Hunting |
$3.0 |
0.6% |
| Mining, Quarrying, and Oil and Gas Extraction |
$0.2 |
0.05% |
| Manufacturing |
$495.7 |
98.1% |
| Other |
$6.5 |
1.3% |
| Total |
$505.5 |
100.0% |
Over 98 percent of the proposed tariffs are on materials or products that the manufacturing industry uses. This aligns with the president’s stated goal of shielding U.S. manufacturing form foreign competition. It is also consistent with the overall distribution of U.S. imports from China, as 98 percent of total U.S. imports from China are manufacturing goods. Yet this bias means that the tariffs will specifically increase costs for the U.S. manufacturing industry.
Alternatively, 0.1 percent of the proposed tariffs are on goods like coal, natural gas, and propane. Despite being a small subset of the overall goods affected, this inclusion is significant: The new tariffs target over $200 million of goods in the Mining, Quarrying, and Oil and Gas Extraction industry—nearly all of U.S. imports from China under this category.
Conclusion
President Trump’s proposed tariffs on China will have wide-reaching effects on the U.S. economy. Historical evidence shows that trade barriers like tariffs reduce economic activity, lower aggregate demand and productivity, disrupt supply chains, and increase costs for both producers and consumers. Tariffs also have a net negative impact on U.S. employment. While they create a small number of jobs in industries that produce those specific goods, they destroy significantly more jobs in industries that use imports in the production of other goods. This analysis finds that, not only will the tariffs increase nationwide prices by almost $20 billion annually, they will disproportionally harm U.S. manufacturers.
[i] Commodities were sorted into consumer goods, intermediate goods, and capital goods using a crosswalk that matches 2017 HTS codes to classifications by Broad Economic Categories, Revision 4. For a similar analysis, see the Peterson Institute for International Economics, https://piie.com/blogs/trade-investment-policy-watch/trump-china-and-tariffs-soybeans-semiconductors
[ii] HTS codes on the modified Section 301 tariff list were transformed into NAICS codes using a crosswalk developed by Justin R. Pierce and Peter K. Schott, which can be found here and is described here.