Research
January 28, 2020
Do Tariffs Impact Prices? The Case of Aluminum
Executive Summary
- The Trump Administration has imposed new tariffs on over $300 billion of U.S. imports, creating upward pressure on prices in the United States.
- The president argues that China and other affected nations pay for the tariffs indirectly, while researchers have found that the tariffs are passed on to U.S. consumers through higher prices.
- To investigate, this study analyzes how aluminum prices changed immediately after key announcements of president’s tariffs between December 2017 through August 2018 using two separate sources, S&P Global Platts and Fastmarkets AMM.
- Both data sources provide evidence that the tariffs translate into price increases almost immediately in the United States.
Introduction
As a central part of its approach to international trade, the Trump Administration has imposed substantial new tariffs on China, the European Union, and others – a significant deviation from traditional U.S. trade policy. To date, President Trump has imposed new taxes on over $300 billion of U.S. imports, creating $70 billion of upward pressure on prices. Given the magnitude of tariffs already levied and the president’s desire to raise new tariffs, it is important to examine how this upward pressure has impacted prices in the United States.
Functionally, tariffs are paid by Americans who purchase imports. Their result is to make foreign goods relatively more expensive, increasing prices for consumers and encouraging them to shift to American-made goods. The president, however, argues that tariffs have no impact on prices. Instead, the president and his administration contend that tariffs are indirectly paid for by foreign countries – through currency devaluation and price reductions by suppliers – shielding American consumers from price increases.
The empirical evidence on the price effects of the tariffs is somewhat mixed. One study from the Coalition for a Prosperous America finds that new tariffs on China would cause price decreases in the United States – by shifting the source countries for U.S. imports away from China to even lower-cost nations – while at the same time increasing demand for U.S. goods. Alternatively, multiple studies from the National Bureau of Economic Research contradict President Trump’s assertions, each finding that the tariffs have been completely passed on to U.S. consumers through price increases.
This study aims to contribute to this empirical question by examining the specific case of aluminum.
Background
President Trump imposed 10 percent tariffs on aluminum in March 2018 following a Section 232 investigation into the national security threat of aluminum imports. The justification for these tariffs was U.S. reliance on aluminum imports: The Department of Commerce found that, in 2016, imports of primary aluminum accounted for 90 percent of domestic consumption in the United States. Furthermore, imports of downstream aluminum were 30 percent higher in 2017 than in 2016.
The tariffs, which originally excluded Canada, Mexico, and the European Union, expanded on June 1, 2018, to cover aluminum imports from all nations except Argentina and Australia, who instead were subject to quotas. After the successful negotiation of a new trade agreement between the United States, Canada, and Mexico, however, Canada and Mexico were permanently excluded from aluminum tariffs on May 20, 2019. Today, $9.8 billion of aluminum imports (42 percent of total aluminum imports) remain subject to tariffs.
Analysis
The United States’ heavy reliance on aluminum imports suggests that tariffs would likely have a pronounced impact on prices. The approach of this study is to examine day-to-day price changes, especially around key moments in the process of levying tariffs, to assess the impact of tariffs on prices.
Aluminum prices in the United States are made up of two components. The global reference price is determined by transactions on the London Metal Exchange (LME) based on factors like metal grade and shape, while the Midwest Premium – the additional cost of supplying aluminum to the United States – is determined by U.S. supply and demand dynamics. The total cost of aluminum paid by U.S. buyers, referred to as the “all-in” price, is the sum of the LME price and the Midwest Premium.
President Trump’s tariffs are only levied on aluminum purchased by the United States, meaning they would have no impact on global LME prices. Alternatively, the tariffs should be expected to raise the Midwest Premium, although it is difficult to predict the magnitude of increase in a dynamic market. A rough expectation is that the tariffs should increase the “all-in” price by 10 percent, but because the LME price is not expected to change, the Midwest Premium should increase by more than 10 percent.
To determine the impact of the tariffs on U.S. aluminum prices, this analysis focuses exclusively on changes to the Midwest Premium. It utilizes two separate data sources: one that reports prices daily and a second that reports prices twice per week. In both cases, the prices are determined by market forces; they differ only in the frequency of reporting.
Daily Data
To begin, the daily data available from S&P Global Platts provide an initial avenue for analysis.
What do these data reveal? The following table details the largest price changes in the months surrounding various milestones of the tariff process. With one exception, they all correspond with significant tariff events. For example, on March 8, 2018, the United States released it official announcement of tariffs levied on aluminum; prices rose by 11.8 percent.
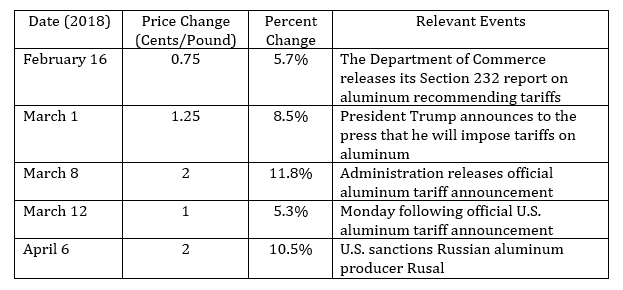
The second-largest increase coincided with U.S. sanctions on Russian aluminum producer Rusal, the second-largest aluminum company in the world. The remaining three outliers can all be tied to U.S. aluminum tariffs: The first occurred on the day President Trump announced to the press that he would be imposing tariffs on steel and aluminum; the second on the day the Department of Commerce released its Section 232 report on aluminum that recommended tariffs; and the third on the Monday following the U.S. tariff announcement. Of note, because of the prolonged period between the Commerce Department’s report and the official enactment of the tariffs, prices in the aluminum market fully absorbed the tariffs before they went into effect on March 23; on that day, prices did not change at all.
The data reviewed thus far suggest a tight link between tariffs and the price of aluminum. Of course, there is always the possibility that large price changes are commonplace and that it is a mistake to assign importance to the tariff announcements when no such link exists.
To investigate this possibility, this analysis examines the frequency of large, daily price changes in the aluminum market. The following chart shows the distribution of daily aluminum price changes in the months surrounding the announcement and enactment of the president’s aluminum tariffs – from December 2017 through August 2018. The horizontal axis shows daily price changes grouped together in bins of one percentage point in length, ranging from a 3 percent decrease to a 12 percent increase. The vertical axis shows the number of times each level of price change occurred during the time period examined, ranging from zero to 12 times.[i]
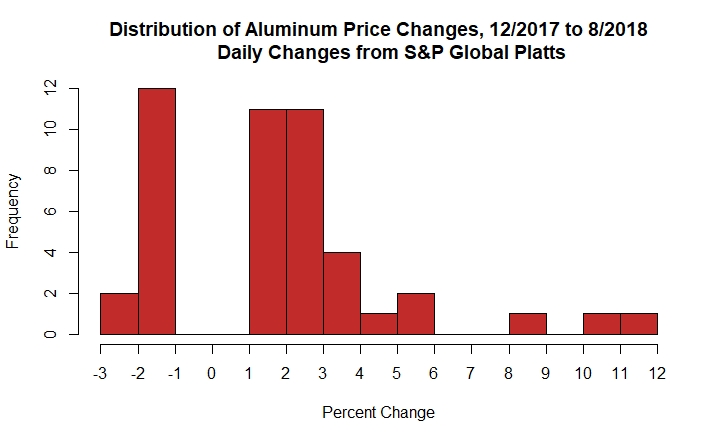
The vast majority of price changes are bounded in a relatively small range between a 2 percent decrease and a 3 percent increase. There are only a few outliers representing a large price change, i.e. a price changes outside of the norm. This distribution is compelling evidence that the price changes discussed above are attributable to tariffs and not market fundamentals.
Twice-Weekly Data
Thus far, the analysis supports a direct relationship between tariffs and domestic price increases. As a robustness check, this study also examined data from Fastmarkets AMM.[i] Unlike the daily Platts data, Fastmarkets report aluminum prices twice a week. Although twice weekly data is not as desirable as daily data, Fastmarkets and S&P Global Platts are two independent price reporting agencies that use different methodologies, so a similar finding would corroborate the earlier analysis. This study repeats the analysis with twice-weekly data and examines price changes surrounding important events in the levying of the tariffs.

The Fastmarkets AMM outliers are similar to those of S&P Global Platts, with most large price increases occurring at the same time as prominent tariff events. Like the previous distribution, the largest change coincides with the official U.S. aluminum tariff announcement, after which prices rose nearly 20 percent. The second-largest change occurred after the United States sanctioned Russian aluminum producer Rusal, just as in the previous distribution. Unlike in the previous distribution, however, these data show a spike in aluminum prices after the president imposed new safeguard tariffs on solar panels and residential washing machines under Section 201 – a statute enabling the administration to
To check whether the price changes following tariff events truly are abnormal, this study again examines the full distribution of price changes in the figure below.
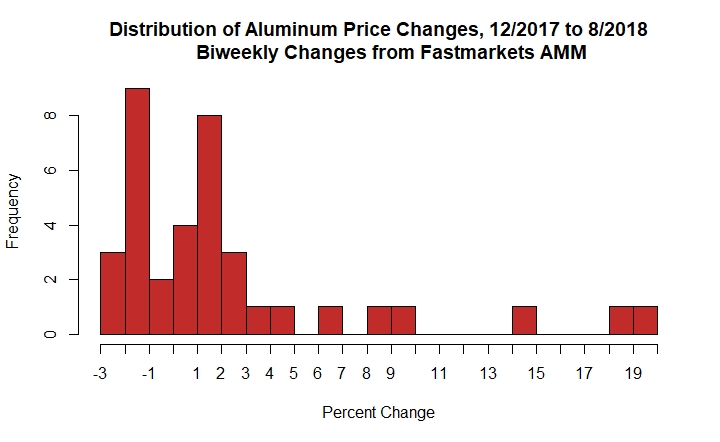
Once again, we find that the bulk of price changes are modest. The three significant outliers are all related to the aluminum tariffs, either occurring on the week of the Section 232 report or the week of the official U.S. announcement.
In sum, the two data series appear to track the same fundamentals of the aluminum market. As a result, they both also indicate clearly that tariffs have an impact on domestic prices.
Conclusion
Since taking office, President Trump has imposed new tariffs on over $300 billion of annual imports and shows no sign of reversing course. He has argued that tariffs do not increase prices, but this study indicates otherwise. In the specific case of aluminum, this analysis shows that the largest price increases can be easily tied to tariff-related events, suggesting that the tariffs translated into domestic price increases almost immediately.
[i] The Fastmarkets AMM data similarly reflect the Midwest Premium and range from December 2017 through August 2018.
[i] By far, the most frequent daily price change was none at all. Therefore, to get a picture of the distribution without distortion, days with zero price change were excluded.