Research
March 4, 2021
Food Insecurity and Food Insufficiency: Assessing Causes and Historical Trends
Executive Summary
- Food insecurity is not only defined by having insufficient amounts of food, but also a diet that is lacking in quality, variety, or desirability.
- Food insecurity is highly correlated with financial challenges but may also be caused by physical or logistical challenges in accessing or cooking nutritious food.
- Over the past 25 years, food insecurity was highest in the years immediately following the 2008 financial crisis but had been steadily declining since 2014—at least until the COVID-19 pandemic.
Introduction
The images of long lines at food banks during the COVID-19 recession drive home two truths. On the one hand, regular access to healthy food is a central aspect of wellbeing, but on the other, economic recessions put this access at risk. The government describes this access in two different ways: food insecurity, and food insufficiency. But what does it mean to be food insecure, and how does that differ from being food insufficient? How are those variables measured, and what risk factors are associated with food insecurity? How have rates of food insecurity changed over time? This paper analyzes those questions and seeks to provide a baseline of understanding from which one can assess the impact of the COVID-19 pandemic.
What is food insecurity? And how is it different from food insufficiency?
According to the Economic Research Service (ERS) of the United States Department of Agriculture (USDA), food insecurity is defined as “the limited or uncertain availability of nutritionally adequate and safe foods, or limited or uncertain ability to acquire acceptable foods in socially acceptable ways.”[1] This may include “reduced quality, variety, or desirability of diet,” but does not necessarily include reduced food intake.[2] Food insecurity considers circumstances over the past year (or sometimes the past month). In contrast, food secure households are said to have “consistent access to enough food for active, healthy lives for all household members at all times during the year.”[3]
Very low food security—a more severe category of food insecurity—is represented by “multiple indications of disrupted eating patterns and reduced intake.”[4]
Food insufficiency is a simpler measure of whether or not there was enough to eat. Of course, there is overlap between the two measures, and individuals who suffer from food insufficiency are likely to also be considered to have very low food security.
How is food insecurity and food insufficiency measured?
To measure food insecurity, the USDA has conducted an annual survey since 1995 in partnership with the Census Bureau (the Current Population Survey Food Security Supplement, CPS-FSS) of 40,000 nationally representative households. This survey assesses households’ abilities to meet their food needs, including how often they may not have had enough food or any food for some period of time in the prior year. The survey on food insecurity asks 10 questions of all households plus an additional 8 questions for households with children. The questions assess the severity and frequency of any lack of access to food or decrease in the quality or variety of foods eaten. Respondents are also asked about behaviors that might be affected by food insecurity, such as reducing portion size, feeling worried or hungry, or losing weight. Respondents are found to be food insecure or have very low food security if enough of their answers are affirmative, with varying thresholds for households with and without children.[5]
Food insufficiency, along with insecurity, over the past year or in a 30-day period is also assessed by the questions asked in the CPS-FSS. To more closely monitor food insufficiency, since the beginning of the COVID-19 pandemic the Census has conducted a bi-weekly Household Pulse Survey, which includes a single, straightforward question regarding whether and how often households did not have enough to eat over the past week, or in later months, the past two weeks. This shorter look-back period is intended to assess more rapid changes. Respondents are asked to choose between the following categories to describe their current household food situation over the past week (or, in later months, past two weeks): “Enough of the types of food wanted,” “Enough food, but not always the types wanted,” “Sometimes not enough to eat,” or “Often not enough to eat.” Individuals selecting sometimes or often not enough to eat are typically considered to not have sufficient food and may closely align with those considered to have very low food security. Those who respond that they have “enough food, but not always the types wanted” would more closely align with the broader definition of food insecurity.
Both surveys also collect some information regarding household demographics and socio-economic conditions, such as race, age, employment status, income, education, housing, and health status. The demographic and socio-economic household data collected by the CPS-FSS are more robust because they are collected along with the more in-depth census survey and ask more detailed questions, particularly with regard to the respondents’ employment status.
There are, since 2006, no longer official metrics on hunger specifically (in contrast to food insecurity or insufficiency), primarily because it is an “individual-level physiological condition” that may or may not be related to food insecurity; further, because it is a subjective feeling, interpreted differently by different people, it is much more difficult to measure in a meaningful way.[6]
Food insecurity is also gauged, unofficially, by various organizations working every day to provide food to fellow Americans. One of the largest such organizations is Feeding America, a nationwide network of food banks. Feeding America has been publishing data on food insecurity by county for the past decade, estimated by surveying households about their access to and consumption of food and using correlated factors, including poverty, unemployment, homeownership, and disability prevalence at the state level. The organization also analyzes responses to the Current Population Survey from food insecure households regarding their food budget shortfall. Last, their analysis estimates the cost of food in each county by category and the cost of an average meal by food-secure families to estimate the likelihood that a typical family in a given county can afford a healthy meal. In short, Feeding America compiles a comprehensive set of data regarding factors known to be highly correlated with food insecurity in order to estimate food insecurity in each county.
What do the historical data show? How has food insecurity trended over time?
Official metrics estimate 10.5 percent of Americans (35.2 million) were food insecure in 2019, including 4.1 percent (9 million) who were considered to have very low food security and 3.7 percent who were estimated to be food insufficient.[7] While the overall number of food-insecure Americans decreased by a statistically significant degree from 11.1 percent in 2018, the share of very low food security households remained virtually unchanged (from 4.3 percent in 2018), suggesting that whatever factors benefitted those with less severe food insecurity did not reach those struggling the most.[8]
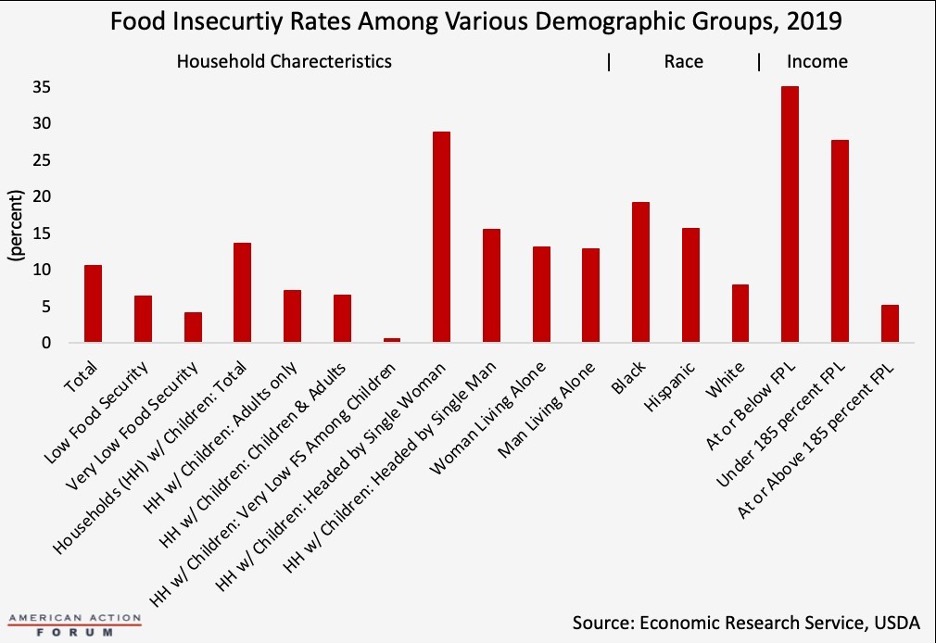
Households with children are more likely to be food insecure than those without, although in more than half of these households, only the adults were food insecure, because adults typically choose to ensure their children eat even if it means they go hungry.[9] Nevertheless, 5.3 million children faced food insecurity themselves, and 361,000 children suffered from very low food security in 2019.[10]
Households with children headed by a single woman are nearly twice as likely as those headed by a single man to be food insecure, though women living alone are at virtually equal risk as men living alone. Black and Hispanic Americans are much more likely to be food insecure than White Americans.
As expected, those with lower income are more likely to be food insecure than those with higher income: More than a third of households at or below the federal poverty level (FPL) are food insecure, compared to 5.1 percent of those earning 185 percent or more of the FPL. Of course, there is nothing magical about reaching 185 percent FPL that suddenly makes food drastically more accessible; rather, this threshold is used for sorting the data because it is the eligibility threshold for the Special Supplemental Nutrition Program for Women, Infants, and Children (WIC).
Based on the methodology described above, Feeding America estimates 11.5 percent of Americans (37.2 million people) were food insecure in 2018 (roughly equal to the official metric that year). The average cost of a healthy meal in the United States was estimated at $3.09.[11]
The county-level detail provided by Feeding America reveals wide disparities of the prevalence of food insecurity within states.
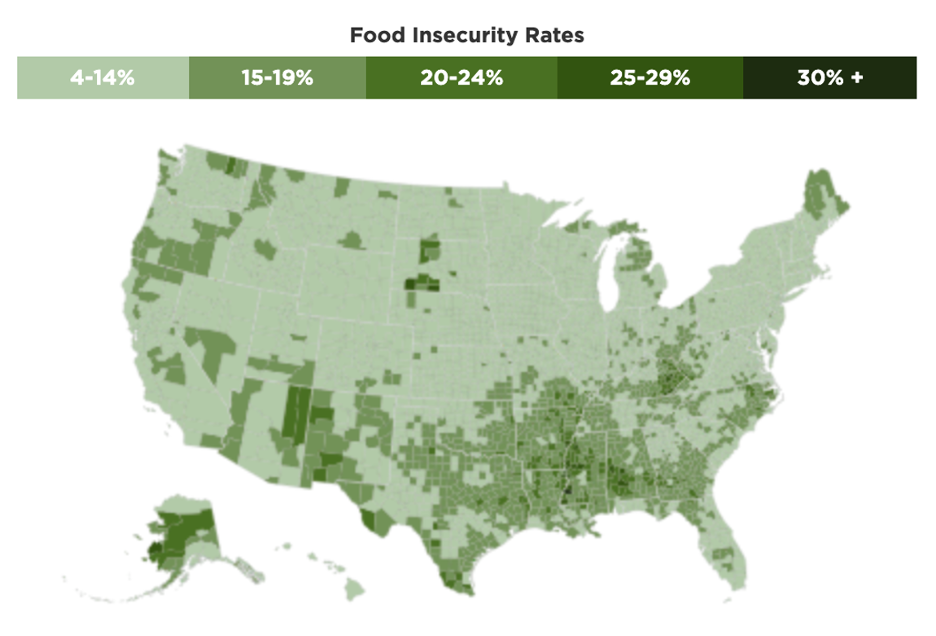
Source: Feeding America: Map the Meal Gap
As shown by the map above, most food insecure households are in the South. The following map illustrating the percent of each state’s population that is in poverty shows the strong correlation between food insecurity and poverty when compared with the map above.
County-Level Poverty Rates
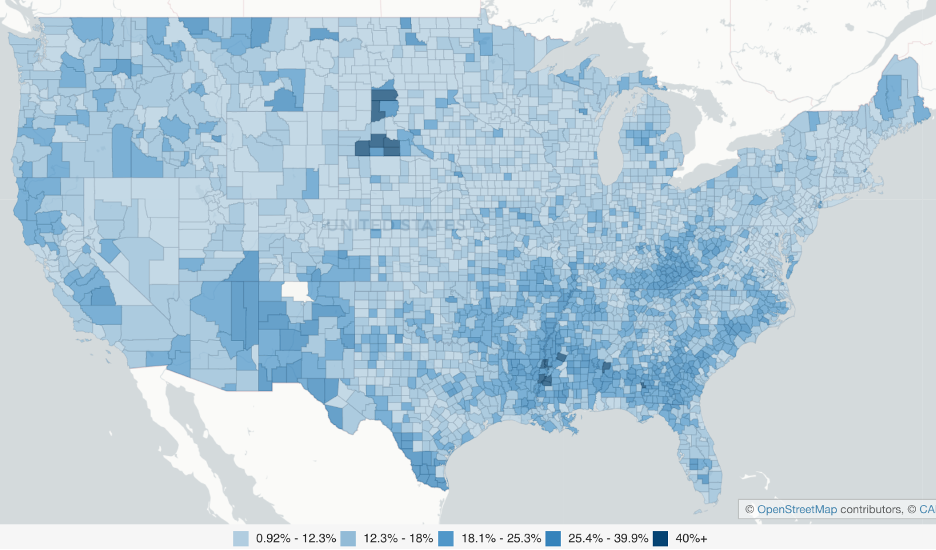
Source: DATA USA
How do food insecurity data compare with other economic indicators?
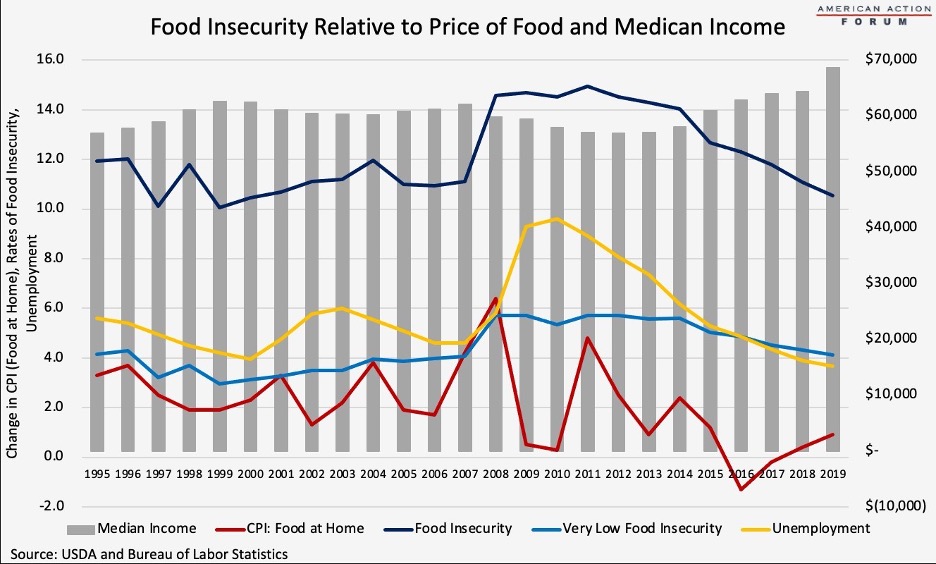
Over the past several decades, food insecurity rates have been relatively steady, although changing economic situations certainly have an impact, as one would expect. Not surprisingly, as shown in the chart below, rates of food insecurity, particularly very low food security, tend to increase as unemployment increases and income decreases. The impact of the price of food is a little less predictable as an indicator of food security because the price of food is affected by both supply and demand. When the price of food falls, demand may be expected to increase and food insecurity would decrease, and vice versa. If the price of food falls because of an economic downturn that dampens demand, however, it may take time for demand to return even after the prices come down. These opposing effects can be observed by looking at the spike in food insecurity that occurred as the price of food rose significantly in 2007 and 2008 but then persisted in 2009 and 2010 as the economic recession continued and food prices plummeted. Nonetheless, very low food security never surpassed 6 percent in the past 25 years, and by 2019 that rate was down to 4.1 percent.
What causes food insecurity?
While it is not known specifically what causes food insecurity for certain populations, numerous studies have revealed various risk factors.
The most common cause of food insecurity is low income. In 2016, low-income households were 2.6 times more likely than the average American household to be food insecure.[12] Relatedly, employment—both being unemployed and being employed but in a low-wage job—is also a strong factor in whether a household is food insecure.
Where one lives is also likely to affect food security. There are many neighborhoods throughout the country that lack grocery stores or other markets from which to buy fresh food and produce; instead, individuals in these neighborhoods are often left with easy access only to fast food restaurants and convenience stores. These areas are often referred to as “food desserts” or “food swamps.” Remember that food security is not simply a measure of whether or not one has enough to eat, but also whether the food constitutes a high-quality and varied diet. Again, income often plays a role in whether someone lives in such an area, as does race. One study found that wealthy neighborhoods had three times the number of grocery stores than poor neighborhoods, and majority White neighborhoods had four times the number of grocery stores than majority Black neighborhoods.[13] The distance people need to travel to obtain healthy food directly impacts consumption. The same study found that for every additional supermarket within the neighborhood, produce consumption increased by 32 percent.[14] Income and access to food also play a role in the consumption of fruits and vegetables in rural areas. One study found people in rural areas whose annual household income was at least $35,000 were more likely to consume 5 or more fruits or vegetables per day.[15] Another study, assessing both poverty and access to food in rural areas, found that while both factors impact health outcomes, access to healthy food was a stronger determinant.[16]
Numerous studies have also found disability to be a risk factor for food insecurity. This may be the result of several factors. A disability that limits one’s ability to work will often lead to low income. Disabilities that cause cognitive limitations may impair one’s ability to remember to eat, to know how to cook or what they should eat, or how to budget appropriately for necessary food consumption. Physical limitations may impair an individual’s ability to cook or prepare a meal or to shop for groceries. Findings from the National Health and Nutritional Examination Survey found that trouble seeing and trouble managing money caused the greatest increase in risk for food insecurity among disabled individuals, each increasing the risk by 4.4 percentage points.[17] In fact, the USDA found that one-third of households including an adult with a work-limiting disability suffered from food insecurity and households including a disabled adult represented 38 percent of households with very low food security.[18]
Most will likely not be surprised to learn that homelessness is highly associated with food insecurity, but the association also extends to individuals who rent rather than own their home, though this correlation is largely a reflection of income and the cost of housing. Homeowners without a mortgage were found to be the least food insecure (4.3 percent), followed by homeowners with a mortgage (11.6 percent) and renters (28.5 percent).[19]
Car ownership also decreases the likelihood of food insecurity by making it easier to shop for groceries, although unlike with homeownership, the association is not entirely a proxy for income. Lack of access to a car presents logistical challenges that make it difficult for an individual to easily shop for food. When individuals do not have access to their own car, they typically must either walk to the grocery store or take public transit and are then limited to purchasing only what they can carry or easily transport on the bus or subway. If individuals must depend on getting a ride from a friend or family member, they may not have reliable access to perishable items such as fresh produce, meat, and dairy products.[20]
How has the COVID-19 pandemic impacted food insecurity and insufficiency?
The Household Pulse Surveys conducted during the pandemic indicate that food insufficiency has ranged from roughly 8.5 percent to 12 percent over the past year. There are, however, numerous reasons to question the comparability of these results with those of the CPS-FSS from before the pandemic. Food insecurity data for 2020 that would typically be provided by the CPS-FSS are not yet available.
[1] https://www.ers.usda.gov/topics/food-nutrition-assistance/food-security-in-the-us/measurement/
[2] https://www.healthypeople.gov/2020/topics-objectives/topic/social-determinants-health/interventions-resources/food-insecurity#1
[3] https://www.ers.usda.gov/webdocs/publications/45655/29206_err29_002.pdf?v=41334
[4] https://www.healthypeople.gov/2020/topics-objectives/topic/social-determinants-health/interventions-resources/food-insecurity#1
[5] https://www.ers.usda.gov/topics/food-nutrition-assistance/food-security-in-the-us/measurement/#insufficiency
[6] https://www.ers.usda.gov/topics/food-nutrition-assistance/food-security-in-the-us/measurement/#insufficiency
[7] https://www.ers.usda.gov/topics/food-nutrition-assistance/food-security-in-the-us/key-statistics-graphics/, https://www.ers.usda.gov/topics/food-nutrition-assistance/food-security-in-the-us/measurement/#insufficiency
[8] https://www.ers.usda.gov/topics/food-nutrition-assistance/food-security-in-the-us/key-statistics-graphics/
[9] https://www.ers.usda.gov/topics/food-nutrition-assistance/food-security-in-the-us/key-statistics-graphics/
[10] https://www.ers.usda.gov/topics/food-nutrition-assistance/food-security-in-the-us/key-statistics-graphics/
[11] https://map.feedingamerica.org/
[12] Coleman-Jensen A, Rabbitt MP, Gregory CA, Singh A. Household food insecurity in the United States in 2016. USDA-ERS Economic Research Report No. (ERR-237). 2017
[13] https://www.ncbi.nlm.nih.gov/pmc/articles/PMC3794652/
[14] https://www.ncbi.nlm.nih.gov/pmc/articles/PMC3794652/
[15] https://www.ncbi.nlm.nih.gov/pmc/articles/PMC3365871/
[16] https://www.choicesmagazine.org/choices-magazine/theme-articles/food-and-poverty/rural-poverty-food-access-and-public-health-outcomes
[17] https://lernercenter.syr.edu/2019/09/10/having-a-disability-increases-the-likelihood-of-food-insecurity-despite-federal-programs-to-prevent-this-hardship/
[18] https://www.ers.usda.gov/amber-waves/2013/may/disability-is-an-important-risk-factor-for-food-insecurity
[19] https://equityhealthj.biomedcentral.com/articles/10.1186/s12939-019-1114-z
[20] Kristen Wiig Dammann and Chery Smith. 2009. “Factors Affecting Low-income Women’s Food Choices and the Perceived Impact of Dietary Intake and Socioeconomic Status on Their Health and Weight,” Journal of Nutrition Education and Behavior 41:4, 242–53; Renee Walker, Jason Block, and Ichiro Kawachi. 2012. “Do residents of food deserts express different food buying preferences compared to residents of food oases? A mixed-methods analysis ,” International Journal of Behavioral Nutrition and Physical Activity 9:41.