Research
January 10, 2017
The Gig Economy: Research and Policy Implications of Regional, Economic, and Demographic Trends
Research published by the American Action Forum and the Aspen Institute’s Future of Work Initiative
Executive Summary
Over the past few years, policymakers have grappled with the policy implications of the so-called “gig economy.” This paper adds to the small but growing literature by examining regional, economic, and demographic trends in the gig economy and its workers.
To do so, we use the General Social Survey (GSS) to construct three measures of gig economy workers:
- Gig 1: independent contractors, consultants, and freelancers.
- Gig 2: Gig 1 + temp agency workers and on-call workers.
- Gig 3: Gig 2 + contract company workers.
Our broadest measure of gig economy workers, gig 3, is the same measure of gig economy workers employed by Katz & Krueger (2016).[1]
Using these measures, we find:
- The data show rapid growth in gig economy employment. From 2002 to 2014, while total employment increased 7.5 percent, gig economy workers increased by between 9.4 percent and 15.0 percent, depending on the definition of gig economy workers. Between 2010 and 2014, growth in independent contractors alone accounted for 29.2 percent of all jobs added during that time period.
- There is tremendous geographic heterogeneity in the utilization of gig economy workers, with the lowest concentrations in Northeast and Upper Midwest states, and highest concentrations in Mountain and Pacific states. Moreover, what little information is available about regional trends is heavily influenced by the recovery from the Great Recession.
- Gig economy workers are less attached to the workforce and may turn to gig economy opportunities for additional income after getting laid off. All employed people in the United States in 2014 worked an average 46.7 weeks in 2013. Gig economy workers, on the other hand, worked an average 41.8 to 44 weeks. Meanwhile, 6.7 percent to 12 percent of gig economy workers have been laid off from previous work. That’s substantially higher than the 5.4 percent rate of all employed people in the country.
- Gig economy workers are also more likely to be part-time workers, and the portion of gig economy workers who are part-time has increased since 2002. They are also much more likely to mainly work at home than traditional workers, though this difference has narrowed in the last decade.
- The pattern of shifts in the income distribution differs between the entire workforce and gig economy workers, and the pattern within gig economy workers is sensitive to the definition. The timeframe also matters: looking at the changes between 2006 and 2014 (which contains both the downturn and recovery) produces a different picture than that from 2010 to 2014 (which focuses on the recovery).
- Pulling these results together, one finds a picture of the gig economy workforce that is, compared to traditional workers, more likely to be married, but also more reliant on part-time work and more likely to have been previously laid off, perhaps as a result of the Great Recession.
- The online gig economy appears to contribute to firm growth. This is especially true in the transportation sector, where online labor platforms have become pervasive. On average, in metropolitan areas the total average annual growths of establishments and receipts in the transportation sector were 7.7 percent and 9.4 percent respectively prior to the introduction of a ridesharing service, and 39.3 percent and 20.4 percent, respectively, in the years after the introduction of a ridesharing service.
Our results suggest some fruitful avenues for further research. First, the role of gig economy employment in cyclical recoveries stands out as an important issue for understanding overall employment patters, labor supply among couples, and the economic well-being of gig employees. At the same time, the regional differences unearthed in these data merit further documentation and understanding. What, for example, is the role of state-level policy in generating these trends?
These findings suggest a stance of forbearance by federal policymakers. The nature of employment and economic well-being patterns is sensitive to data definitions – always an indication that drawing bright policy lines is a problematic endeavor. It also suggests that there may be a role for federalizing the gig economy policy response.
Introduction
Over the past few years, policymakers have grappled with the policy implications of the so-called “gig economy.” How many workers participate in the gig economy? Do they treat their work in the gig economy as full-time employment or just additional income on the side? How well are gig workers compensated? Do gig workers require workplace protections awarded to conventional employees? How much did the Great Recession and the development of smartphone technology impact the gig economy?
These are important questions. Unfortunately, answering them has been handicapped by a paucity of information. Using the information available in the GSS and Census non-employer establishment data, Gitis and Rinehart previously found that the overall number of gig economy workers grew between 8.8 percent and 14.4 percent between 2002 and 2014, with the result that as of 2014 gig economy workers represented between 14.0 percent and 20.3 percent of the workforce. In addition, in recent years non-employer firms have started growing much more quickly than before the advent of much of the current online platform technology.
In this paper, we build on this previous research by examining how these trends in the gig economy workforce vary regionally. In particular, this paper is presented in two sections:
First, we examine how trends in the entire gig economy workforce – that is, all people in alternative work arrangements – vary by region, industry, and occupation. We also aim to better document the economic lives of gig economy workers with information such as work history, full-time or part-time status, and various demographic characteristics.
Second, to better understand how online platforms are allowing workers to utilize new technologies for gig economy work, we analyze how trends in non-employer firms vary by metropolitan area. We perform this analysis for firms in industries that have been particularly impacted by online platforms, such as the taxi and hotel industries.
Previous Research
Previously, Gitis and Rinehart examined two aspects of the gig economy: (1) all people in gig economy work, and (2) workers who specifically utilize new technologies, markets, and platforms for gig economy work.[2]
To analyze gig economy work, they utilized the GSS, a statistical survey conducted by University of Chicago’s National Option Research Center. There is no consensus definition of who is a “gig economy worker.” Instead, they employed a range of measures to identify alternative work arrangements. Specifically, they constructed three measures:
- Gig 1. The narrowest definition: independent contractors, consultants, and freelancers.
- Gig 2. The middle measure: Gig 1 plus temp agency workers and on-call workers.
- Gig 3. The broadest definition: Gig 2 plus contract company workers.
In order to better understand the growth of gig economy workers who utilize online platforms, Gitis and Reinhart used Census data on businesses that have no paid employees and that pay federal income tax. These firms are called non-employer establishments and they may provide one illustration of the rise in the online gig economy. They found that since the recovery began, nearly 1.3 million new non-employer establishments were created between 2009 and 2013. In fact, growth in these firms outpaced growth in all establishments to become almost 75 percent of all businesses. They also found that growth in companies like Airbnb, Lyft, and Uber coincides with substantial increases in non-employer firms in the transportation and warehousing sector. For example, from 2002 to 2008, non-employer firms in the taxi and limousine sector increased at an average rate of 4.3 percent per year. After Uber was established, the average annual growth rate among these non-employer firms jumped to 7 percent from 2009 to 2013. In this paper, we update these figures by incorporating 2014 non-employer data.
Regional, Industry, Occupation, and Economic Trends in the Contingent Workforce
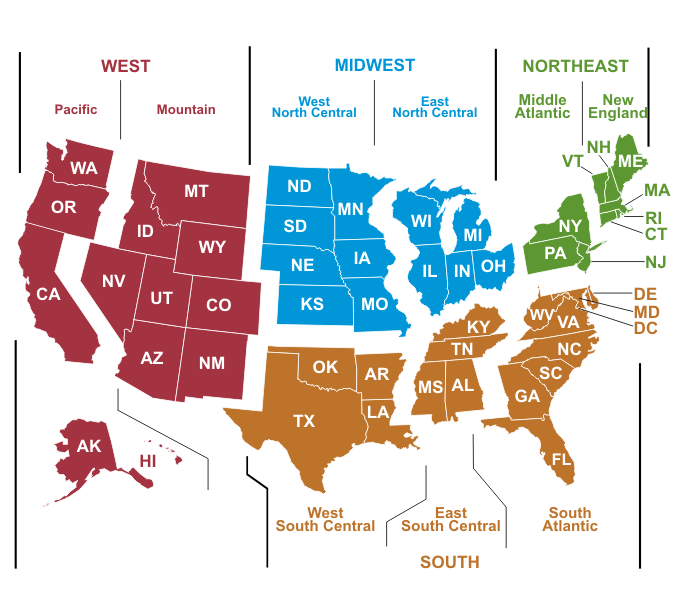
Building on this previous work, we examine how trends in the gig economy workforce vary by region, industry, and occupation. In addition, we examine economic and demographic characteristics of gig economy workers to better understand their economic lives and well-being. In doing so, we again employ the GSS data and the same menu of measures to identify gig economy workers (Gig 1, Gig 2, Gig 3).[3] For our analysis, we use the conventional Census definitions of regions in the United States (see below).
Regional Differences in Alternative Work Arrangements
Table 1 contains the estimated number of all workers and gig economy workers in each of the nine regional divisions in the United States in 2014. The latest data indicate that in 2014, there were 20.7 million to 30 million gig economy workers in the United States.[4] Clearly, the regions are not merely clones of one another; the U.S. displays great heterogeneity in the geography of gig economy workers.
|
Table 1: Regional Distribution of Gig Economy Workers, 2014 (thousands) |
||||
| Region | All Workers | Gig 1 | Gig 2 | Gig 3 |
| New England | 7,328 | 782 | 938 | 1,145 |
| Middle Atlantic | 19,218 | 2,251 | 2,618 | 3,121 |
| East North Central | 21,791 | 2,678 | 3,596 | 3,987 |
| West North Central | 10,594 | 547 | 1,169 | 1,272 |
| South Atlantic | 28,388 | 3,756 | 5,017 | 5,225 |
| East South Central | 7,893 | 954 | 1,246 | 1,402 |
| West South Central | 17,320 | 2,519 | 2,890 | 3,305 |
| Mountain | 10,618 | 3,121 | 3,732 | 4,858 |
| Pacific | 23,487 | 4,111 | 4,893 | 5,683 |
| Total | 146,637 | 20,718 | 26,039 | 29,998 |
Source: NORC at the University of Chicago, “General Social Survey,” University of Chicago, http://gss.norc.org/get-the-data & Bureau of Labor Statistics, “Local Area Unemployment Statistics,” Department of Labor, http://www.bls.gov/data/.
This is seen even more clearly in Table 2, where gig economy workers accounted for 14.1 percent to 20.5 percent of all workers in the country, but also where the range varied significantly across regions.
| Table 2: Gig Economy Workers as a Percent of all Workers by Region, 2014 | |||
| Region | Gig 1 | Gig 2 | Gig 3 |
| New England | 10.7% | 12.8% | 15.6% |
| Middle Atlantic | 11.7% | 13.6% | 16.2% |
| East North Central | 12.3% | 16.5% | 18.3% |
| West North Central | 5.2% | 11.0% | 12.0% |
| South Atlantic | 13.2% | 17.7% | 18.4% |
| East South Central | 12.1% | 15.8% | 17.8% |
| West South Central | 14.5% | 16.3% | 19.1% |
| Mountain | 29.4% | 35.1% | 45.7% |
| Pacific | 17.5% | 20.8% | 24.2% |
| Total | 14.1% | 17.8% | 20.5% |
Source: NORC at the University of Chicago, “General Social Survey,” University of Chicago, http://gss.norc.org/get-the-data.
Gig economy workers are least common in the West North Central and New England. In 2014, gig economy workers only represented 5.2 percent to 12 percent of all employees in West North Central and 10.7 percent to 15.6 percent of workers in New England. In the western regions of the country, however, the gig economy is far more substantial: in 2014, gig economy workers represented 17.5 percent to 24.2 percent of all workers in the Pacific region. The Mountain region had the highest rate of alternative work arrangements: gig economy workers represented 29.4 percent to 45.7 percent of all employees in the region.
Table 2a takes a slightly different approach to regional variation, showing the fraction of workers – overall and by definition of gig economy worker – in each region.
| Table 2a: Percentage Distribution of Gig Economy Workers by Region, 2014 | ||||
| Region | All Workers | Gig1 | Gig2 | Gig3 |
| New England | 5.0% | 3.8% | 3.6% | 3.8% |
| Middle Atlantic | 13.1% | 10.9% | 10.1% | 10.4% |
| East North Central | 14.9% | 12.9% | 13.8% | 13.3% |
| West North Central | 7.2% | 2.6% | 4.5% | 4.2% |
| South Atlantic | 19.4% | 18.1% | 19.3% | 17.4% |
| East South Central | 5.4% | 4.6% | 4.8% | 4.7% |
| West South Central | 11.8% | 12.2% | 10.9% | 11.0% |
| Mountain | 7.2% | 15.1% | 14.3% | 16.2% |
| Pacific | 16.0% | 19.8% | 18.8% | 18.9% |
| Total | 100.0% | 100.0% | 100.0% | 100.0% |
Source: NORC at the University of Chicago, “General Social Survey,” University of Chicago, http://gss.norc.org/get-the-data.
In addition, despite growing at a rapid pace in the last decade overall, the growth in the gig economy also varied significantly across the United States. Table 3 shows the percent change in the gig economy workforce in each region between 2002 and 2014.
| Table 3: Growth in Gig Economy Workers Since 2002 by Region | ||||
| Region | All Workers | Gig 1 | Gig 2 | Gig 3 |
| New England | 3.0% | -47.2% | -41.7% | -32.4% |
| Middle Atlantic | 3.0% | -3.4% | -15.3% | -9.0% |
| East North Central | -1.0% | -5.6% | 3.6% | -3.9% |
| West North Central | 4.5% | -50.4% | -18.8% | -16.5% |
| South Atlantic | 12.4% | 21.5% | 42.7% | 14.2% |
| East South Central | 1.6% | -37.4% | -37.4% | -38.7% |
| West South Central | 17.4% | 35.2% | 39.2% | 36.9% |
| Mountain | 15.6% | 93.9% | 100.3% | 160.7% |
| Pacific | 9.1% | 33.0% | 31.3% | 36.9% |
| Total | 7.5% | 9.4% | 14.5% | 15.0% |
Source: NORC at the University of Chicago, “General Social Survey,” University of Chicago, http://gss.norc.org/get-the-data & Bureau of Labor Statistics, “Local Area Unemployment Statistics,” Department of Labor, http://www.bls.gov/data/.
From 2002 to 2014, total employment in the United States increased 7.5 percent. Meanwhile, the number of gig economy workers expanded by between 9.4 percent and 15 percent. But each region has a unique story. In New England, for instance, total employment increased 3 percent. Gig economy workers, however, declined 32.4 percent to 47.2 percent. Meanwhile, in the Pacific region, employment grew 9.1 percent and the number of gig economy workers increased by 31.3 percent to 36.9 percent. And the area with the most growth in gig economy workers, the Mountain region, experienced a 15.6 percent increase in total employment and a 93.9 percent to 160.7 percent rise in gig economy workers.
As becomes clear in Table 4, however, since the end of the Great Recession, many of these trends have changed or even reversed.
| Table 4: Growth in Gig Economy Workers since 2010 by Region | ||||
| Region | All Workers | Gig 1 | Gig 2 | Gig 3 |
| New England | 3.1% | 104.5% | 90.7% | 132.9% |
| Middle Atlantic | 2.5% | 20.8% | -8.8% | 1.0% |
| East North Central | 3.5% | 55.0% | 20.7% | 22.6% |
| West North Central | 3.9% | -44.7% | 18.3% | 28.7% |
| South Atlantic | 6.7% | -26.4% | -21.6% | -35.7% |
| East South Central | 1.5% | 40.3% | -8.4% | -17.0% |
| West South Central | 7.8% | 0.5% | -14.9% | -17.0% |
| Mountain | 6.3% | 212.7% | 161.8% | 228.2% |
| Pacific | 6.9% | -6.5% | -15.9% | -18.2% |
| Total | 5.1% | 11.1% | 1.5% | -0.2% |
Source: NORC at the University of Chicago, “General Social Survey,” University of Chicago, http://gss.norc.org/get-the-data.
In New England, for instance, while gig economy workers declined overall between 2002 and 2014, since 2010 these workers have increased 90.7 percent to 132.9 percent. As a result, since 2010 gig economy workers have accounted for 179.7 percent to 293.7 percent of all new jobs added in New England, suggesting that traditional work in the region is declining and being replaced with gig economy jobs.
The reverse is true in the Pacific Region. Despite the long-term growth in gig economy work, the prevalence of gig economy workers declined 6.5 percent – to 18.2 percent – since 2010 even though employment in the region overall rose 6.9 percent. This suggests that since 2010, gig economy work has been declining in the Pacific and is being replaced with traditional payroll jobs.
Overall, independent contractors (Gig 1) played a large role in the economic recovery. Between 2010 and 2014, independent contractors grew 11.1 percent (2.1 million workers) and represented 29.2 percent of all jobs added during that time period.
The upshot of the regional data is that there is tremendous geographic heterogeneity in the utilization of gig economy workers, and that what little information is available about regional trends is heavily influenced by the recovery from the Great Recession. The cyclical role of gig economy employment should be a central topic of future research.
Industry and Occupation
The size of the gig economy workforce also varies considerably by industry and occupation. Table 5 contains the estimated percent of workers in each industry in a gig economy job, for each of our gig economy worker definitions.
| Table 5: Prevalence of Gig Economy Workers in Each Industry, 2014 | |||
| Industry | Gig 1 | Gig 2 | Gig 3 |
| Agriculture & Mining | 33.9% | 33.9% | 33.9% |
| Construction | 35.2% | 44.7% | 56.2% |
| Manufacturing | 4.5% | 9.6% | 12.1% |
| Wholesale & Retail Trade | 8.5% | 9.9% | 11.5% |
| Transportation & Utilities | 19.9% | 23.8% | 28.6% |
| Information | 15.1% | 15.1% | 20.3% |
| Financial Activities | 22.0% | 27.8% | 27.8% |
| Professional & Business Services | 22.0% | 24.2% | 26.7% |
| Education & Health Services | 7.2% | 8.7% | 9.6% |
| Leisure & Hospitality | 6.5% | 12.4% | 13.2% |
| Other Services | 39.0% | 46.8% | 48.5% |
| Public Administration | 1.5% | 1.5% | 6.7% |
Source: NORC at the University of Chicago, “General Social Survey,” University of Chicago, http://gss.norc.org/get-the-data.
The industries with a highest percentage of gig economy workers are agriculture and mining; construction; finance; professional and business services; and other services. The other services industry category includes miscellaneous personal services such as beauty shops, laundry and cleaning services, and various repair shops. In 2014, gig economy workers constituted 35.2 percent to 56.2 percent of all employed people in the construction industry. Gig economy workers also represented 33.9 percent of workers in agriculture and mining. Meanwhile in leisure and hospitality, education and health services, and manufacturing, gig economy workers are not a major factor. For instance, gig economy workers in 2014 only represented 7.2 percent to 9.6 percent of education and health services workers and 6.5 percent to 13.2 percent of leisure and hospitality workers. Finally, government appears to be much less affected by the gig economy.
Table 6 turns to occupational distributions, showing the percent of workers in gig economy positions by occupation.
| Table 6: Prevalence of Gig Economy Workers in Each Occupation, 2014 | |||
| Occupation | Gig 1 | Gig 2 | Gig 3 |
| Management, business, and financial | 17.9% | 18.9% | 20.4% |
| Professional and related | 10.8% | 12.4% | 13.7% |
| Service | 14.4% | 19.2% | 20.6% |
| Sales and related | 23.6% | 25.1% | 27.0% |
| Office and administrative support | 4.4% | 8.4% | 10.8% |
| Farming, fishing, and forestry | 26.7% | 26.7% | 26.7% |
| Construction and extraction | 30.5% | 40.6% | 57.2% |
| Installation, maintenance, and repair | 15.7% | 15.7% | 17.6% |
| Production | 9.5% | 19.4% | 23.9% |
| Transportation and material moving | 13.3% | 20.6% | 27.5% |
Source: NORC at the University of Chicago, “General Social Survey,” University of Chicago, http://gss.norc.org/get-the-data.
For some occupation categories, the gig economy is not a major factor. This is particularly true for office and administrative support workers, of whom only 4.4 percent to 10.8 percent were gig economy workers in 2014. On the other hand, the gig economy seems to be consistently quite large for workers in sales and farming occupations – 23.6 percent to 27 percent of sales workers were gig economy workers, as were 26.7 percent of farmers.
Moreover, the prevalence of the gig economy workforce varies substantially within construction and production occupations, depending on how gig economy is defined. At the lower end, only 9.5 percent of production workers were independent contractors (Gig 1) in 2014. But, 23.9 percent were independent contractors, temp agency workers, on-call workers, or contract company workers (Gig 3). At the upper end, independent contractors represented a substantial 30.5 percent of construction workers. But independent contractors, along with temp agency, on-call, and contract company workers represented 57.2 percent of construction workers.
Finally, one might suspect that regional differences in growth in the gig economy are an artifact of regional differences in the industrial or occupational concentrations. A closer look at the data, however, reveals no such clear explanation.
Economic Characteristics
The economic progress of U.S. workers has been a central focus of policy debates during the course of the recovery from the Great Recession. This has raised the obvious question: are gig economy workers doing better or worse? While many worry that the gig economy leaves workers worse off with lower earnings, fewer benefits, and undependable hours, others believe that workers in the gig economy enjoy more workplace flexibility and that these gig economy jobs provide relief to those who have previously lost a job and face economic hardship. To help understand these issues, we examine the economic characteristics of gig economy workers, such as work history, current job characteristics, and family income.
We start with work history. As illustrated in Table 7, compared to the entire workforce in 2014, gig economy workers worked fewer weeks in the previous year and were more likely to have ever been laid off.
| Table 7: Work History, 2014 | ||
| Category | Weeks Worked Last Year | Ever Laid Off |
| All Workers | 46.7 | 5.4% |
| Gig 1 | 44.0 | 6.7% |
| Gig 2 | 41.8 | 9.0% |
| Gig 3 | 42.3 | 12.0% |
Source: NORC at the University of Chicago, “General Social Survey,” University of Chicago, http://gss.norc.org/get-the-data.
According to the GSS data, all employed people in the United States in 2014 worked an average 46.7 weeks in 2013. Gig economy workers, on the other hand, worked an average 41.8 to 44 weeks. Meanwhile, 6.7 percent to 12 percent of gig economy workers have been laid off from previous work. That’s substantially higher than the 5.4 percent rate for all employed people in the country. The fewer hours indicate that workers in the gig economy are less attached to the workforce and many may turn to those opportunities for additional income after getting laid off.
Gig economy workers are also more likely to be part-time workers, and the portion of gig economy workers who are part-time has increased since 2002. This is highlighted in Table 8.[5]
| Table 8: Full-Time/Part-Time Status | |||
| Category | 2002 | 2014 | Percentage point Change |
| All Workers | |||
| Full-Time | 79.5% | 79.9% | 0.4 |
| Part-Time | 18.6% | 17.6% | -1.0 |
| Gig 1 | |||
| Full-Time | 70.9% | 61.5% | -9.4 |
| Part-Time | 27.5% | 35.4% | 7.8 |
| Gig 2 | |||
| Full-Time | 66.5% | 56.7% | -9.8 |
| Part-Time | 30.4% | 38.4% | 8.1 |
| Gig 3 | |||
| Full-Time | 67.7% | 59.5% | -8.2 |
| Part-Time | 29.4% | 35.7% | 6.3 |
Source: NORC at the University of Chicago, “General Social Survey,” University of Chicago, http://gss.norc.org/get-the-data.
In 2002, 18.6 percent of all employed people were part-time workers, with 27.5 percent to 30.4 percent of gig economy workers working part-time. By 2014, the entire workforce was slightly less likely to work part-time at 17.6 percent. In the gig economy, however, workers became far more likely to work part-time. In 2014, 35.4 percent to 38.4 percent of gig economy workers were part-time.
To help illustrate trends in workplace flexibility for gig economy workers, Table 9 contains the information on how often they work at home.
| Table 9: Works at Home | |||
| Frequency | 2002 | 2014 | Percentage Point Change |
| All Workers | |||
| Never | 62.1% | 60.9% | -1.2 |
| Occasional | 20.1% | 19.0% | -1.1 |
| Frequent | 17.7% | 19.9% | 2.2 |
| Gig 1 | |||
| Never | 28.6% | 33.6% | 4.9 |
| Occasional | 17.7% | 20.6% | 3.0 |
| Frequent | 53.7% | 45.8% | -7.9 |
| Gig 2 | |||
| Never | 35.8% | 41.1% | 5.4 |
| Occasional | 16.6% | 20.0% | 3.4 |
| Frequent | 47.7% | 38.9% | -8.7 |
| Gig 3 | |||
| Never | 40.8% | 44.6% | 3.9 |
| Occasional | 16.2% | 18.9% | 2.6 |
| Frequent | 43.0% | 36.5% | -6.5 |
Source: NORC at the University of Chicago, “General Social Survey,” University of Chicago, http://gss.norc.org/get-the-data.
In general, gig economy workers work from home much more often than the workforce as a whole. Over time, however, it appears that as the gig economy becomes more widespread, gig economy workers are less likely to work from home. In 2002, 17.7 percent of all employed people indicated that they frequently work at home, which increased to 19.9 percent in 2014. Meanwhile 43 percent to 53.7 of gig economy workers frequently worked at home in 2002. By 2014, however, 36.5 percent to 45.8 percent of gig economy workers frequently worked at home. So while gig economy workers are still much more likely to mainly work at home than traditional workers, they appear to be doing so much less often than they did a decade ago.
Perhaps the most comprehensive indicator of a gig economy worker’s resources is his or her family income. Table 10 contains the distribution of family income for all workers and gig economy workers in 2006, 2010, and 2014, the three years that GSS reported this information for gig economy workers.
Unfortunately, no compelling patterns emerge from examining the table.
| Table 10: Family Income | ||||
| Category | 2006 | 2010 | 2014 | Percentage Point Change since 2006 |
| All Workers | ||||
| Under $30,000 | 18.0% | 23.6% | 19.1% | 1.1 |
| $30,000 to $49,999 | 18.1% | 15.6% | 17.7% | -0.4 |
| $50,000 to $89,999 | 27.6% | 27.7% | 27.1% | -0.5 |
| $90,000 to $129,999 | 13.8% | 12.5% | 14.0% | 0.2 |
| $130,000 and over | 10.4% | 12.2% | 15.5% | 5.1 |
| Refused/Don’t Know | 12.2% | 8.4% | 6.7% | -5.5 |
| Gig 1 | ||||
| Under $30,000 | 14.8% | 24.7% | 25.7% | 10.9 |
| $30,000 to $49,999 | 14.5% | 11.2% | 12.2% | -2.4 |
| $50,000 to $89,999 | 23.8% | 25.5% | 25.4% | 1.6 |
| $90,000 to $129,999 | 12.7% | 11.5% | 10.4% | -2.4 |
| $130,000 and over | 20.2% | 14.4% | 18.8% | -1.3 |
| Refused/Don’t Know | 14.0% | 12.8% | 7.6% | -6.4 |
| Gig 2 | ||||
| Under $30,000 | 20.6% | 31.2% | 28.0% | 7.4 |
| $30,000 to $49,999 | 15.1% | 10.2% | 14.6% | -0.5 |
| $50,000 to $89,999 | 22.5% | 23.5% | 24.5% | 2.0 |
| $90,000 to $129,999 | 10.9% | 10.6% | 10.5% | -0.4 |
| $130,000 and over | 16.0% | 13.1% | 15.8% | -0.2 |
| Refused/Don’t Know | 15.0% | 11.4% | 6.7% | -8.3 |
| Gig 3 | ||||
| Under $30,000 | 21.1% | 32.5% | 28.1% | 7.0 |
| $30,000 to $49,999 | 14.1% | 10.0% | 16.3% | 2.2 |
| $50,000 to $89,999 | 25.0% | 23.7% | 25.5% | 0.5 |
| $90,000 to $129,999 | 11.5% | 11.0% | 9.8% | -1.7 |
| $130,000 and over | 14.6% | 12.3% | 14.6% | 0.0 |
| Refused/Don’t Know | 13.7% | 10.5% | 5.8% | -7.9 |
Source: NORC at the University of Chicago, “General Social Survey,” University of Chicago, http://gss.norc.org/get-the-data.
The pattern of shifts in the income distribution differs between the entire workforce and gig economy workers, and the pattern within gig economy workers is sensitive to the definition. The timeframe also matters: looking at the changes between 2006 and 2014 (which contains both the downturn and recovery) produces a different picture than that from 2010 to 2014 (which focuses on the recovery).
One interpretation is that workers in recent years have turned to gig economy work after losing a job and facing a decline in family income. In this sense, the gig economy could be providing struggling families with opportunities for additional resources that they otherwise would not be able to obtain. This seems particularly true in light of the fact that gig economy workers are more likely to have been laid off from a previous job and have become more likely to be part-time workers.
Demographic Trends
Given the income and work characteristics of gig economy workers, it also is important to consider how demographic factors may be driving these economic trends. For instance, gig economy workers on average are older than the entire workforce and the average age of gig workers has increased more rapidly. This is illustrated in Table 11.
| Table 11: Age Distribution | |||||
| Worker Category | 2002 | 2006 | 2010 | 2014 | 2002-2014 Change |
| All Workers | |||||
| Mean | 40.9 | 41.4 | 43.2 | 43.4 | 2.4 |
| Median | 40 | 42 | 43 | 43 | 3.0 |
| Gig 1 | |||||
| Mean | 46.1 | 45.6 | 50.4 | 50.1 | 4.0 |
| Median | 46 | 44 | 50 | 53 | 7.0 |
| Gig 2 | |||||
| Mean | 44.8 | 45.0 | 47.2 | 48.1 | 3.3 |
| Median | 45 | 43 | 46 | 51 | 6.0 |
| Gig 3 | |||||
| Mean | 44.5 | 44.1 | 46.7 | 47.7 | 3.2 |
| Median | 44 | 43 | 46 | 50 | 6.0 |
Source: NORC at the University of Chicago, “General Social Survey,” University of Chicago, http://gss.norc.org/get-the-data.
In 2002, the average age of all employed people was 40.9, while the average age among gig economy workers was 44.5 to 46.1. This means that gig economy workers in 2002 were already a considerable 3.6 to 5.2 years older than all employed people on average. (Notice the same pattern emerges using median ages.) By 2014 the average age for gig economy workers increased, ranging from 47.7 to 50.1 years old. By comparison, the average for all workers meanwhile only increased by 2.4 years to 43.4, meaning that the age differential between gig economy workers and the entire workforce (4.3 to 6.7 years) is growing. This may indicate that a number of gig economy workers are relying on gig work for additional income later in their careers or in retirement, rather than for full-time income to support an entire family.
In addition, gig economy workers are more likely to be married than all workers, but the spouses of gig economy workers are less likely to have full-time jobs. These trends are illustrated in Tables 12 and 13.
| Table 12: 2014 Marital Status | ||||
| Marital Status | All Workers | Gig 1 | Gig 2 | Gig 3 |
| Married | 54.2% | 61.9% | 57.2% | 55.9% |
| Divorced, Widowed, or Separated | 18.1% | 20.7% | 23.9% | 24.9% |
| Never Married | 27.7% | 17.5% | 18.9% | 19.2% |
Source: NORC at the University of Chicago, “General Social Survey,” University of Chicago, http://gss.norc.org/get-the-data.
In 2014, 54.2 percent of all workers were married, while 55.9 percent to 61.9 percent of gig economy workers were married. Gig economy workers were also more likely to have been previously married than the entire workforce, but less likely to have never been married.
The spouses of gig economy workers who are married, however, are less likely to be employed full-time than the spouses of all workers who are married.
| Table 13: Labor Force Status of Spouse, 2014 | ||||
| Spouse Employment Status | All Workers | Gig 1 | Gig 2 | Gig 3 |
| Full-Time | 61.5% | 55.3% | 55.2% | 55.5% |
| Part-Time | 11.4% | 12.5% | 14.2% | 14.2% |
| Total | 72.9% | 67.7% | 69.4% | 69.7% |
Source: NORC at the University of Chicago, “General Social Survey,” University of Chicago, http://gss.norc.org/get-the-data.
In 2014, 61.5 percent of the spouses of all married workers had a full-time job and 72.9 percent were employed at all. Only 55.2 percent to 55.5 percent of the spouses of gig economy workers had a full-time job and 67.7 percent to 69.7 percent were employed at all.
Pulling these results together, one finds a picture of the gig economy workforce consisting of a greater fraction of married couples, but a greater likelihood of part-time work and layoffs from jobs, perhaps as a result of the Great Recession.
Next we turn to the gender and race characteristics of gig economy workers. Table 14 contains the gender distribution of gig economy workers in 2002 and in 2014.
| Table 14: Gender | ||||
| Category | 2002 | 2014 | ||
| Male | Female | Male | Female | |
| All Worker | 49.4% | 50.6% | 49.0% | 51.0% |
| Gig 1 | 54.4% | 45.6% | 60.7% | 39.3% |
| Gig 2 | 52.7% | 47.3% | 59.5% | 40.5% |
| Gig 3 | 55.4% | 44.6% | 59.9% | 40.1% |
Source: NORC at the University of Chicago, “General Social Survey,” University of Chicago, http://gss.norc.org/get-the-data.
Men have continually held the majority of gig economy jobs and since 2002 they have only become more likely to be in those work arrangements. In 2002, while 49.4 percent of the entire workforce was male and 50.6 percent was female, 52.7 percent to 55.4 percent of gig economy workers were male and 44.6 percent to 47.3 percent were female. By 2014, the gig economy had become even more heavily dominated by men: 59.5 percent to 60.7 percent of gig economy workers were male and 39.3 percent to 40.5 percent were female. By comparison, the gender distribution of the entire workforce – 49 percent male and 51 percent female – was relatively unchanged over this period.
Finally, we find that over the last decade gig economy workers have been slightly more likely to be White and less likely to be Black than the entire workforce. These trends are illustrated in Table 15.
| Table 15: Race | ||||||
| Category | 2002 | 2014 | ||||
| White | Black | Other | White | Black | Other | |
| All Worker | 79.7% | 13.4% | 7.0% | 73.2% | 14.2% | 12.7% |
| Gig 1 | 83.5% | 8.7% | 7.8% | 78.9% | 7.7% | 13.4% |
| Gig 2 | 82.1% | 10.2% | 7.6% | 74.4% | 9.0% | 16.6% |
| Gig 3 | 80.8% | 11.5% | 7.6% | 72.5% | 11.7% | 15.8% |
Source: NORC at the University of Chicago, “General Social Survey,” University of Chicago, http://gss.norc.org/get-the-data.
In 2002, 79.7 percent of all workers were White and 80.8 percent to 83.5 percent of gig economy workers were White. Meanwhile, 13.4 percent of all employed people were Black, as were 8.7 percent to 11.5 percent of gig economy workers. By 2014, 73.2 percent of all workers were White and 14.2 percent were Black. 72.5 percent to 78.9 percent of gig economy workers were White and 7.7 percent to 11.7 percent were Black. In addition, all workers and gig economy workers in particular have become more likely to be labeled by GSS as an “Other” race, which includes Asian, Native American, and Native Hawaiian or Other Pacific.[6] From 2002 to 2014, the portion of all workers who were one of those race categories increased from 7 percent to 12.7 percent. The portion of gig economy workers who were one of those race categories increased from a range of 7.6 percent to 7.8 percent to a range of 13.4 percent to 16.6 percent.
Online Gig Economy and Non-employer Firms
Standard methods have found it difficult to track employment changes due to the online gig economy, a subset of the larger gig economy workforce. For one, the businesses employing this group of workers have higher rates of entry into the market, but also have high rates of exit.[7] According to internal surveys, about 11 percent of Uber drivers stop working on the platform within a month, and around half are gone by the one-year mark.[8] Many workers also do not consider their online gig economy work to be a job (either part time or full time) and resist calling it one when answering surveys. About 11 percent of all active Etsy sellers identify themselves as unemployed even though their dealings online would often qualify as work.[9]
Like in our previous work, to examine the growth of the online gig economy we use Census data for non-employer firms as a proxy, which includes businesses that have no paid employees, pay federal income tax, and have receipts over $1,000. Released on an 18-month delay, this survey provides establishment and receipt data for all of the top level sectors as outlined by the North American Industry Classification System (NAICS), and many of the specific sectors as well. Establishment numbers approximate the number of firms by sector, while the receipts approximate revenue. In selected sectors where online gig economy workers would file earnings, increases in non-employer establishments and receipts can be found.
Table 16 below shows recent data for non-employer establishments and their average receipts.
| Table 16: Trends in Non-employer Establishments | ||||
| Year | Total Non-employer Establishments | Receipts (in $1,000s) | Average Receipt / Establishment | |
| 2002 | 17,646,062 | 770,032,328 | $43,638 | |
| 2003 | 18,649,114 | 829,819,228 | $44,496 | |
| 2004 | 19,523,741 | 887,001,820 | $45,432 | |
| 2005 | 20,392,068 | 951,206,297 | $46,646 | |
| 2006 | 20,768,555 | 970,384,137 | $46,724 | |
| 2007 | 21,708,021 | 991,791,563 | $45,688 | |
| 2008 | 21,351,320 | 962,791,527 | $45,093 | |
| 2009 | 21,695,828 | 923,018,039 | $42,544 | |
| 2010 | 22,110,628 | 950,813,840 | $43,003 | |
| 2011 | 22,491,080 | 989,628,512 | $44,001 | |
| 2012 | 22,735,915 | 1,030,932,886 | $45,344 | |
| 2013 | 23,005,620 | 1,052,025,268 | $45,729 | |
| 2014 | 23,836,937 | 1,115,921,379 | $46,815 | |
Source: United States Census Bureau, “Nonemployer Statistics,” U.S. Department of Commerce, 1997-2014, http://www.census.gov/econ/nonemployer/download.htm.
Since the beginning of the recovery in 2009, over 2.1 million new non-employer establishments were created, far outpacing growth in total employer establishments by nearly 3 times. In the most recent year of data, between 2013 and 2014, nearly 831,000 non-employer businesses were created, substantially above the 270,000 non-employer businesses added the previous year. Just under 18 percent of this growth came from the transportation and warehousing sector alone, placing it as the quickest growing sector.
| Table 17: Non-employer Firms by Industry | ||||||||
| 2014 | 2013 | 2012 | 2011 | 2010 | 2009 | Average Annual Percent Change 2003 – 2008 | Average Annual Percent Change 2009 – 2014 | |
| Total for all sectors | 23,836,937 | 23,005,620 | 22,735,915 | 22,491,080 | 22,110,628 | 21,695,828 | 14.5 | 9.9 |
| Agriculture, forestry, fishing and hunting | 237,817 | 239,863 | 240,054 | 237,942 | 236,705 | 228,788 | 2.3 | 3.9 |
| Mining, quarrying, and oil and gas extraction | 109,866 | 106,610 | 109,931 | 109,736 | 105,922 | 101,584 | 23.7 | 8.2 |
| Utilities | 19,984 | 19,344 | 18,452 | 17,430 | 16,644 | 16,894 | 31.9 | 18.3 |
| Construction | 2,442,519 | 2,368,442 | 2,346,798 | 2,387,969 | 2,424,231 | 2,455,453 | 12.9 | -0.5 |
| Manufacturing | 350,346 | 343,025 | 344,658 | 329,785 | 318,409 | 313,195 | 5 | 11.9 |
| Wholesale trade | 416,799 | 406,469 | 408,487 | 403,292 | 393,408 | 390,126 | 3.2 | 6.8 |
| Retail trade | 1,960,682 | 1,906,597 | 1,905,147 | 1,847,993 | 1,821,620 | 1,826,224 | -0.3 | 7.4 |
| Transportation and warehousing | 1,250,881 | 1,102,255 | 1,059,040 | 1,038,293 | 1,021,217 | 1,002,056 | 21 | 24.8 |
| Information | 331,061 | 326,526 | 327,795 | 317,803 | 311,127 | 306,143 | 17.9 | 8.1 |
| Finance and insurance | 715,767 | 706,394 | 720,598 | 713,727 | 716,815 | 733,669 | 5.5 | -2.4 |
| Real estate and rental and leasing | 2,543,791 | 2,448,282 | 2,389,906 | 2,345,766 | 2,343,136 | 2,372,879 | 4.1 | 7.2 |
| Professional, scientific, and technical services | 3,363,252 | 3,235,906 | 3,212,202 | 3,163,966 | 3,121,404 | 3,066,934 | 14.4 | 9.7 |
| Administrative and support and waste management and remediation services | 2,075,368 | 2,032,516 | 2,006,177 | 1,985,237 | 1,937,326 | 1,864,703 | 41.2 | 11.3 |
| Educational services | 677,143 | 616,952 | 603,455 | 578,148 | 567,274 | 560,607 | 47.5 | 20.8 |
| Health care and social assistance | 1,986,042 | 1,959,723 | 1,943,028 | 1,968,099 | 1,934,831 | 1,869,681 | 17.4 | 6.2 |
| Arts, entertainment, and recreation | 1,311,429 | 1,256,694 | 1,236,539 | 1,188,143 | 1,154,020 | 1,123,989 | 26.3 | 16.7 |
| Accommodation and food services | 364,001 | 346,280 | 340,770 | 340,845 | 328,796 | 313,971 | 18.8 | 15.9 |
| Other services (except public administration) | 3,680,189 | 3,583,742 | 3,522,878 | 3,516,906 | 3,357,743 | 3,148,932 | 13.9 | 16.9 |
Source: United States Census Bureau, “Nonemployer Statistics,” U.S. Department of Commerce, 1997-2014, http://www.census.gov/econ/nonemployer/download.htm.
Over the same time period, nearly $192 billion was added in additional receipts for non-employers, which translates to a 21 percent increase from 2009 to 2014. Tepid growth could be found in heavily regulated industries like finance and insurance, and health care and social assistance, while transportation and warehousing grew by over 50 percent.
| Table 18: Non-employer Receipts by Industry | ||||||||
| 2014 Receipts ($1,000) | 2013 Receipts ($1,000) | 2012 Receipts ($1,000) | 2011 Receipts ($1,000) | 2010 Receipts ($1,000) | 2009 Receipts ($1,000) | Average Annual Percent Change 2003 – 2008 | Average Annual Percent Change 2009 – 2014 | |
| Total for all sectors | 1,115,921,379 | 1,052,025,268 | 1,030,932,886 | 989,628,512 | 950,813,840 | 923,018,039 | 16 | 20.9 |
| Agriculture, forestry, fishing and hunting | 11,205,657 | 10,937,201 | 10,613,759 | 10,258,802 | 10,115,355 | 9,009,698 | 13.9 | 24.4 |
| Mining, quarrying, and oil and gas extraction | 8,069,955 | 7,699,360 | 7,820,264 | 7,623,294 | 6,922,791 | 6,138,745 | 84.9 | 31.5 |
| Utilities | 966,556 | 878,870 | 786,823 | 736,626 | 697,528 | 707,583 | 26.5 | 36.6 |
| Construction | 141,799,960 | 132,282,411 | 127,049,119 | 122,633,298 | 120,150,896 | 121,298,344 | 13.8 | 16.9 |
| Manufacturing | 17,131,665 | 16,247,004 | 16,164,062 | 15,472,440 | 14,571,621 | 13,811,284 | 11.3 | 24 |
| Wholesale trade | 38,157,430 | 36,814,965 | 37,187,323 | 36,220,984 | 34,082,418 | 32,825,333 | 13.2 | 16.2 |
| Retail trade | 85,166,180 | 82,476,313 | 82,494,176 | 79,730,576 | 75,719,636 | 74,432,867 | 4.3 | 14.4 |
| Transportation and warehousing | 81,850,553 | 72,487,761 | 69,902,217 | 66,390,395 | 60,746,245 | 54,453,065 | 49.1 | 50.3 |
| Information | 12,584,570 | 11,945,232 | 11,784,901 | 11,323,383 | 10,739,102 | 10,249,651 | 29.8 | 22.8 |
| Finance and insurance | 54,742,426 | 51,506,073 | 52,045,924 | 50,311,687 | 50,626,266 | 51,578,908 | 19.2 | 6.1 |
| Real estate and rental and leasing | 247,884,410 | 237,171,809 | 227,427,897 | 215,428,132 | 209,549,445 | 208,306,182 | -7.2 | 19 |
| Professional, scientific, and technical services | 153,886,552 | 143,066,789 | 142,974,538 | 136,701,902 | 130,613,013 | 123,436,546 | 27.8 | 24.7 |
| Administrative and support and waste management and remediation services | 45,389,544 | 42,969,163 | 42,443,032 | 40,887,001 | 39,110,676 | 37,428,950 | 39.9 | 21.3 |
| Educational services | 9,354,856 | 8,686,538 | 8,504,722 | 8,048,744 | 7,702,746 | 7,334,977 | 51.3 | 27.5 |
| Health care and social assistance | 62,403,175 | 59,903,352 | 59,887,058 | 59,111,121 | 57,686,231 | 56,077,807 | 27.2 | 11.3 |
| Arts, entertainment, and recreation | 33,307,788 | 30,891,954 | 30,281,203 | 28,194,224 | 26,755,943 | 25,622,829 | 32.5 | 30 |
| Accommodation and food services | 16,197,028 | 15,306,070 | 15,021,102 | 14,862,828 | 14,354,581 | 14,015,112 | 5.4 | 15.6 |
| Other services (except public administration) | 95,823,074 | 90,754,403 | 88,544,766 | 85,693,075 | 80,669,347 | 76,290,158 | 24 | 25.6 |
Source: United States Census Bureau, “Nonemployer Statistics,” U.S. Department of Commerce, 1997-2014, http://www.census.gov/econ/nonemployer/download.htm.
Ridesharing
The growth in companies like Lyft and Uber coincides with significant gains in taxi and limousine service non-employer businesses, suggesting that these companies have likely driven non-employer establishment growth. From 2002 to 2008, the number of new taxi and limousine companies increased at an average rate of 4.3 percent per year. After Uber was established in 2009, the average annual growth rate in taxi and limousine companies jumped to 10.5 percent from 2009 to 2014.
The total receipts in taxi and limousine non-employer firms from 2002 to 2008 increased at an average annual rate of 8.3 percent, but have accelerated since then. From 2009 to 2014, yearly increases averaged 9.6 percent, with receipts growing 9 percent in 2012, 11 percent in 2013, and 17.8 percent in 2014.
Ridesharing companies have effectively lowered barriers to enter the taxi industry, leading to new market participants, more opportunity, and significant economic activity. For instance, in 2014 taxi and limousine non-employer receipts were about $573 million higher than they would have been had the pre-ridesharing growth trends from 2002 to 2008 continued to today. Similarly, there were 81,286 more establishments in 2014 than what would have happened had growth trends continued from the previous period. If the accelerated growth is wholly the result of ridesharing companies, then they helped to create 65 percent of these new jobs since 2009.
These non-employer establishment trends vary by metropolitan area and reveal a striking picture. The taxi and limousine industry in New York City had a 1.5 percent non-employer establishment growth rate the year before Uber entered into the market, which was followed by an average growth of 7.4 percent every year after.
After Uber established itself in Boston, the yearly average increase in establishments grew from 3.7 percent to 27 percent. Using 2009 as a baseline and calculating the annual average change both before and after a market had been opened, the total average annual increases in establishments and receipts were 7.7 percent and 9.4 percent respectively in metropolitan areas before a market had the ridesharing service. Afterwards in the markets where Uber had been established, those numbers increased to an average annual 39.3 increase in establishments and 20.4 percent increase in receipts. Below is a table charting the yearly average increase for all of the cities in which Uber had a presence by 2013.
| Table 19: Average Yearly Increases in Establishments and Receipts from Before and After Uber’s Entry | |||||
| Metro | Year of Uber Entry | Establishments
Before Uber (In Percent) |
Receipts Before Uber (In Percent) | Establishments After Uber (In Percent) | Receipts After Uber (In Percent) |
| San Jose-San Francisco-Oakland, CA CSA | 2010 | * | * | 34 | 27.8 |
| New York-Newark, NY-NJ-CT-PA CSA | 2011 | 1.5 | 7.2 | 7.4 | 9.8 |
| Boston-Worcester-Providence, MA-RI-NH-CT CSA | 2012 | 3.7 | 12.9 | 27 | 13.8 |
| Chicago-Naperville, IL-IN-WI CSA | 2012 | 6.8 | 10.8 | 16.2 | 15.3 |
| Los Angeles-Long Beach, CA CSA | 2012 | 12.3 | 14.5 | 39.8 | 23.6 |
| Philadelphia-Reading-Camden, PA-NJ-DE-MD CSA | 2012 | 5.9 | 14.2 | 13.9 | 13.3 |
| Seattle-Tacoma, WA CSA | 2012 | 6.8 | 11.7 | 26.6 | 20.5 |
| Washington-Baltimore-Arlington, DC-MD-VA-WV-PA CSA | 2012 | 7.7 | 7.7 | 18.7 | 15 |
| Atlanta–Athens-Clarke County–Sandy Springs, GA CSA | 2013 | 5.4 | 8.7 | 28.8 | 19.6 |
| Charlotte-Concord, NC-SC CSA | 2013 | 5.5 | 11.9 | 30.4 | 22.1 |
| Dallas-Fort Worth, TX-OK CSA | 2013 | 6.0 | 11 | 35.4 | 28.4 |
| Denver-Aurora, CO CSA | 2013 | 14.4 | 15.9 | 37.1 | 22.2 |
| Indianapolis-Carmel-Muncie, IN CSA | 2013 | 13.1 | 14.7 | 27.5 | 11.8 |
| Minneapolis-St. Paul, MN-WI CSA | 2013 | 7.7 | 10 | 24.2 | 19.6 |
| Sacramento-Roseville, CA CSA | 2013 | 7.9 | 9.8 | 39.5 | 23.5 |
Source: United States Census Bureau, “Nonemployer Statistics,” U.S. Department of Commerce, 1997-2014, http://www.census.gov/econ/nonemployer/download.htm.
* 2009 is used as a baseline, so San Francisco doesn’t have a yearly average from before Uber’s entry
Roomsharing
The rideshare industry is not the only part of the online gig economy to see rises in usage. Before the rise of on demand ridesharing, VBRO and others invited regular people to rent out their property as alternative living arrangements for vacationers. However, it was not until Airbnb was founded in late 2008 that the industry became more widely known. From 2009 until 2014, the number of new establishment filings in the rooming and boarding subsector grew by a total of 25 percent, substantially faster than the 10 percent increase from 2003 to 2008. Similarly, receipts totals increased 30 percent during the time period from 2009 to 2014, up from the 21 percent during 2003 to 2008.
Conclusion
As policymakers consider changes to employment classification and consider policy options for the gig economy, it is important first that the nature of the gig economy, how workers fit into it, and their demographic characteristics are understood. This paper contributes to the nascent research literature on the gig economy and makes modest suggestions for future research.
[1] Lawrence F. Katz & Alan B. Krueger, “The Rise and Nature of Alternative Work Arrangements in the United States, 1995-2015,” NBER Working Paper No. 22667, September 2016, http://www.nber.org/papers/w22667?utm_campaign=ntw&utm_medium=email&utm_source=ntw
[2] Will Rinehart & Ben Gitis, “Independent Contractors and the Emerging Gig Economy,” American Action Forum, July 2015, https://www.americanactionforum.org/research/independent-contractors-and-the-emerging-gig-economy/.
[3] NORC at the University of Chicago, “General Social Survey,” University of Chicago, http://gss.norc.org/get-the-data.
[4] These figures are slightly revised from our previous paper due to data revisions.
[5] The full-time and part-time percentages may not add up to 100 percent because some respondents in the GSS survey did not indicate their full-time/part-time status.
[6] Due to GSS survey methodology, the “Other” race does not include Hispanic ethnicity.
[7] Zoltan J. Acs, Brian Headd, & Hezekiah Agwara, “Nonemployer Start-up Puzzle,” Small Business Administration, Office of Advocacy, December 2009, https://www.sba.gov/sites/default/files/Non-employer%20Start-up%20Puzzle.pdf.
[8] Brian Soloman, “The Numbers Behind Uber’s Exploding Driver Force,” Forbes.com, May 2015,
[9]Etsy, “Building an Etsy Economy: The New Face of Creative Entrepreneurship,” Etsy, July 2015, https://extfiles.etsy.com/Press/reports/Etsy_NewFaceofCreativeEntrepreneurship_2015.pdf.