Research
January 25, 2024
Health & Economy Medicare Market Choice Estimates
![]()
The Center for Health and Economy (H&E) is dedicated to assessing the impact of proposed reforms to the entire health insurance market. In this report, we simulate a Market Choice reform that offers seniors the choice between a reformed fee-for-service (FFS) option and Medicare Advantage, in combination with Medigap and Part D coverage. The following details the H&E report of this Market Choice approach with a focus on Medicare insurance choices, federal budgetary impact, and the premium landscape of health insurance for Americans over the age of 65. The estimates are compared to the Medicare program as it exists today under current law.
KEY FINDINGS:
- The Medicare market includes an estimated 62 million U.S. residents in 2023, half of whom must make an active choice among combinations of Medicare Advantage, Part D (pharmacy benefit), and private Medigap plans; among the active choosers, 14.2 million selected Medicare Advantage combined with a pharmacy benefit.
- The total size of the Medicare market is estimated to increase throughout the budget window, growing to 78 million in 2033. Market Choice will not affect these population estimates since the enrolled population will remain the same.
- There will be a significant shift between the Medicare FFS to Medicare Advantage of 2.7 million in 2025 and 3.0 million by 2033. The greatest shift will occur from the Medicare FFS, Part D, and supplemental plan choice.
- The Market Choice policy will result in significant saving of nearly $1 trillion over 10 years if implemented from 2023 to 2033. The 2033 annual estimated savings to the federal budget is $74 billion.
- The per capita cost of the of the Medicare program will be reduced under Market Choice by about $1,000 per person, primarily through a reduction in expenses on Medicare FFS.
- The premiums paid by seniors will be significantly higher under Market Choice for the FFS population, with additional premiums ranging from $271 to $446 over the 10-year period of time. This accounts for the higher cost of pricing Medicare FFS as a choice based on its current cost. Medicare Advantage has the lowest premium ranging from $214 to $351 per month from 2023 to 2033.
MEDICARE MARKET CHOICE POLICY
Market solutions for Medicare have been a Medicare reform proposal concept for well over a decade. Broadly, market reform policies involve providing beneficiaries with a fixed amount of money, often in the form of a voucher or subsidy, to help them purchase private health insurance. This is in contrast to the current Medicare structure, which is a government-run program, albeit with the option of purchasing Medicare Advantage plans, which are managed by private health insurance firms with Medicare program oversight.
The central tenet of Medicare market reform is that by introducing competition among private insurers, premiums may more accurately reflect costs and quality of care. For this Medicare Market Choice microsimulation, we do not simulate a Medicare voucher for all health reform options. Rather, we simulate Medicare FFS, the default Medicare option, priced as a separate Medicare choice with a market-based premium based on current Medicare FFS expenditures. This market priced Medicare FFS option would then compete with Medicare Advantage.
The Medicare Advantage Stars program ranks Medicare Advantage plans on the basis of a variety of quality metrics, permitting beneficiaries to identify higher-value plans. To make this competition balanced, we introduce a quality metric in Medicare FFS comparable to the Medicare Advantage Stars program.
In addition, we allow additional versions of market priced Medicare FFS where Part D prescription drug coverage and Medigap supplemental coverage can be added.
We make several simplifying assumptions about what such a program would look like. In the current scenario, all Medicare Advantage plans are provided with a subsidy equal to the 25th percentile of bids by Medicare Advantage firms in a particular county, rather than a benchmark rate determined by the Medicare FFS population. Medicare FFS enrollees are also charged an additional premium that is equal to the difference between the average cost of Medicare FFS and the 25th percentile of Medicare Advantage bids.
The effects of this policy are twofold. First, Medicare expenses fall, partially due to greater premiums paid by enrollees. Second, the relative price of different potential insurance options changes, which affects how consumers will sort among those available options. The following report explores these effects in detail.
For illustration, the MARCOLA simulation presented assumes an instantaneous switch between current law and the proposed policy reform starting in 2023 and remaining in effect through 2033. Of course, we recognize such a substantive reform will take years to implement. Even if it were to pass in 2025, it could not be implemented until 2027 at the very earliest based on prior health reform initiatives, including the 2003 Medicare Modernization Act and the 2010 Affordable Care Act, each of which had at least two implementation periods.
INSURANCE COVERAGE
H&E estimates there are 62 million U.S. residents with Medicare insurance coverage in 2023. Table 1 provides a 10-year estimate of Medicare Market Choice enrollment. Within the Medicare population, H&E’s microsimulation separates two major populations. The first population is directly affected by consumer choices for Medicare Advantage, Part D, or supplemental Medicare policies (i.e., Medigap). The second population consists of consumer groups with eligibility-specific incentives that may affect their choices in ways that H&E’s microsimulation does not currently capture. It includes the Medicaid eligible population (i.e., dual eligible), the Medicare disabled and end-stage renal disease (ESRD) populations, and Medicare recipients that receive employer-sponsored retirement benefits. The first population constitutes half of the Medicare market, with 31 million beneficiaries in 2023. The second population is not modeled in microsimulation estimates. Instead, we use national account data from the Centers for Medicare and Medicaid Services (CMS) and the Census to project these beneficiaries’ Medicare enrollment. This second group also includes individuals under the age of 65 who are disabled or using the ESRD benefit. The overall size of the second population is approximately 31 million in 2023.
Within the active-choice first group of Medicare beneficiaries, there are five product groups, representing combinations of FFS, Medigap, Part D pharmacy benefit, and Medicare Advantage. The most popular product group is Medicare Advantage and Part D with 14.8 million beneficiaries. This group will increase to 21.2 million by 2033. The FFS and Part D product group will grow by 0.8 million from 2023 to 2033. Also, the FFS-only group grows from 3.6 million beneficiaries in 2023 to 4.8 million in 2033. The FFS and Medigap, FFS only, Part D and Medigap product groups will decrease by a little over 1 million combined by 2033.
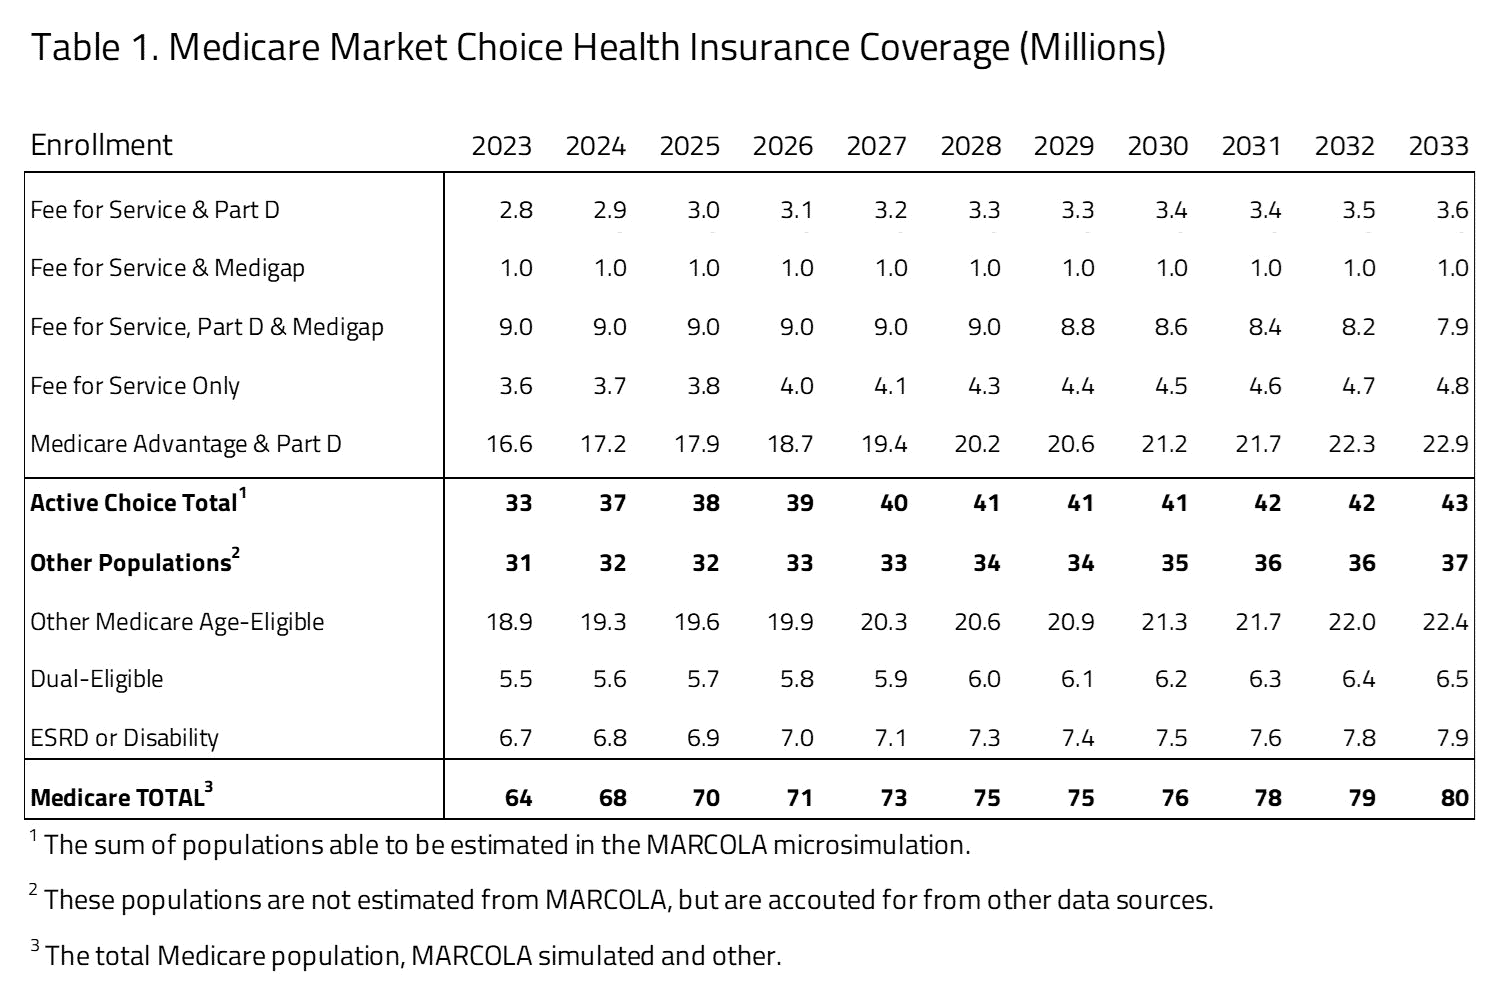
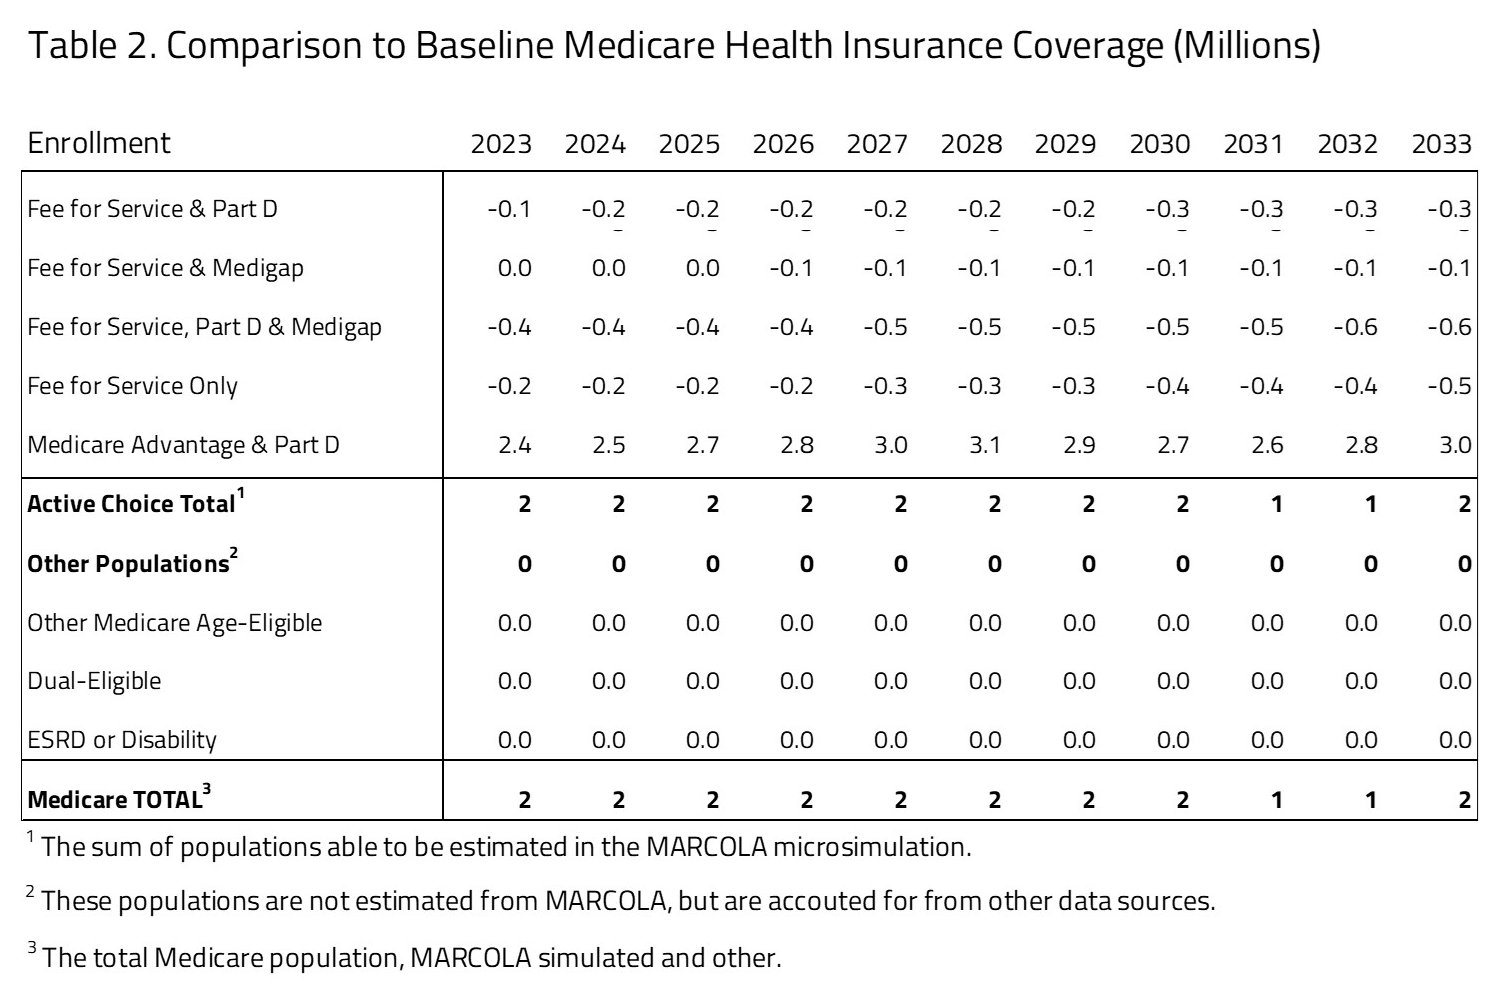
Table 2 provides the impact on enrollment between the Medicare Market Choice proposal and status quo Medicare program. The status quo comparison is based on the H&E MARCOLA baseline estimate published in November 2023. There will be a shift from Medicare FFS to Medicare Advantage of 2.4 million in 2025 and 3.0 million by 2033. The greatest shift will occur from the Medicare FFS, Part D, and supplemental plan choice with a substantial reduction in population by 2033 of 0.6 million, most of whom are absorbed by an expansion in the Medicare Advantage population. Because Medicare coverage is mandatory, we assume that the net effect on total insurance coverage is zero.
BUDGET
H&E estimates the impact on the federal budget of the major health insurance coverage provisions of current law with regard to the Medicare population. Budget impact estimates do not include estimates for Medicare expenditures not directly related to care, such as Graduate Medical Education or other program costs related to Center for Medicare and Medicaid Innovation demonstration expenditures.
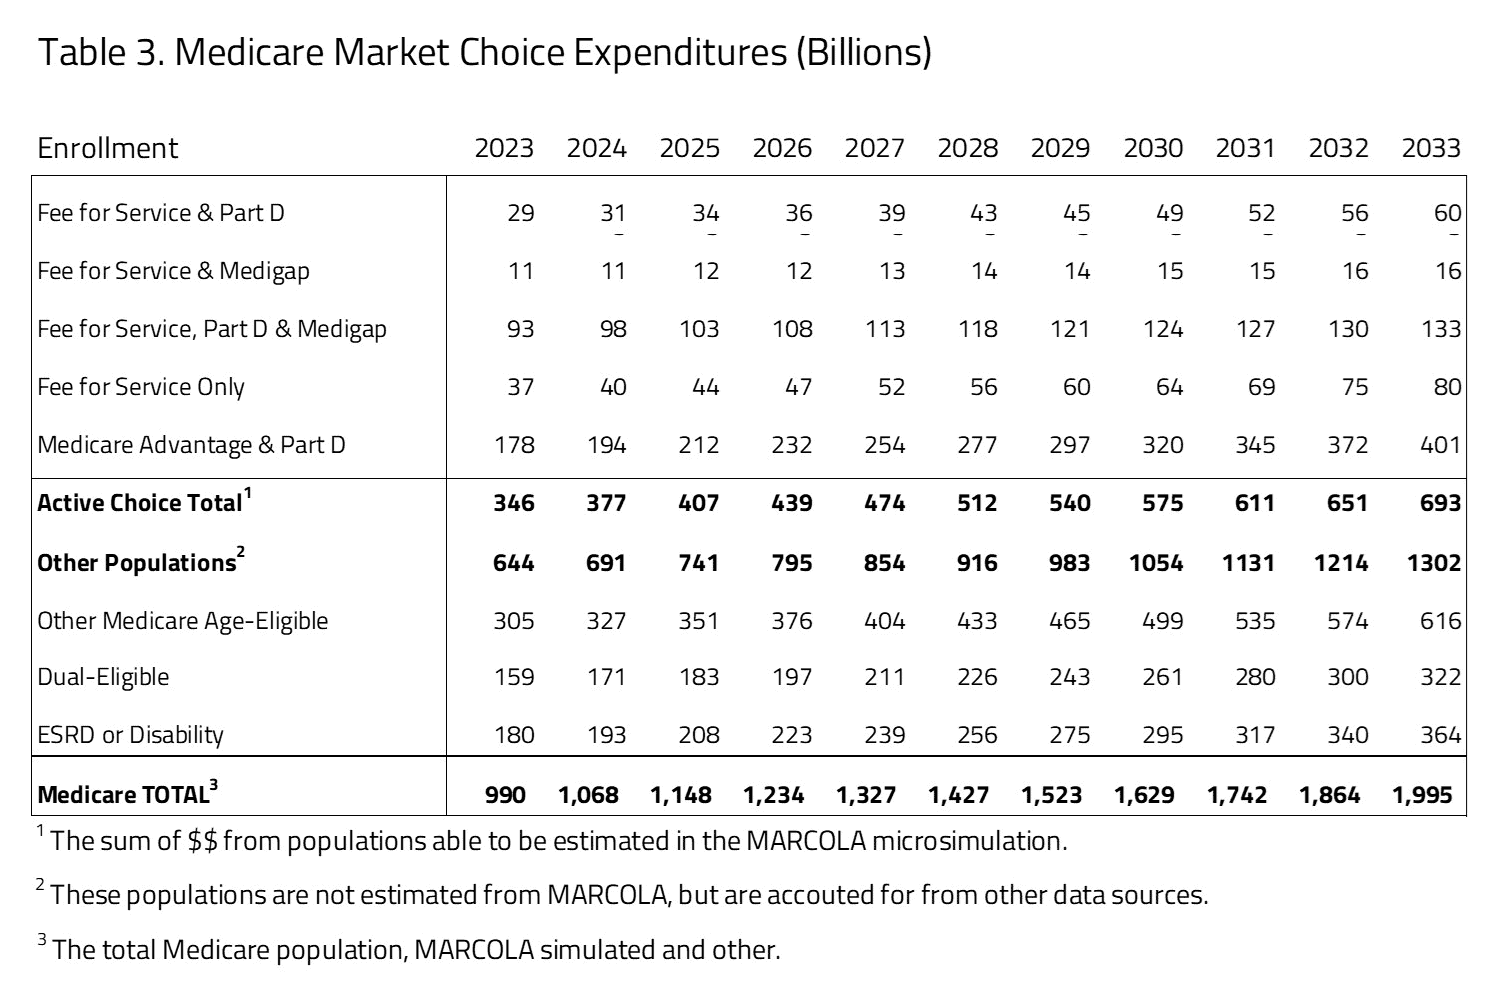
Ten-year Medicare projected expenditures are presented in Table 3. Over the decade spanning between 2023 and 2033, H&E estimates that elderly coverage provisions under Medicare Market Choice will cost $15.9 trillion. Medicare costs associated with the first population of Medicare active choice consumers have an expenditure of $346 billion in 2023 that will grow to $693 billion in 2033. The largest product within this group is the Medicare Advantage population with expenditures growing from $178 billion in 2023 to $401 billion by 2033. The non-active choice, second group has a total expenditure of $644 billion in 2023 that will grow to $1.3 trillion by 2033.
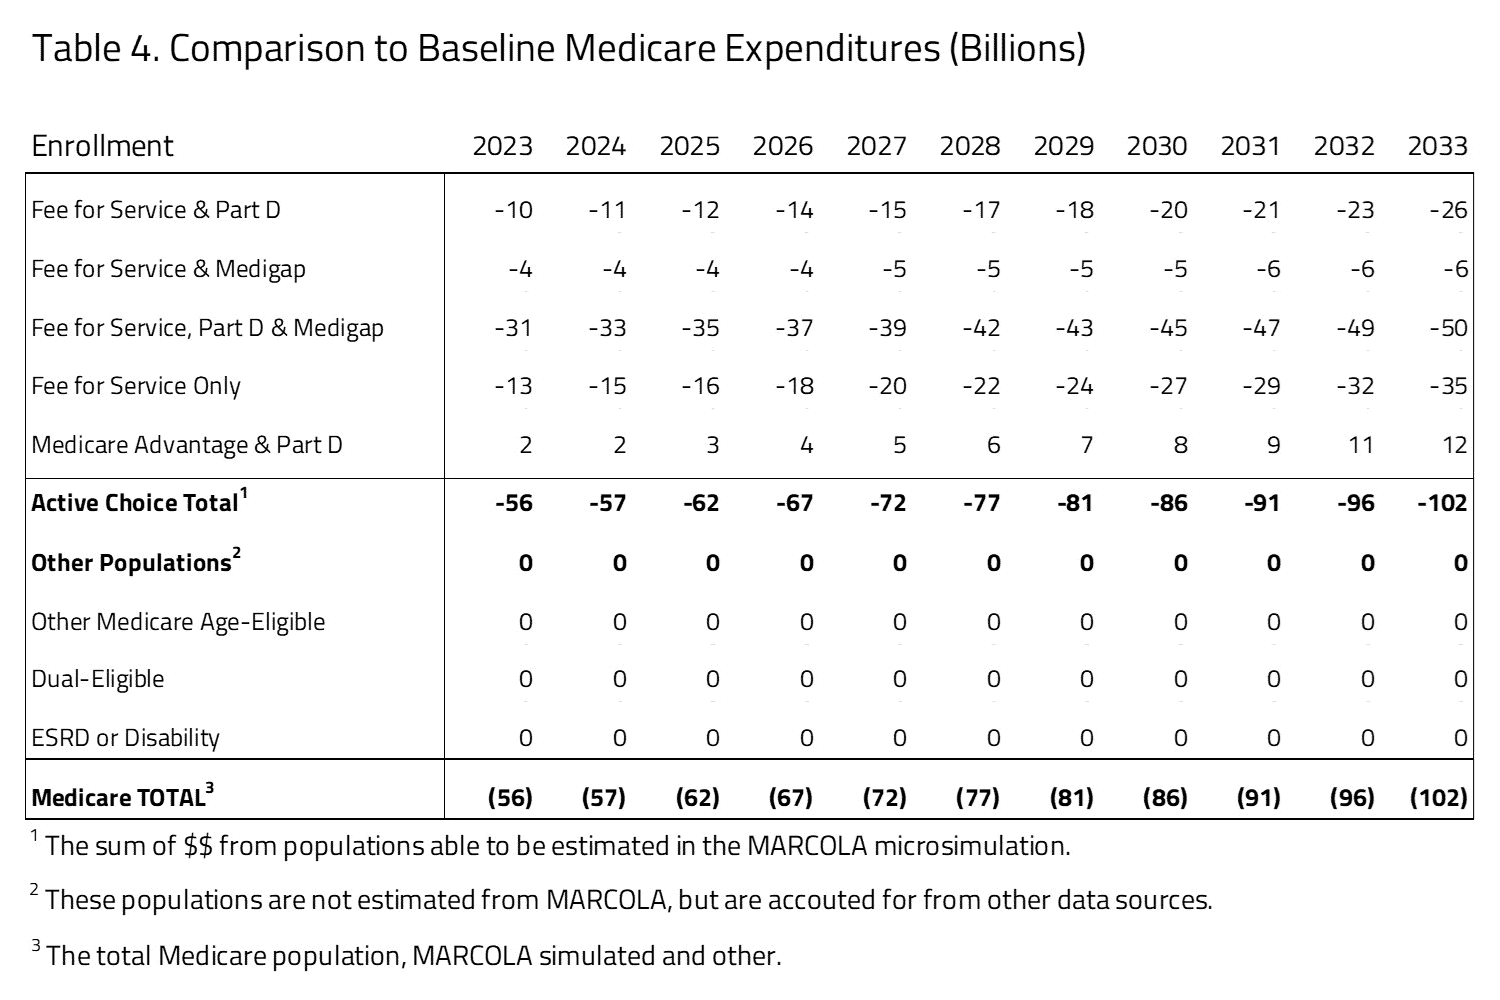
As seen in Table 4, the Market Choice policy will result in significant saving of nearly $1 trillion over 10 years if implemented from 2023 to 2033. The 2033 annual estimated savings to the federal budget is $102 billion.
PER-CAPITA EXPEDITURES
Using the projected Medicare beneficiary population size and expenditure, H&E estimates the per-capita cost of each Medicare program category for the Market Choice policy. As seen in Table 5, within the active-choice Medicare consumer choice group there is little variation among the subgroups. The one significant difference is in the Medicare Advantage and Part D subgroup, where the average per-beneficiary cost is $12,000 in 2023, compared to the other groups’ $10,000 average cost. This difference is maintained throughout the budget window with costs for Medicare Advantage and Part D averaging $19,000 by 2033 and the other subgroup, including all the FFS choices, having higher average per-beneficiary costs of $17,000 in 2033.
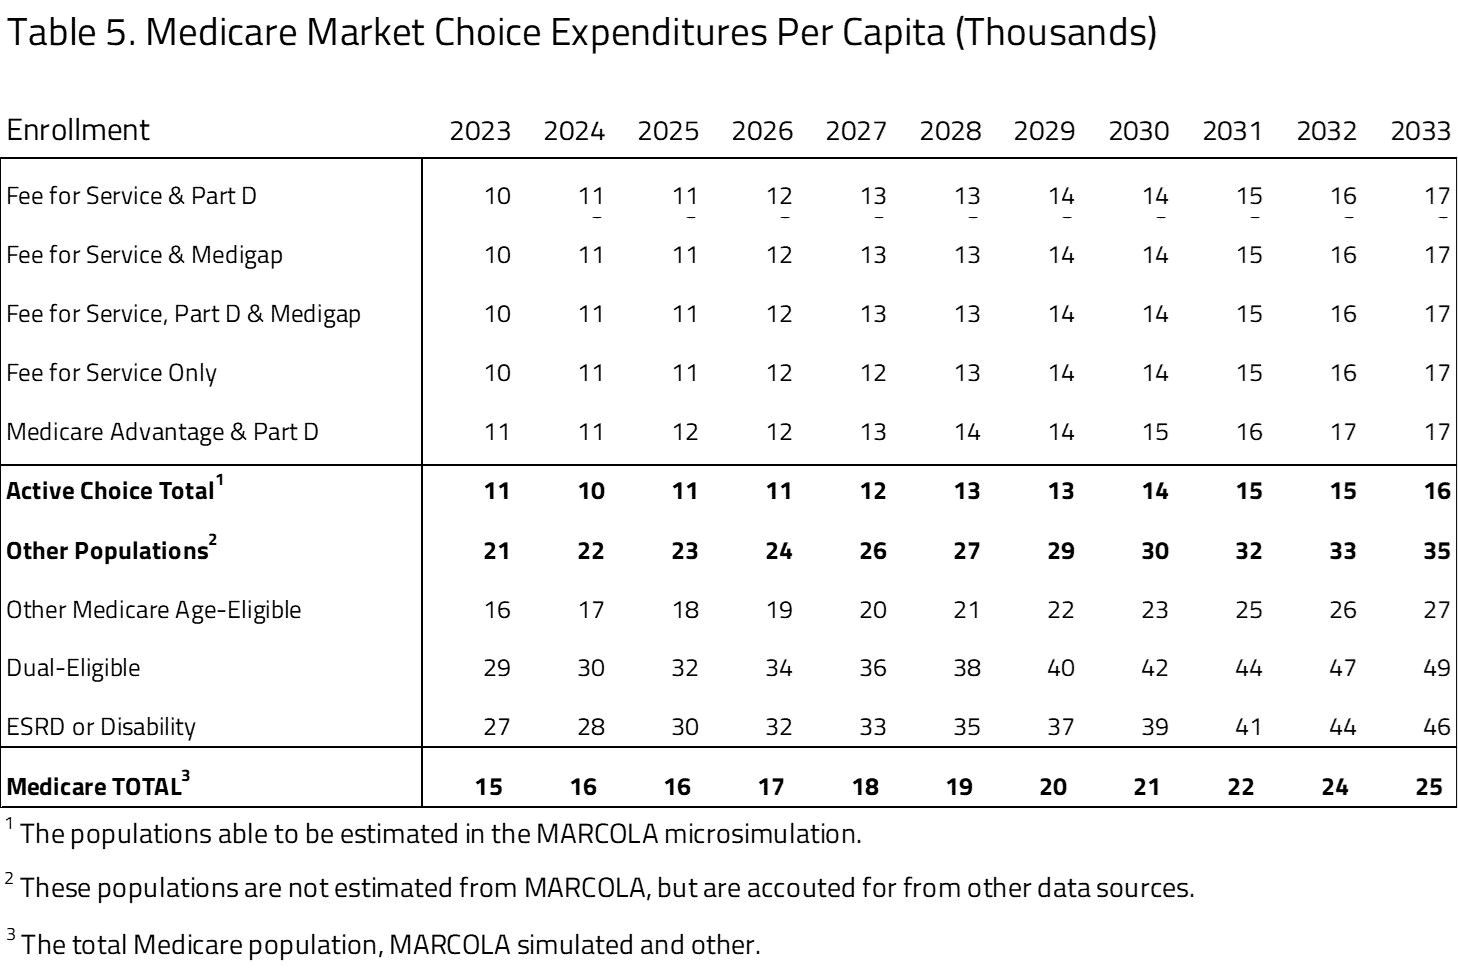
The second group of Medicare beneficiaries, projected but not active choice, has significantly higher per-capita costs. The largest per-capita cost within this subgroup is the dual-eligible population, followed by the ESRD and disabled population, with 2023 per-capita costs of $29,000 and $27,000, respectively. The other Medicare age-eligible group is most similar to the group with Medicare choices, with lower subgroup costs of $16,000 in 2023. Notably, we do not apply the reductions in subsidies and premium increases in Medicare FFS to these other groups.
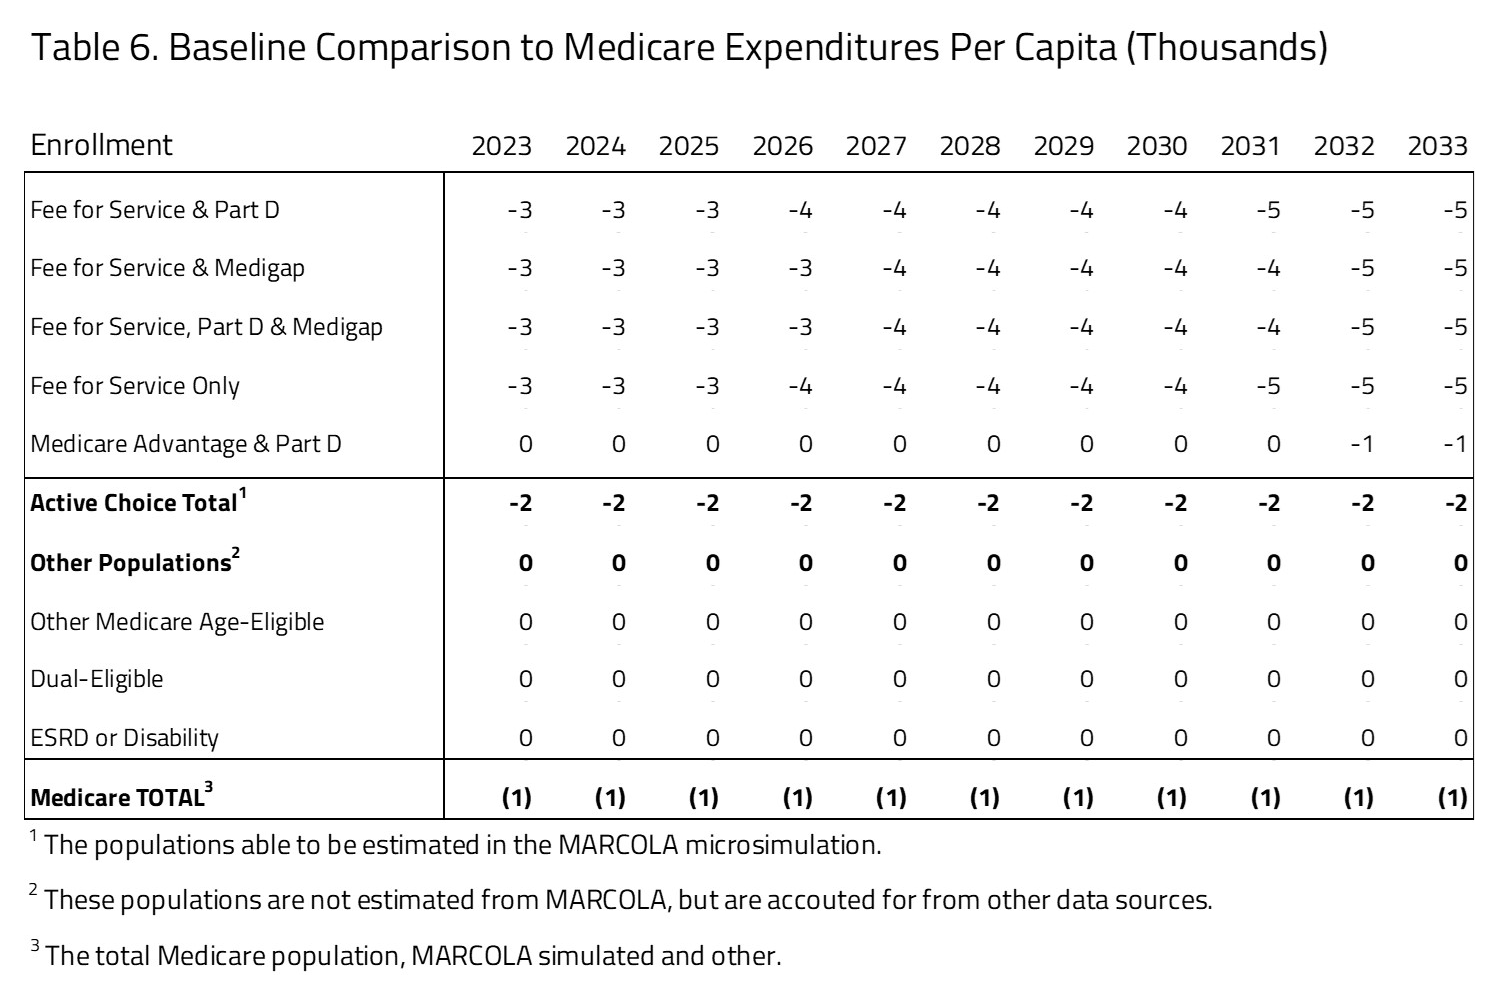
Table 6 presents what the per-capita differences would be compared to current law policy. The per-capita cost of the Medicare program will be reduced under Market Choice with an overall average cost of approximately $1,000.
MEDICARE PREMIUM ESTIMATES
In Table 7, H&E presents the Medicare premiums for the active choice consumers for the Market Choice policy. The five subgroups we have profiled represent those where the consumers will choose which plans they will participate in. This table does not include populations programs organized by an employer. The table also does not include populations that are disabled, enrolled in Medicaid, or participating in the ESRD program. The data sources for this information are a mix of public and private.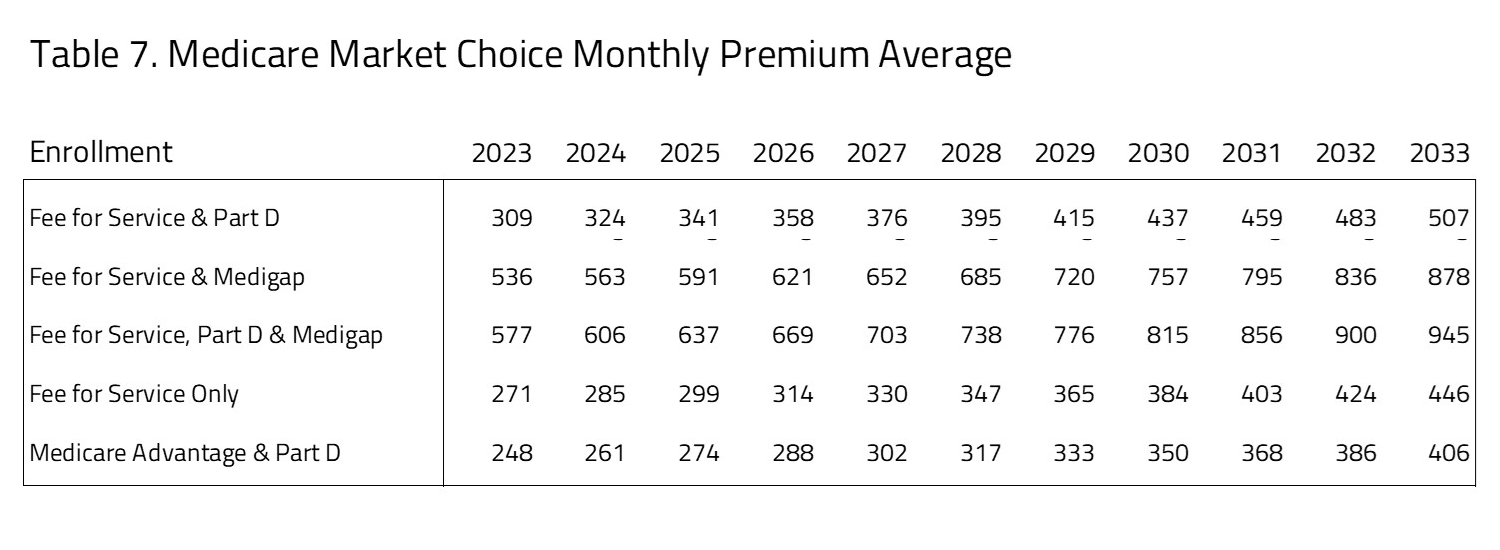
The premiums for FFS and Part B compared to Medicare Advantage and Part D are roughly comparable throughout the 10-year window. The least expensive of the Medicare plans with Part D coverage is the Medicare Advantage plus Part D plan. The most expensive of the options for consumers is FFS plus Part D and Medigap.
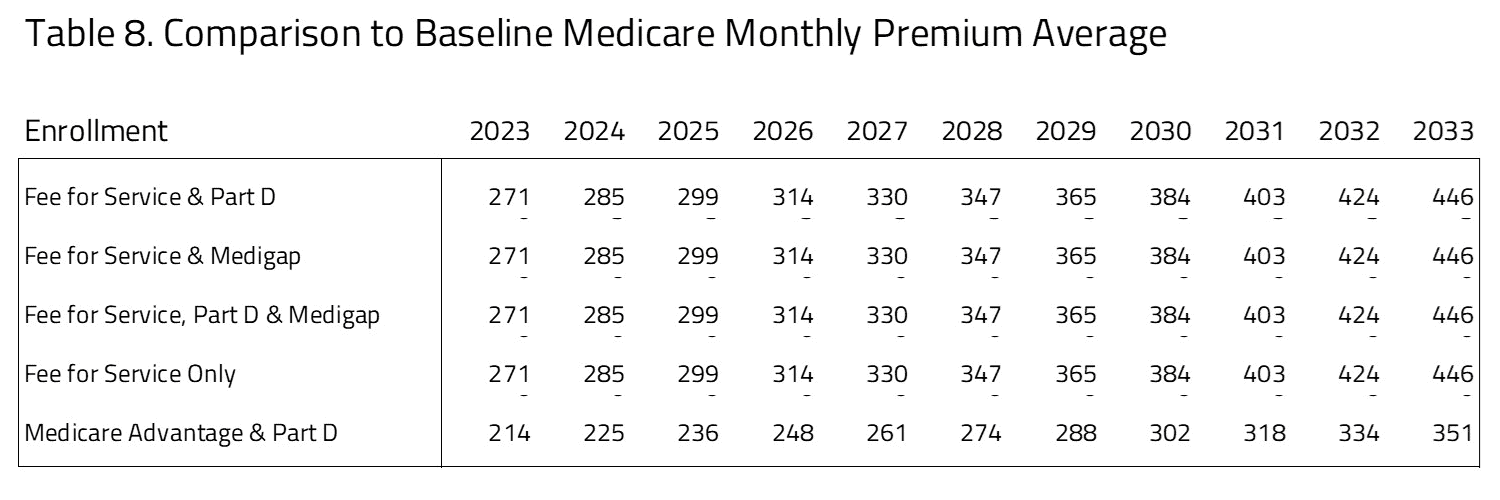 As seen in Table 8, there are significant premium differences between Medicare Market Choice policy compared to current law. The premiums paid by seniors will be significantly higher under Market Choice for the FFS population, with additional premiums ranging from $271 to $446 over the 10-year period. This accounts for the higher cost of pricing Medicare FFS as a choice based on its current cost. Medicare Advantage has the lowest premium ranging from $214 to $351 per month from 2023 to 2033.
SENSITIVITY TESTING FOR ALTERNATES
A key assumption of the modeling presented above is that Medicare Advantage firms will raise premiums in order to recoup the reduction in per-person subsidies. This is especially important given that, under current law, Medicare Advantage plans are given large rebates to provide extra benefits and services to consumers. One potential outcome under Market Choice is that Medicare Advantage firms will stop offering these extra benefits, and therefore will not raise their prices by quite as much. In one set of results, we assume that Medicare Advantage firms do not raise their prices to recoup the rebates and consumer demand for Medicare Advantage firms remains unaffected. This is an extreme assumption but provides some evidence about the range of outcomes.
In this scenario, the estimated premium for Medicare Advantage and Part D in 2025 decreases from the $236 estimated above to $92. Accordingly, Medicare Advantage enrollment increases to 21 million in 2025, much greater than the 17.9 million estimated above. We believe that the impact of such a policy will lie between these two estimates but will likely be closer to the results presented above.
UNCERTAINTY IN PROJECTIONS
H&E uses a peer-reviewed micro-simulation model of the health insurance market to analyze various aspects of the health care system. As with all economic forecasting, H&E estimates are associated with substantial uncertainty. While the estimates provide a good indication of the nation’s health care outlook, there is a wide range of possible scenarios that can result from policy changes, and current assumptions are unlikely to remain accurate over the course of the next 10 years.
THE MARCOLA MICROSIMULATION
This simulation builds on the ARCOLA simulation work done by H&E for the under-65 market and has been published externally since 2013. The primary objective of MARCOLA (Medicare ARCOLA) is to estimate future proposed changes to the Medicare program through a set of policy briefs to inform Congress and the executive branch.
This project entailed building micro-simulation models to address how many seniors will be affected with respect to their health plan choices and out-of-pocket expenses, as well as the cost to the federal government. The project involves estimating a comprehensive demand model for the Medicare population that accounts for all possible choices: Medicare only, Medicare with Part D drug coverage, private MA plans with and without drug coverage, and private supplementary insurance (“Medigap”) with and without Part D.
A novel attribute of the simulation is the MA plan bid from CMS and premium data from at least one large Medigap insurer. In addition, we utilize the most recent years of the Medicare Current Beneficiary Survey for estimation of the models and the Medicare National Claims History File data to establish baseline trends for health care cost projections.
We use a set of limited dependent variable estimation models to build a prediction engine, taking into consideration out-of-pocket plan premiums, other plan attributes, and beneficiary socio-economic attributes. This will permit the opportunity to vary premium and income effects to gauge effects on beneficiaries in the simulation model.
Additional information on the MARCOLA model and assumptions made can be requested from H&E.