Research
May 24, 2016
Higher Education Budget: An Overview of State-Level Expenditures for School Years (SY) 2010-11 to 2015-16
Summary
- State-level expenditures for higher education increased 3 percent over a six-year period from School Years (SY) 2010-2016.
- Over the same timeframe, tuition at both two-year and four-year public schools also increased an annual average of 3 percent.
- While many claim the rise in tuition is due to a decline in state funding, our research finds that regardless of state expenditures tuition tends to grow at an average of 3 percent a year.
Overview
One common assertion accounting for the continuous rise in college tuition is that state budget cuts for higher education are passed on to students in the form of increased tuition and fees. Indeed, policymakers and pundits often express concerns that declines in higher education budgets are making higher education unaffordable for low-income students and their families. Examining the previous six years of state-level expenditures for higher education, this analysis explores the relationship between funding levels and changes in tuition. We examine national trends as well as state-level data.
Findings
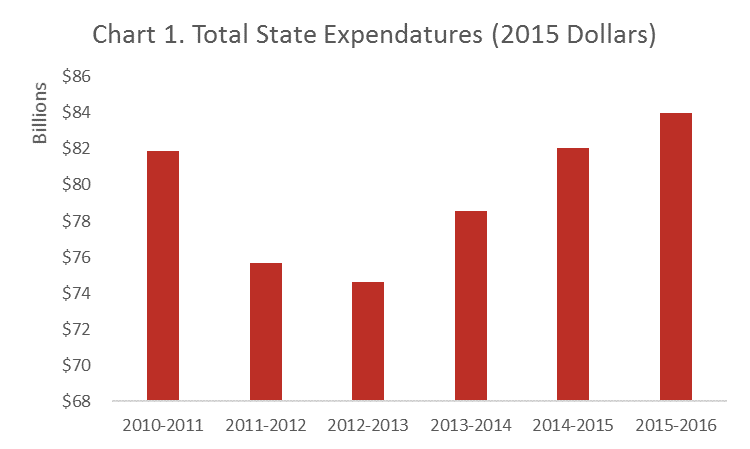
From 2010 to 2012, state fiscal support for higher education fell by nine percent. However, this trend was reversed in the following three years when state fiscal support began increasing.[1] [2] Overall, state expenditures increased three percent during the six-year timeframe. Chart 1 shows the trend of annual state expenditures between SY2010-11 and SY2015-16.
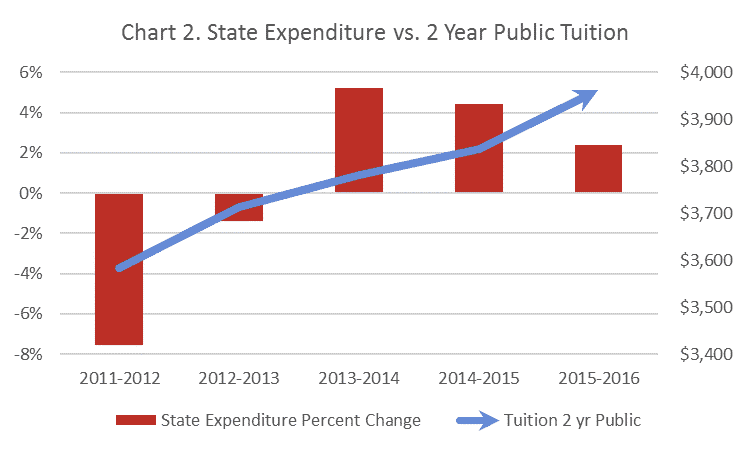
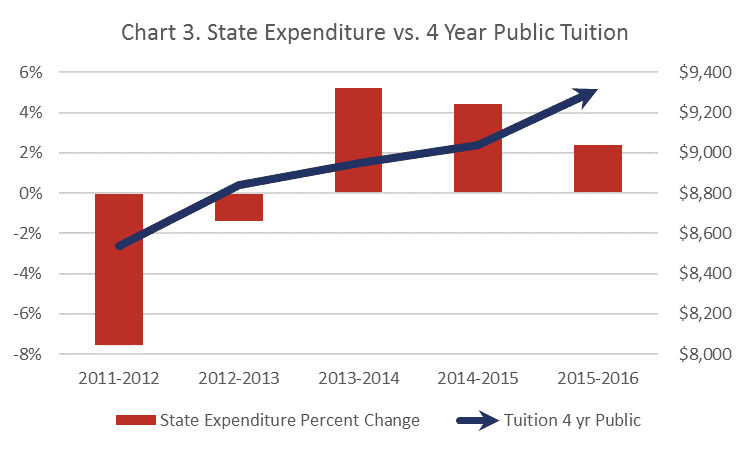
By comparison, over the same timeframe, national tuition at both two-year and four-year public schools increased annually at an average of three percent. Tuition at two-year schools grew from $3,473 to $3,962 and at four-year schools from $8,229 to $9,318.[3] And while the rate of tuition increase is greater in the years that showed sharp declines in state funding, tuition continues to climb despite three years of funding increases. Charts 2 and 3 show the comparison of the percent change of state expenditures versus the changes in tuition at public institutions of higher education.
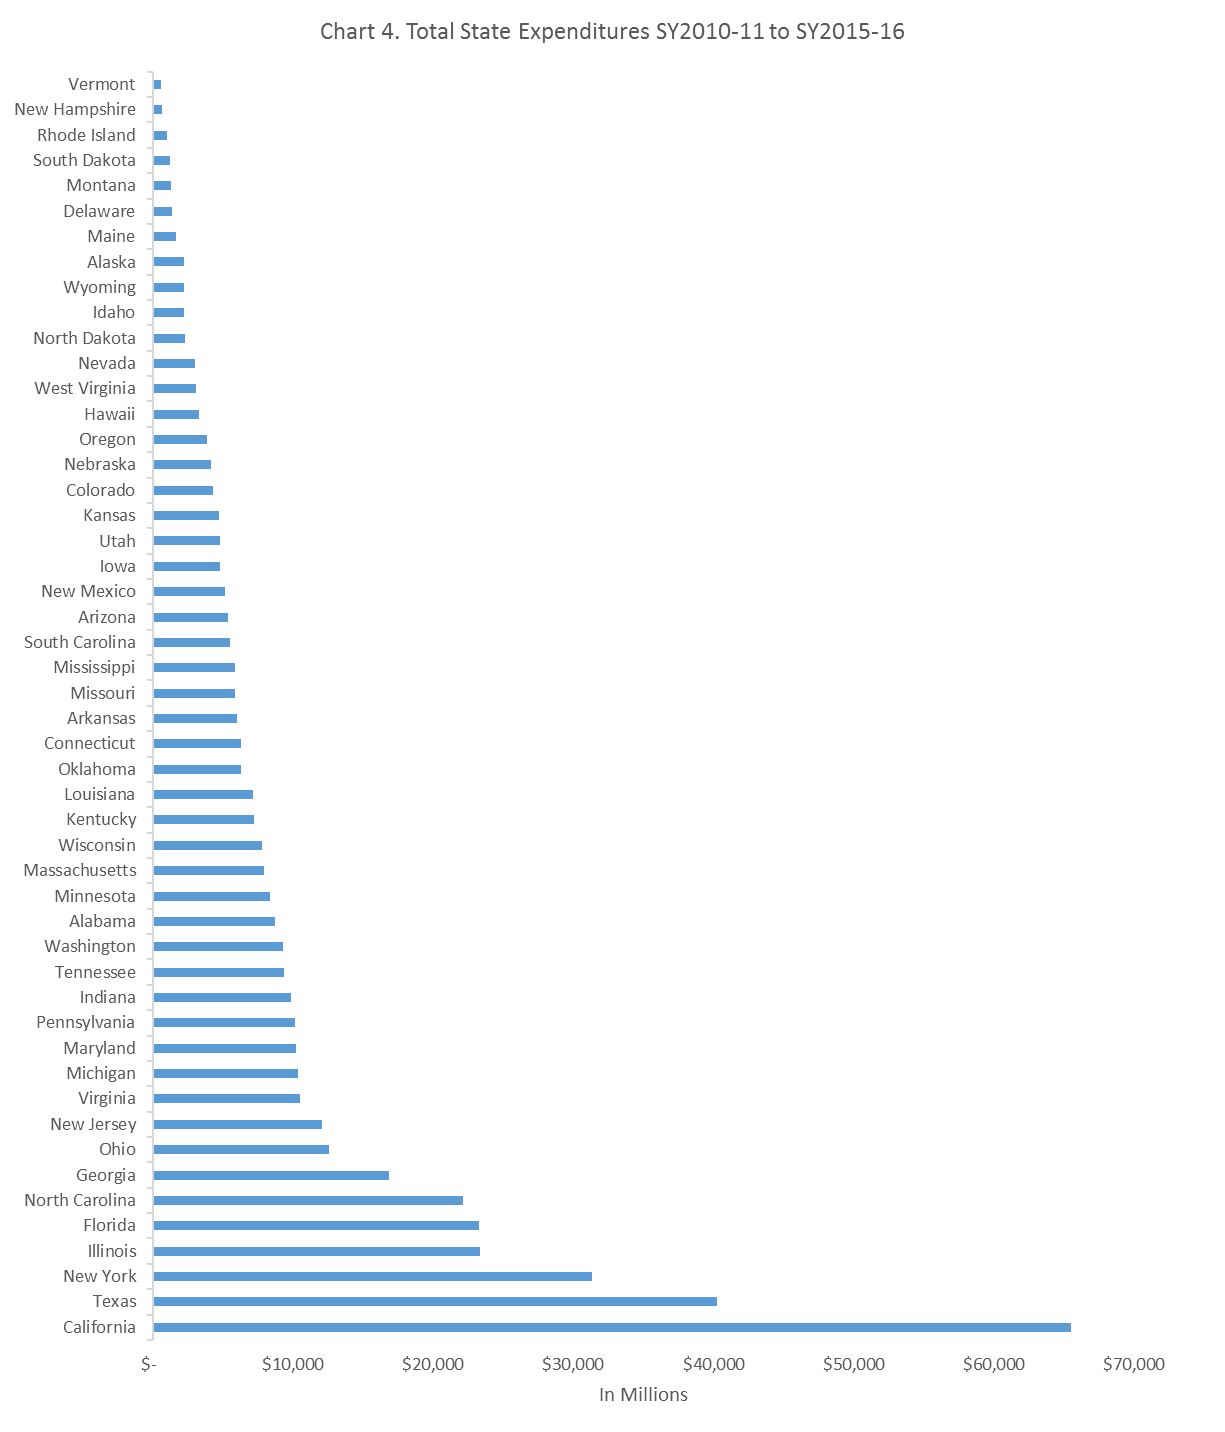
Over this six-year period the states spent nearly $463 billion to fund higher education; however, expenditures by individual states vary widely with California spending nearly $65.5 billion and Vermont spending nearly $550 million, in unadjusted dollars. These figures are shown in the following chart.
The following tables further demonstrate the trends of annual expenditures and changes in tuition for the five leaders and lagers in the nation.
Table 1 explores the six-year growth of expenditures and the correlating changes in public school tuition. Here we find that despite California’s $65 billion increased investment, tuition at two year schools increased nearly 59 percent. Meanwhile, New Hampshire had the second smallest six-year increase of $662 million and decreased tuition at two year schools by 5 percent. For four year public institutions, New York and North Carolina, both top five states in six year expenditures, saw an increase in tuition of 20 percent from SY2010-11 to SY2015-16.

Table 2 reflects the most recent one-year changes in expenditures and tuition. Similar to the results in table 1, tuition tends to increase with only two states, California and New Hampshire, seeing decreases in tuition for two-year public schools.

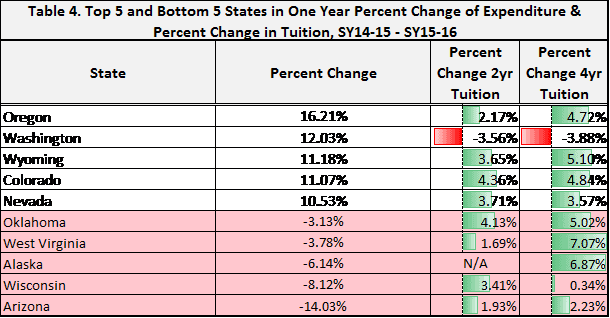
Tables 3 and 4 focus on the six-year percent change of state expenditures for higher education rather than the actual dollar amounts.
We find that Montana leads the cohort with a 45 percent change in funding, as shown in table 3. This translated to a 2 percent decrease in tuition at two-year schools and slightly more than a 3 percent increase for Montana’s four-year institutions. In Louisiana, one of only two states where tuition behaved in a manner that corresponds to the change in state expenditures, an 8 percent decrease in funding led to a 64 percent and 52 percent increase in two-year and four-year tuition, respectively.
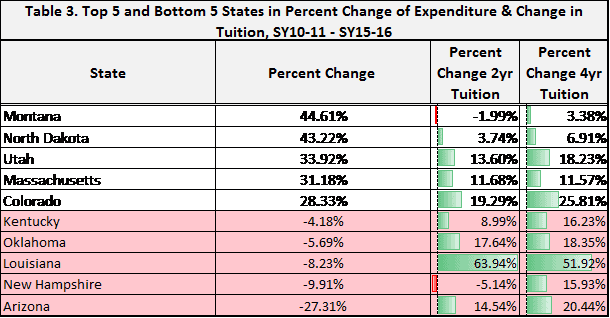
Table 4 reflects the most recent one-year percent change in state expenditures. Here we find the second state where tuition behaved in a manner that corresponds to the change in state expenditures. A 12 percent year over increase in state funding translated to nearly a 4 percent decrease for both two and four year public schools.
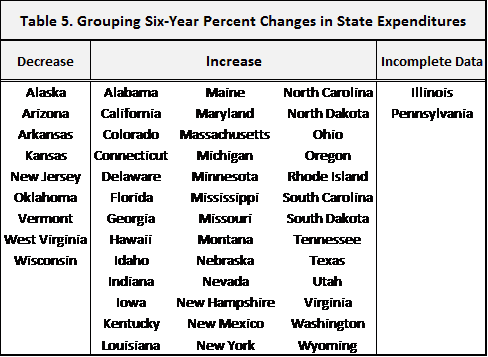
Finally, in table 5 we group all states based on six-year percent change in state funding levels finding only nine states that saw an overall decrease comparing SY2010-11 to SY2015-16.
Conclusion
From 2010 to 2012, community colleges and universities felt the sting of sharp decreases in in state-level funding for higher education. The cut and dry correlation between tuition hikes and state funding cuts isn’t demonstrated in the analysis. Instead we find that regardless of state expenditures tuition tends to grow at an average of 3 percent a year. This would suggest that other factors such as those that AAF previously examined explain the constant rise in college tuition.
[1] Grapevine | College of Education – Illinois State. education.illinoisstate.edu. N.p., 2016. Web. May 2016.
An Annual Compilation of Data on State Fiscal Support for Higher Education – A joint project of the Center for the Study of Education Policy at Illinois State University and the State Higher Education Executive Officers (SHEEO).
[2] The data reported here exclude FY16 figures for Illinois (which has not yet enacted a FY16 state budget) and Pennsylvania (where the FY16 budget remains incomplete.)
[3] Trends In College Pricing – Trends In Higher Education – The College Board. Trends.collegeboard.org. N.p., 2016. Web. May 2016.