Research
November 3, 2021
PRIMER: Agriculture Subsidies and Their Influence on the Composition of U.S. Food Supply and Consumption
Executive Summary
- The federal government has long subsidized America’s farmers, significantly affecting our food supply and what we eat.
- The most highly subsidized crops—corn, soy, wheat, and rice—are the most abundantly produced and most consumed, often in the form of ultra-processed foods.
- Sugar is also highly subsidized in the form of indirect price supports that benefit producers and drive-up prices, yet sugar is also widely overconsumed.
- Fruits and vegetables, on the other hand, receive relatively little subsidization—and Americans eat much less produce than recommended.
Introduction
The American food supply has been significantly influenced by federal agriculture policy and subsidies. Various payment and revenue supports have shaped what and how much American farmers grow. The most heavily subsidized and produced crops—corn, soy, and wheat—are key ingredients in highly processed foods and are consumed at an ever-growing rate. Fruits and vegetables, on the other hand, receive very few subsidies.
Traditionally, the focus of analyses of agriculture subsidies is the income of producers or the stability of the food supply. The constellation of farm support programs also shapes the composition of the food supply, which is determinative of what food is consumed. Thus, federal support of certain crops and food sources impact Americans’ nutrition and health.
Farm Bill Overview
The federal government has long subsidized farmers, notably during the Great Depression, paying farmers to stop producing certain crops to eliminate surpluses and allow prices—and thus income for millions of farmers (25 percent of the nation’s population in 1930)—to rise.[1] Congress has continued to develop various programs to support farmers’ and ranchers’ income to—at least partly—maintain the country’s food supply, from government purchases to price and revenue supports, subsidized loans, and crop insurance to protect against financial losses. These programs are included in legislation known as the “Farm Bill” and reauthorized (and occasionally reformed) every five years or so, most recently through the Agriculture Improvement Act of 2018. Subsidies for farmers averaged $16 billion per year over the past decade.[3] As this analysis shows, however, the value of those subsidies is not uniform across crops and is highly concentrated among a select few.
Subsidies
Traditional Crops
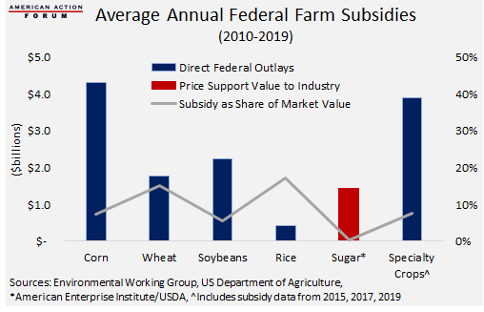
While support is available for a wide range of crops, as well as dairy products, most support is concentrated among a few commodities, often referred to as the “Big Five”: corn, soybeans, wheat, cotton, and rice. This concentration is partly a reflection of the fact that payments for the primary subsidy programs are based on historical production on base acres rather than current production, and corn, wheat, and soybeans account for 82 percent of base acres.[4],[5]
Subsidies for corn—the most abundant crop in the United States—have far surpassed those for any other crop, estimated to have totaled more than $116 billion since 1995. This is followed by subsidies for wheat at $48.4 billion and for soybeans at $44.9 billion over that same period.[6] (Subsidies for certain crops are also provided through other means besides the Farm Bill, not accounted for here. For example, corn is further subsidized and production encouraged through the Department of Energy’s biofuel programs and the Renewable Fuel Standard mandates, both of which support the production of corn for ethanol.)
Specialty Crops
Supports for “specialty crops,” which primarily includes fruits, vegetables, and tree nuts, have been relatively minimal in absolute terms and only available for the past three decades. These supports historically have not included direct subsidies such as the price protection payments available for other commodities.[7] Instead, specialty crops receive indirect price support from a limitation on growers of other commodity crops from growing specialty crops; some limited funding to support farmers markets, research, and pest and disease control; and requirements for the government to purchase fixed amounts of fruits and vegetables for various nutrition programs.[8] Recently, crop insurance has been made available for specialty crops, providing some direct support for such farmers. The value of the insured acreage for specialty crops is only a fraction—17 percent—of that of traditional crops.[9]
Sugar
Sugar is not directly subsidized substantially, but it is highly subsidized indirectly through various policies including domestic production limits and import quotas, marketing assistance loans, and the sugar-to-ethanol program, all of which artificially inflate its price.[10] Analysts at the American Enterprise Institute estimate these policies inflate U.S. sugar prices by 69 percent above the global sugar price in recent years and provide $1.2 billion worth of annual support to sugar growers and processors, which would make it the fourth most subsidized crop in absolute terms.[11] Note, however, that this type of subsidy raises the cost to consumers of sugar, in contrast to the crops discussed above.
Subsidies as a Share of Market Value
A useful way to present the impact of federal crop subsidies is in the form of an effective subsidy rate – the value of subsidies as a share of a crop’s market value (sales). These are shown in the chart (below). While subsidies for wheat over the past decade were lower than subsidies for corn and soybeans in absolute terms, they constituted a greater share of its market value. Of note, total subsidy outlays for all other fruits and vegetables were 10 percent lower than subsidies for corn alone over the past decade, leaving specialty crops with a lower effective rate of subsidy.[12]
The Composition of Food Supply
As with most goods, the most heavily subsidized crops are also the most abundant. The following chart (reproduced from a Congressional Research Service report) shows the number of acres planted compared with the number of “base acres” per crop eligible for subsidies under the largest current subsidy programs: the Marketing Loan Assistance program, the Agricultural Risk Coverage program, and the Price Loss Coverage program.[13] The chart shows a strong correlation between plantings and subsidy availability; unsurprisingly, corn tops the chart on both variables. Soybeans are a rare exception where there are significantly more acres planted than are available for subsidy. The high number of planted soybean acres is likely the result of rising market prices and financial returns for farmers, surpassing that of corn for most of the past decade.[14]
Corn is also the largest crop in terms of sales, accounting for 26.5 percent of total crop sales. Soybeans are close behind at 20.8 percent of total crop sales. Vegetables made up 10.1 percent while fruit and tree nuts made up 14.8 percent.
The Composition of Food Consumption
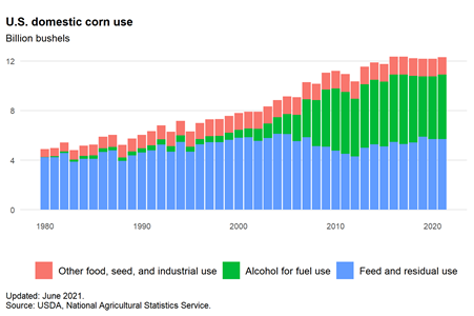
Corn is the most subsidized and abundantly grown crop, but most of that corn is not consumed by humans: Less than 1 percent of all corn grown in the United States is the sweet corn that we eat in its unprocessed form.[15] Still, Americans consume a significant amount of corn and corn byproducts in various processed foods. The vast majority of corn that is grown is dent corn, which goes on to be used as feed for livestock, converted to ethanol, or made into food additives that get put in almost every processed item in the grocery store.[16]
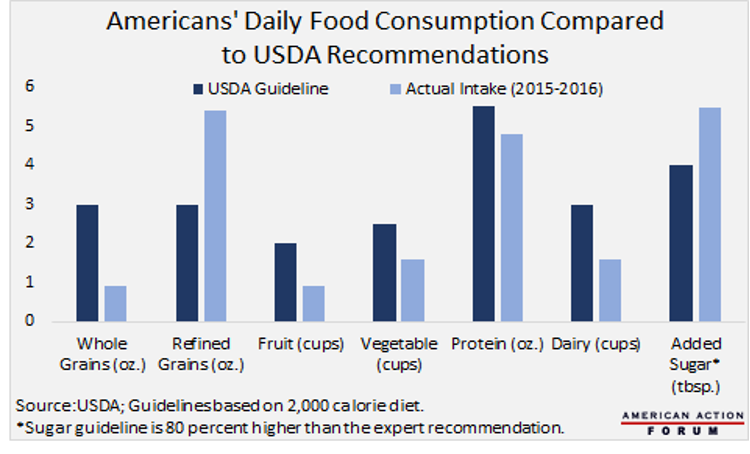
For more than 100 years, the Department of Agriculture has set dietary guidelines to help Americans make healthy food choices, yet Americans have long failed to meet these recommendations in any category.[17] Only 12.2 percent of American adults meet the daily fruit intake and that number drops to 9.3 percent when it comes to vegetables.[18] Of those vegetables, potatoes and tomatoes were the most consumed, with a large portion being frozen potatoes (french fries) and canned tomatoes (pizza and pasta sauce).
Not only are Americans failing to eat enough produce, but they are also overconsuming in categories that are harmful to health. Of the average 6.3 ounces of grains being consumed daily, 5.4 are refined—far exceeding the 3-ounce recommendation.[19] Refined grains are processed in a way that strips them of key nutrients that are essential to a healthy diet.
Another area of overconsumption is sugar—despite the higher prices imposed by the protectionist production limits and import quotas. The average American consumes more than 70 grams of added sugar per day—nearly 40 percent more than the official dietary guideline.[20] These added sugars come in many forms, including syrups such as high fructose corn syrup and rice syrup. Additionally, it should be noted that the recommendation for added sugars (6 percent of calories or less) presented by e (an external group of nutrition experts) was less than the amount ultimately adopted in the federal guidelines (10 percent)[21] If the Advisory Committee’s recommendation had been adopted, average sugar consumption would be 2.5 times greater than the recommended daily allowance.
When assessing the actual foods that Americans eat—as opposed to the components of those foods noted above—evidence finds that Americans’ diets are comprised of mostly ultra-processed foods. The NOVA scale has been developed to classify foods by their level of processing. An ultra-processed food can be defined as foods made up of substances derived from foods but with very little resemblance to a whole food, often containing high doses of sugar, salt, fat, and preservatives.[22] These foods make up 58.5 percent of the average American’s diet.
An even greater share is seen in the 10-19-year-old age group, where 66.8 percent of their diets are ultra-processed. Many additives in these processed foods, such as cornstarch, corn syrups, corn oil, hydrogenated oil, and maltodextrins, come from corn. Wheat and soy are also commonly found in highly processed foods. Wheat is the typical ingredient used for flour in cookies, crackers, breads, and cake products, and is also added to many other foods for flavoring, coloring, or as a thickening or biding agent.[23] Soy is often used as a plant-based alternative protein, but can also be used as a flour, a non-dairy milk, or a binding or thickening agent.[24] Finally, sugar and salt is added to almost every processed food for flavor, to alter texture, or as a preservative.[25]
In sum, these eating patterns result in most Americans consuming excess calories, saturated fat, sodium, and added sugars, and insufficient levels of Vitamin D, calcium, fiber, and potassium.[26]
Conclusion
The U.S. government heavily influences what farmers grow and consumers eat through various policies to subsidize the production of certain crops. The most highly subsidized crops—particularly corn, wheat, and soy— are highly prevalent in our food supply and consumed at rates well above recommendations, especially in highly processed foods. Sugar and salt are also commonly found in highly processed foods. Fruits and vegetables, for which subsidies are much smaller, are consumed well below recommended amounts. As Americans consume an ever-growing share of ultra-processed foods, we are consuming more calories, fats, sodium, and sugars, and not enough beneficial nutrients and vitamins. It is critical that both policymakers and the American public understand the influence that federal agricultural subsidies have on our food supply and diet and, in turn, our nutrition and health.
[1] https://livingnewdeal.org/glossary/agricultural-adjustment-act-1933-re-authorized-1938-2/, https://farmdocdaily.illinois.edu/2013/07/farm-policy-income-farm-nonfarm.html
[3] https://farm.ewg.org/region.php?fips=00000&progcode=total&yr=2020
[4] https://crsreports.congress.gov/product/pdf/IF/IF11161
[5] Using base acres rather than current production to determine subsidy eligibility allows farmers to receive subsidy payments for crops not grown but also provides flexibility in planting choices, somewhat reducing the influence of subsidies on crop production. See https://www.fb.org/market-intel/modernizing-base-acres
[6] https://farm.ewg.org/region.php?fips=00000&progcode=total
[7] https://crsreports.congress.gov/product/pdf/R/R45459
[8] https://www.everycrsreport.com/files/20090113_RL33520_db79b44f502bb09942cd499f5e5ee95d99a66c13.pdf
[9] https://crsreports.congress.gov/product/pdf/R/R45459
[10] https://crsreports.congress.gov/product/pdf/R/R44914, https://www.fsa.usda.gov/Assets/USDA-FSA-Public/usdafiles/FactSheets/2017/feedstock_flexibility_program_oct2017.pdf
[11] https://www.aei.org/wp-content/uploads/2017/11/Analysis-of-the-US-Sugar-Program.pdf?x91208
[12] https://farm.ewg.org/region.php?fips=00000&progcode=total&yr=2019
[13] https://crsreports.congress.gov/product/pdf/R/R44914
[14] https://farmdocdaily.illinois.edu/2021/05/high-corn-and-soybean-return-outlook-for-2021.html
[15] https://www.mncorn.org/corn-facts/
[16] https://www.usda.gov/media/blog/2019/07/29/corn-americas-largest-crop-2019
[17] https://www.dietaryguidelines.gov/about-dietary-guidelines/history-dietary-guidelines , https://www.ars.usda.gov/ARSUserFiles/80400530/pdf/DBrief/20_Food_Patterns_Equivalents_0304_1516.pdf
[18] https://www.cdc.gov/nutrition/data-statistics/2018-state-indicator-report-fruits-vegetables.html
[19] https://www.ars.usda.gov/ARSUserFiles/80400530/pdf/DBrief/20_Food_Patterns_Equivalents_0304_1516.pdf
[20] https://www.cdc.gov/nutrition/data-statistics/added-sugars.html
[21] https://www.dietaryguidelines.gov/sites/default/files/2020-07/ScientificReport_of_the_2020DietaryGuidelinesAdvisoryCommittee_first-print.pdf, https://www.dietaryguidelines.gov/sites/default/files/2021-03/Dietary_Guidelines_for_Americans-2020-2025.pdf
[22] https://www.health.harvard.edu/blog/what-are-ultra-processed-foods-and-are-they-bad-for-our-health-2020010918605
[23] https://www.verywellfit.com/what-foods-have-gluten-562782, https://www.glutenfreepalate.com/binding-agents/
[24] https://healthyeating.sfgate.com/list-soy-products-9058.html, https://www.allergicliving.com/2010/09/02/the-scoop-on-why-soys-in-so-many-products/
[25] https://www.ksre.k-state.edu/kvafl/ingredients/additives.html
[26] https://www.dietaryguidelines.gov/sites/default/files/2020-07/ScientificReport_of_the_2020DietaryGuidelinesAdvisoryCommittee_first-print.pdf


