Research
March 21, 2016
Primer: Medicare Advantage Payment Process
Background
Medicare Advantage provides anyone eligible for Medicare the option of enrolling in a private health insurance plan, as opposed to receiving benefits through the traditional fee-for-service (FFS) option. While Medicare beneficiaries have had some alternative options for receiving benefits since shortly after Medicare’s creation in 1965, the availability, design, and cost of such plans has changed dramatically over time. Medicare Part C was formally created through the Balanced Budget Act of 1997 and was known at the time as Medicare+Choice (M+C). This legislation provided the Centers for Medicare and Medicaid Services (CMS) the authority to contract with organizations to provide beneficiaries a variety of health plan options that would cover, at a minimum, all of the services covered by Medicare Parts A and B. The Medicare Modernization Act of 2003 (MMA) renamed the program Medicare Advantage (MA), added new plan options (including regional plans), and changed the way plans are paid. Payments are currently based on benchmark rates, plan bids, quality ratings, and enrollee risk scores, but the formulas are slightly different for local plans and regional plans. Each of these components and payments for the two types of plans is explained below.
Local Plans versus Regional Plans
Local Plans
Under Medicare+Choice, all plans were considered local plans; there was no distinction until regional plans were introduced under MMA. Local plans may cover a single county or several counties, at the plan issuer’s discretion; counties covered by a single plan represent the service area. Plans may charge different premiums and offer different benefits to beneficiaries living in one county than they do beneficiaries in another county within the same service area.
The majority of local plans are health maintenance organizations (HMOs), enrolling 63 percent of all MA enrollees. Local preferred provider organizations (PPOs) enroll 23 percent of MA beneficiaries.
Regional Plans
Regional plans were created in 2006 with the intention of expanding access to MA plans for Medicare beneficiaries living in areas local plans were not sufficiently serving, particularly rural areas. In 2005, only 84 percent of Medicare beneficiaries had access to an MA plan; by 2006, the first year regional plans were offered, 100 percent of beneficiaries had access to a plan, and that percentage remained at 100 until 2015 when it dropped to 99 percent. Twenty-six regions were created: 11 cover a single state and 11 cover two states; the other four include three or more states, with the largest region, in the less-densely populated upper-Midwest, covering seven states.
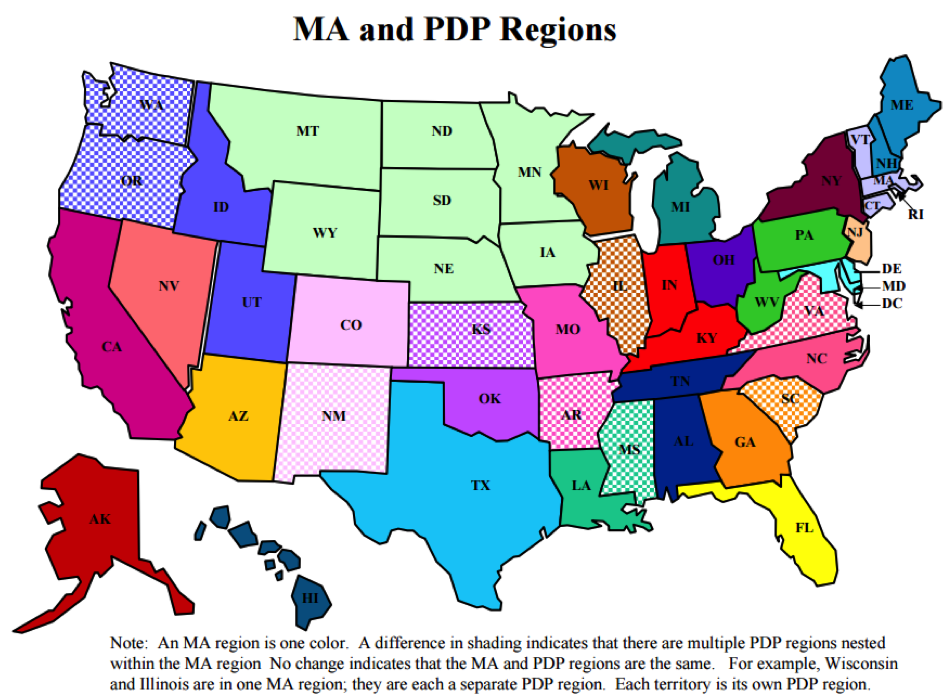
Regional plans must enroll any beneficiary in the region seeking coverage, and, unlike in local plans, the premiums charged and benefits offered must be uniform throughout the region. All regional plans are PPOs and are required to provide some amount of coverage for out-of-network care. This is again in contrast to local plans, which have no such requirement. Most local plans are HMOs, and do not offer out-of-network coverage or offer only limited coverage.
For both local and regional plans, CMS imposes an out-of-pocket limit; for 2017, the proposed limit is $6,700.
Benchmarks
Local Plans, In General
In MA, payments to plans are dependent upon the plan’s bid and the benchmark for the coverage area. The benchmark, which is set on a county level, is the most that a plan will be paid for a beneficiary enrolling in that area and is based on FFS spending. Beginning in 2017, after a transition period put in place by the Affordable Care Act (ACA) to bring MA payments down closer to FFS payments, benchmarks will be set based on a percentage of the average expenditure for a FFS beneficiary in that county. CMS ranks all of the counties each year according to the average FFS expenditure per person and groups the counties into quartiles. The benchmark is then adjusted for the counties in each quartile by the “applicable percentage”, as shown in the table below. The benchmark for the counties in the top quartile (with the highest average expenditure) will equal 95 percent of the average FFS expenditure in that county. The counties in the bottom quartile (lowest average expenditure) will receive a benchmark equal to 115 percent of the average FFS expenditure.
| Quartile | Applicable Percentage |
| 4th (highest) | 95% |
| 3rd | 100% |
| 2nd | 107.5% |
| 1st (lowest) | 115% |
The calculation of the benchmark is slightly more complicated when a plan chooses to serve more than one county, as most local plans do. In this case, because plans must submit a single bid for the entire service area they choose to cover, plans receive a composite benchmark for the plan’s total service area based on a weighted average of the projected number of enrollees for that plan in each county and the local benchmark for each of those counties.
Calculation of Benchmark for Local Plans
Regional Plans, In General
The benchmark for regional plans is comprised of two components: the “statutory component” and the “plan-bid component.” The statutory component is calculated in the same manner as that of local plans serving multiple counties, with a slight variation: this piece is weighted by the total number of Medicare beneficiaries who live in each county (as opposed to local plans where the weight is based on projected enrollment) and then multiplied by the national percentage of Medicare beneficiaries in FFS (currently about 70 percent). The second component, which does not exist in the benchmark calculation for local plans, weighs plans’ bids by projected enrollment, which is then multiplied by the national percentage of Medicare beneficiaries in MA (about 30 percent in 2016). These two components are then added together to make up the regional benchmark.
Calculation of Benchmark for Regional Plans

More Specifics
For those wanting to know a little more, there are two other terms worth noting: the “applicable amount” and the “specified amount.” The applicable amount is what the benchmark would have been if the changes enacted by the ACA had not been enacted (the pre-ACA amount). The specified amount is the post-ACA benchmark amount based on FFS rates. The applicable amount is still relevant, to a degree, because it is used as the cap for the new benchmark: if the new formula were to produce a benchmark (including the bonus-adjusted benchmark discussed below) that would be higher than it would have been under the pre-ACA methodology, then the benchmark is capped at the pre-ACA amount. However, in an attempt to ensure the payment rates reflects actual costs, benchmarks must be “rebased” at least once every three years using more recent claims data (and prior year estimates must be updated to allow for a better understanding of the rate of growth). In any given year, the “applicable amount” that sets the cap for the benchmark is the greater of the FFS rate for that upcoming year or the applicable amount for the year prior plus the MA growth rate. The growth rate is a projection of the year-to-year growth in beneficiary per capita costs. (Rebasing will occur in 2017, and these figures will be included in the Final Notice due on April 4, 2016.)
Quality Bonuses
Beginning in 2012, under the MA Star Rating System which measures the quality of a plan according to measures determined by CMS, plans became eligible to receive a bonus which would be added to the benchmark. Plans receiving four or more stars for a year, would have their benchmark in each county raised by 5 percent the following year. In addition, these bonuses are doubled for “qualifying counties.” The ACA defines a qualifying county as a jurisdiction that meets three criteria: (1) It is part of a metropolitan statistical area that has total population above 250,000; (2) at least 25 percent of eligible beneficiaries are enrolled in MA; and (3) average spending on behalf of FFS beneficiaries in that jurisdiction is less than the national average for FFS spending. The importance of this will be explained in the section detailing payments to plans.
Plan Bids
Each year, after the county rates have been set and before open enrollment begins, plan issuers must submit bids to CMS if they would like to offer a plan for the upcoming year. The bid is the issuer’s projection of what it will cost to cover a single beneficiary (with an average risk score) each month. CMS analyzes the bid for actuarial soundness and either accepts or rejects the bid. If a plan’s bid is rejected, there is an opportunity for the plan issuer to make adjustments and resubmit their bid.
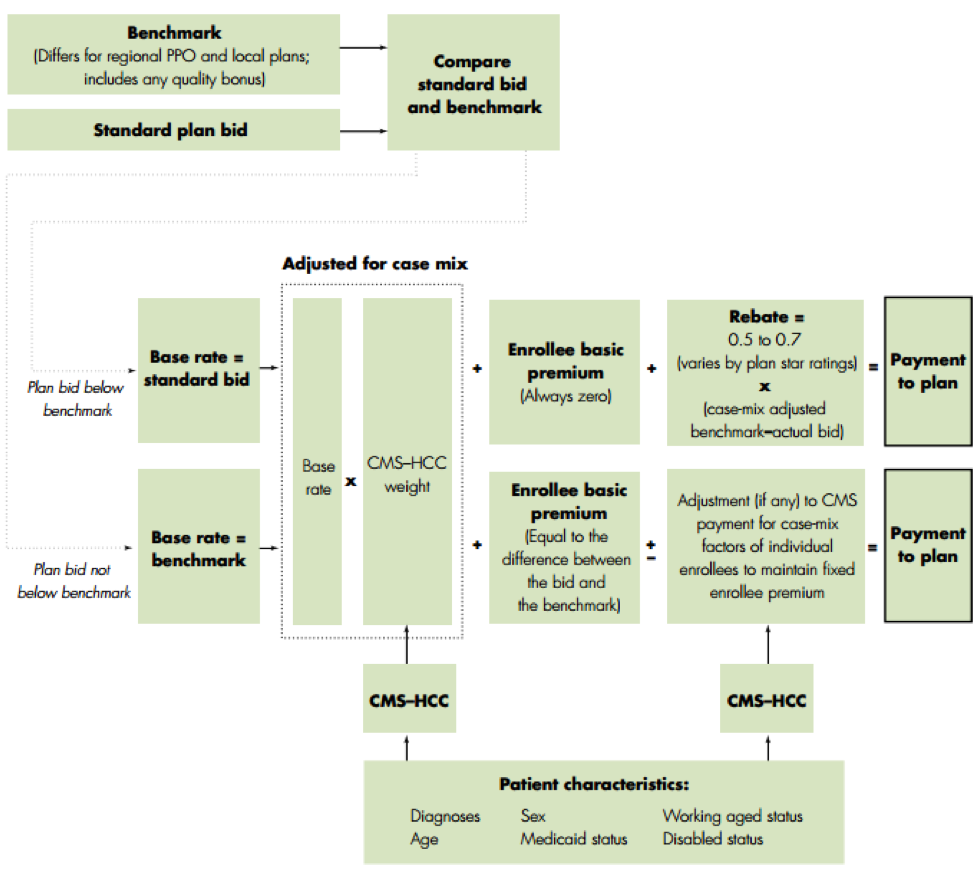
Plan Payments
For both local and regional MA plans, plan issuers are paid based on their bid, relative to the benchmark. The most a plan will be paid by CMS is the bonus-adjusted benchmark (plus a potential rebate, discussed below, based on the plan’s quality ratings). If a bid is below the benchmark, the plan payment is equal to the bid. If a bid is above the benchmark, the payment will equal the benchmark and any beneficiary enrolling in that plan must pay the remainder. The quality bonus that gets added to the benchmark for qualifying plans enables plans to either 1) bid higher and receive a larger base payment without going over the benchmark and requiring beneficiaries to pay a premium or 2) receive a larger rebate, which is useful in attracting more beneficiaries to enroll, by enhancing the benefit package.
The rebate is the second component of a plan’s payment. Any plan bidding below the benchmark will receive a rebate equal to at least 50 percent of the difference between the benchmark and the plan bid. If a plan received 3.5 stars under the quality rating system, or is new to the MA program, the rebate will equal 65 percent of the difference. Plans receiving 4 or more stars will receive a rebate equal to 75 percent of the difference. Rebates must be returned to beneficiaries in the form of reduced premiums or cost-sharing, or increased benefits.
Risk Scores
Once the payment amount for each plan in each area has been calculated, the payment receives one final adjustment based on the plan’s enrollees’ risk scores. The risk score is meant to compensate plans that enroll beneficiaries with a higher than average health risk and to reduce payments for healthier beneficiaries who have a lower health risk. Risk scores are based on an individual’s diagnoses from the prior year. However, because this risk score methodology incentivizes MA plans to diagnose every possible condition for their enrollees, a coding intensity adjustment is applied in order to push back against a perceived “over-diagnosing” practice. This adjustment reduces beneficiaries’ risk scores by a certain percentage before the risk score adjustment is made to the final payment. The ACA requires that the coding intensity adjustment increase by a minimum of 0.25 percent each year from 2015-2018 until it reaches and remains at 5.7 percent in 2019 and thereafter. Various studies have shown conflicting results as to whether such over-diagnosing actually occurs or whether the higher diagnosis rate among MA beneficiaries relative to FFS beneficiaries is the result of better care management and cohesion within the MA plans’ networks.