


Research
September 29, 2022
The Budgetary and Economic Tradeoffs of Reducing the Immigration Backlog
Executive Summary
- There are about 8.6 million immigration benefit applications pending before United States Citizenship and Immigration Services, of which 5.2 million are considered part of the agency’s backlog.
- While the agency has faced backlogs before, disruptions posed by the COVID-19 pandemic substantially increased benefit application backlogs.
- Eliminating the backlogs will require significant and sustained additional congressional funding; examining a number of different staffing scenarios, eliminating the backlog could take as little as two years or as long as eight years and could cost between $3.0–$3.9 billion.
- Eliminating the backlog would add new workers and immigrants to the U.S. economy and could contribute as much as $110 billion per year in additional real gross domestic product; this new national income would likely have a modest but positive budgetary effect over the next decade.
- The positive budget effects from these new workers could potentially more than pay for the estimated cost of backlog elimination.
Introduction
United States Citizenship and Immigration Services (USCIS) is the nation’s principal immigration administration agency. The service is responsible for processing applications for benefits in the U.S. legal immigration system. Like many federal agencies, USCIS’s operations were substantially disrupted by the COVID-19 pandemic. Unlike many agencies, however, USCIS is public facing, conducting a substantial share of its activities with members of the public and in person. The disruption of these activities has contributed to substantial backlogs in benefit applications. While many of these applications are administrative or otherwise economically inconsequential, the elimination of this backlog would nevertheless increase immigration and employment in the United States, with positive economic effects. This analysis estimates the funding and staffing needs required to eliminate the backlog and the resultant economic and fiscal effects of a backlog reduction scenario.
The USCIS Immigration Application Backlog
USCIS is a somewhat unique agency in the constellation of federal institutions in that it is almost entirely funded by user fees. The agency receives about 97 percent of its funding through the imposition and collection of fees for immigration benefit applicants.[1] The agency reviews its fee structure every two years and adjusts its applicable fees to fund sufficient staffing to process expected applications. The agency last proposed a new fee structure in a final rule published in the federal register in October of 2020.[2] The formal rulemaking process is somewhat painstaking, and can take years to resolve, as the agency responds to public comments and other complications. Indeed, legal risk also attends to this process, evidenced by the 2020 fee rule having been subject to a federal injunction. The currently prevailing fee rule was issued in 2016.[3]
The fee structure (and the cumbersome process that underpins) it appears to be a boon for taxpayers insofar as the agency relies on substantially foreign receipts. Yet this funding model can challenge the agency’s ability to adapt to significant events, such as global phenomena that could motivate changes in immigrations patterns, and most conspicuously, a global pandemic. During the summer of 2020, the agency twice notified more than two-thirds of its staff that they could be furloughed owing to a 40 percent decline in fee receipts between March and May of 2020. While the agency was able to avoid furloughs, it did significantly reduce non-payroll costs.[4] On top of these unique pressures, the agency faced the same challenges that confronted all forward-facing federal agencies during the pandemic. The result was a significant decline in agency performance.
Over the last nine years, the agency has received an average of about 7.7 million applications for immigration benefits of one form or another.[5]
Figure 1: USCIS Applications Received

Over the same period, the agency has averaged a completion rate of 94 percent.
Figure 2: USCIS Applications Completion Rate
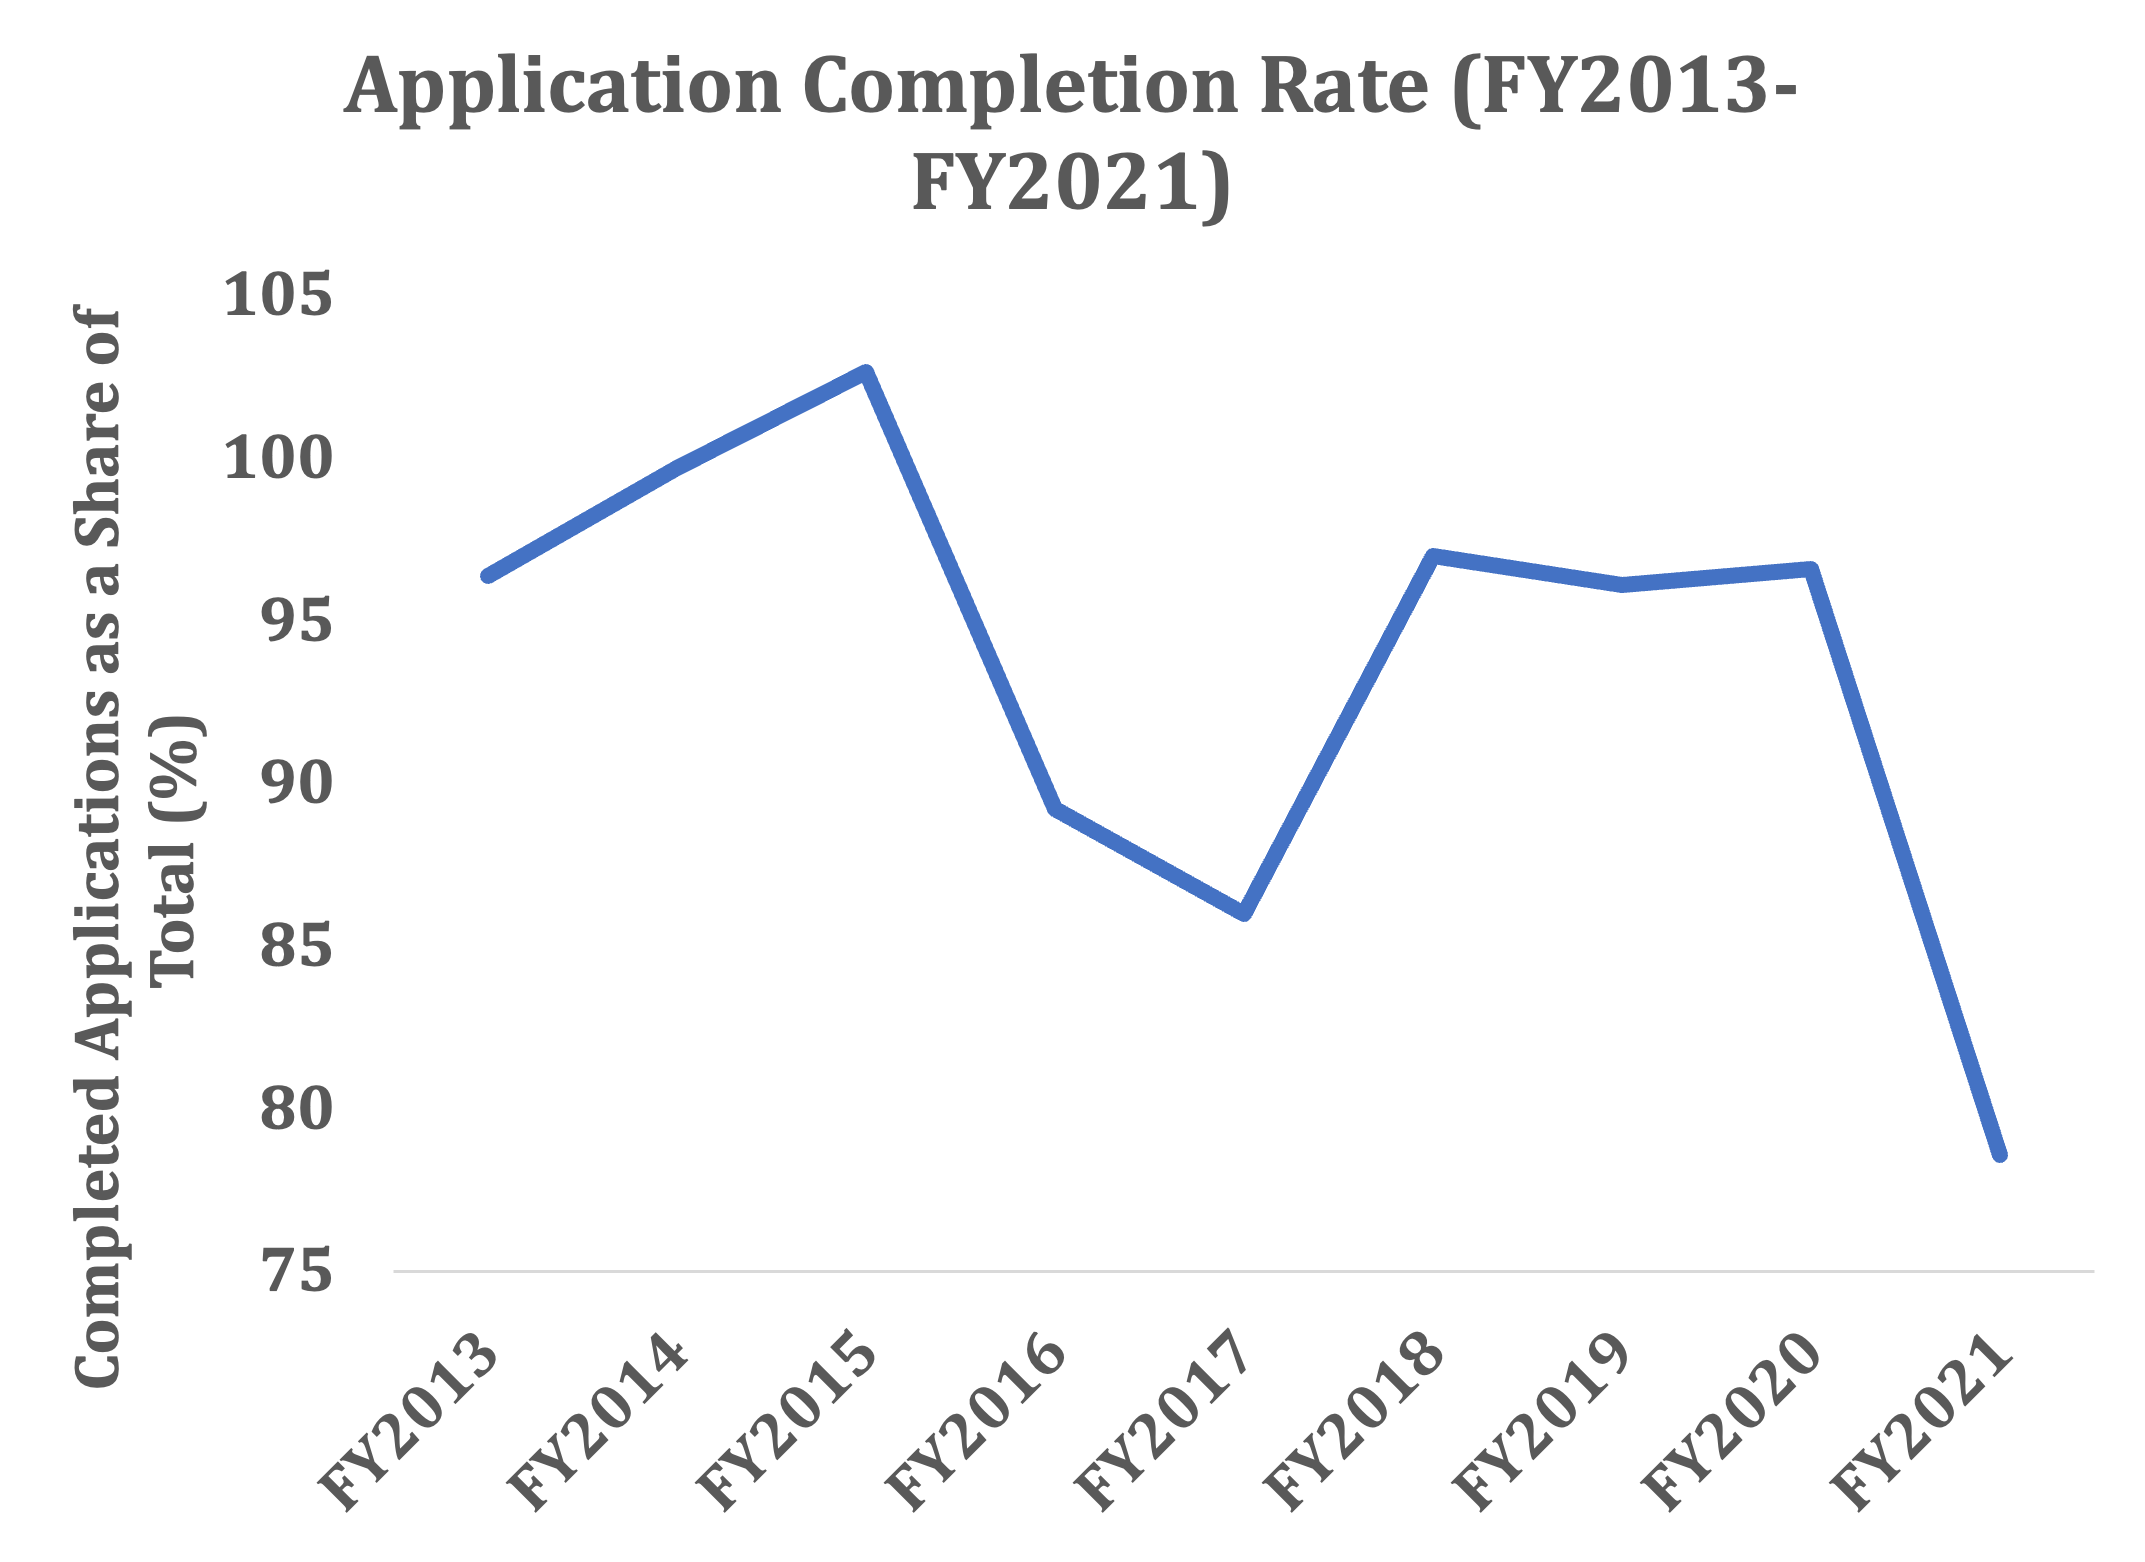
About 9 percent of applications were denied over that period. In total, the agency reported approving 57.9 million applications for various immigration benefits and services within the jurisdiction of USCIS between fiscal year (FY) 2013–FY2021.
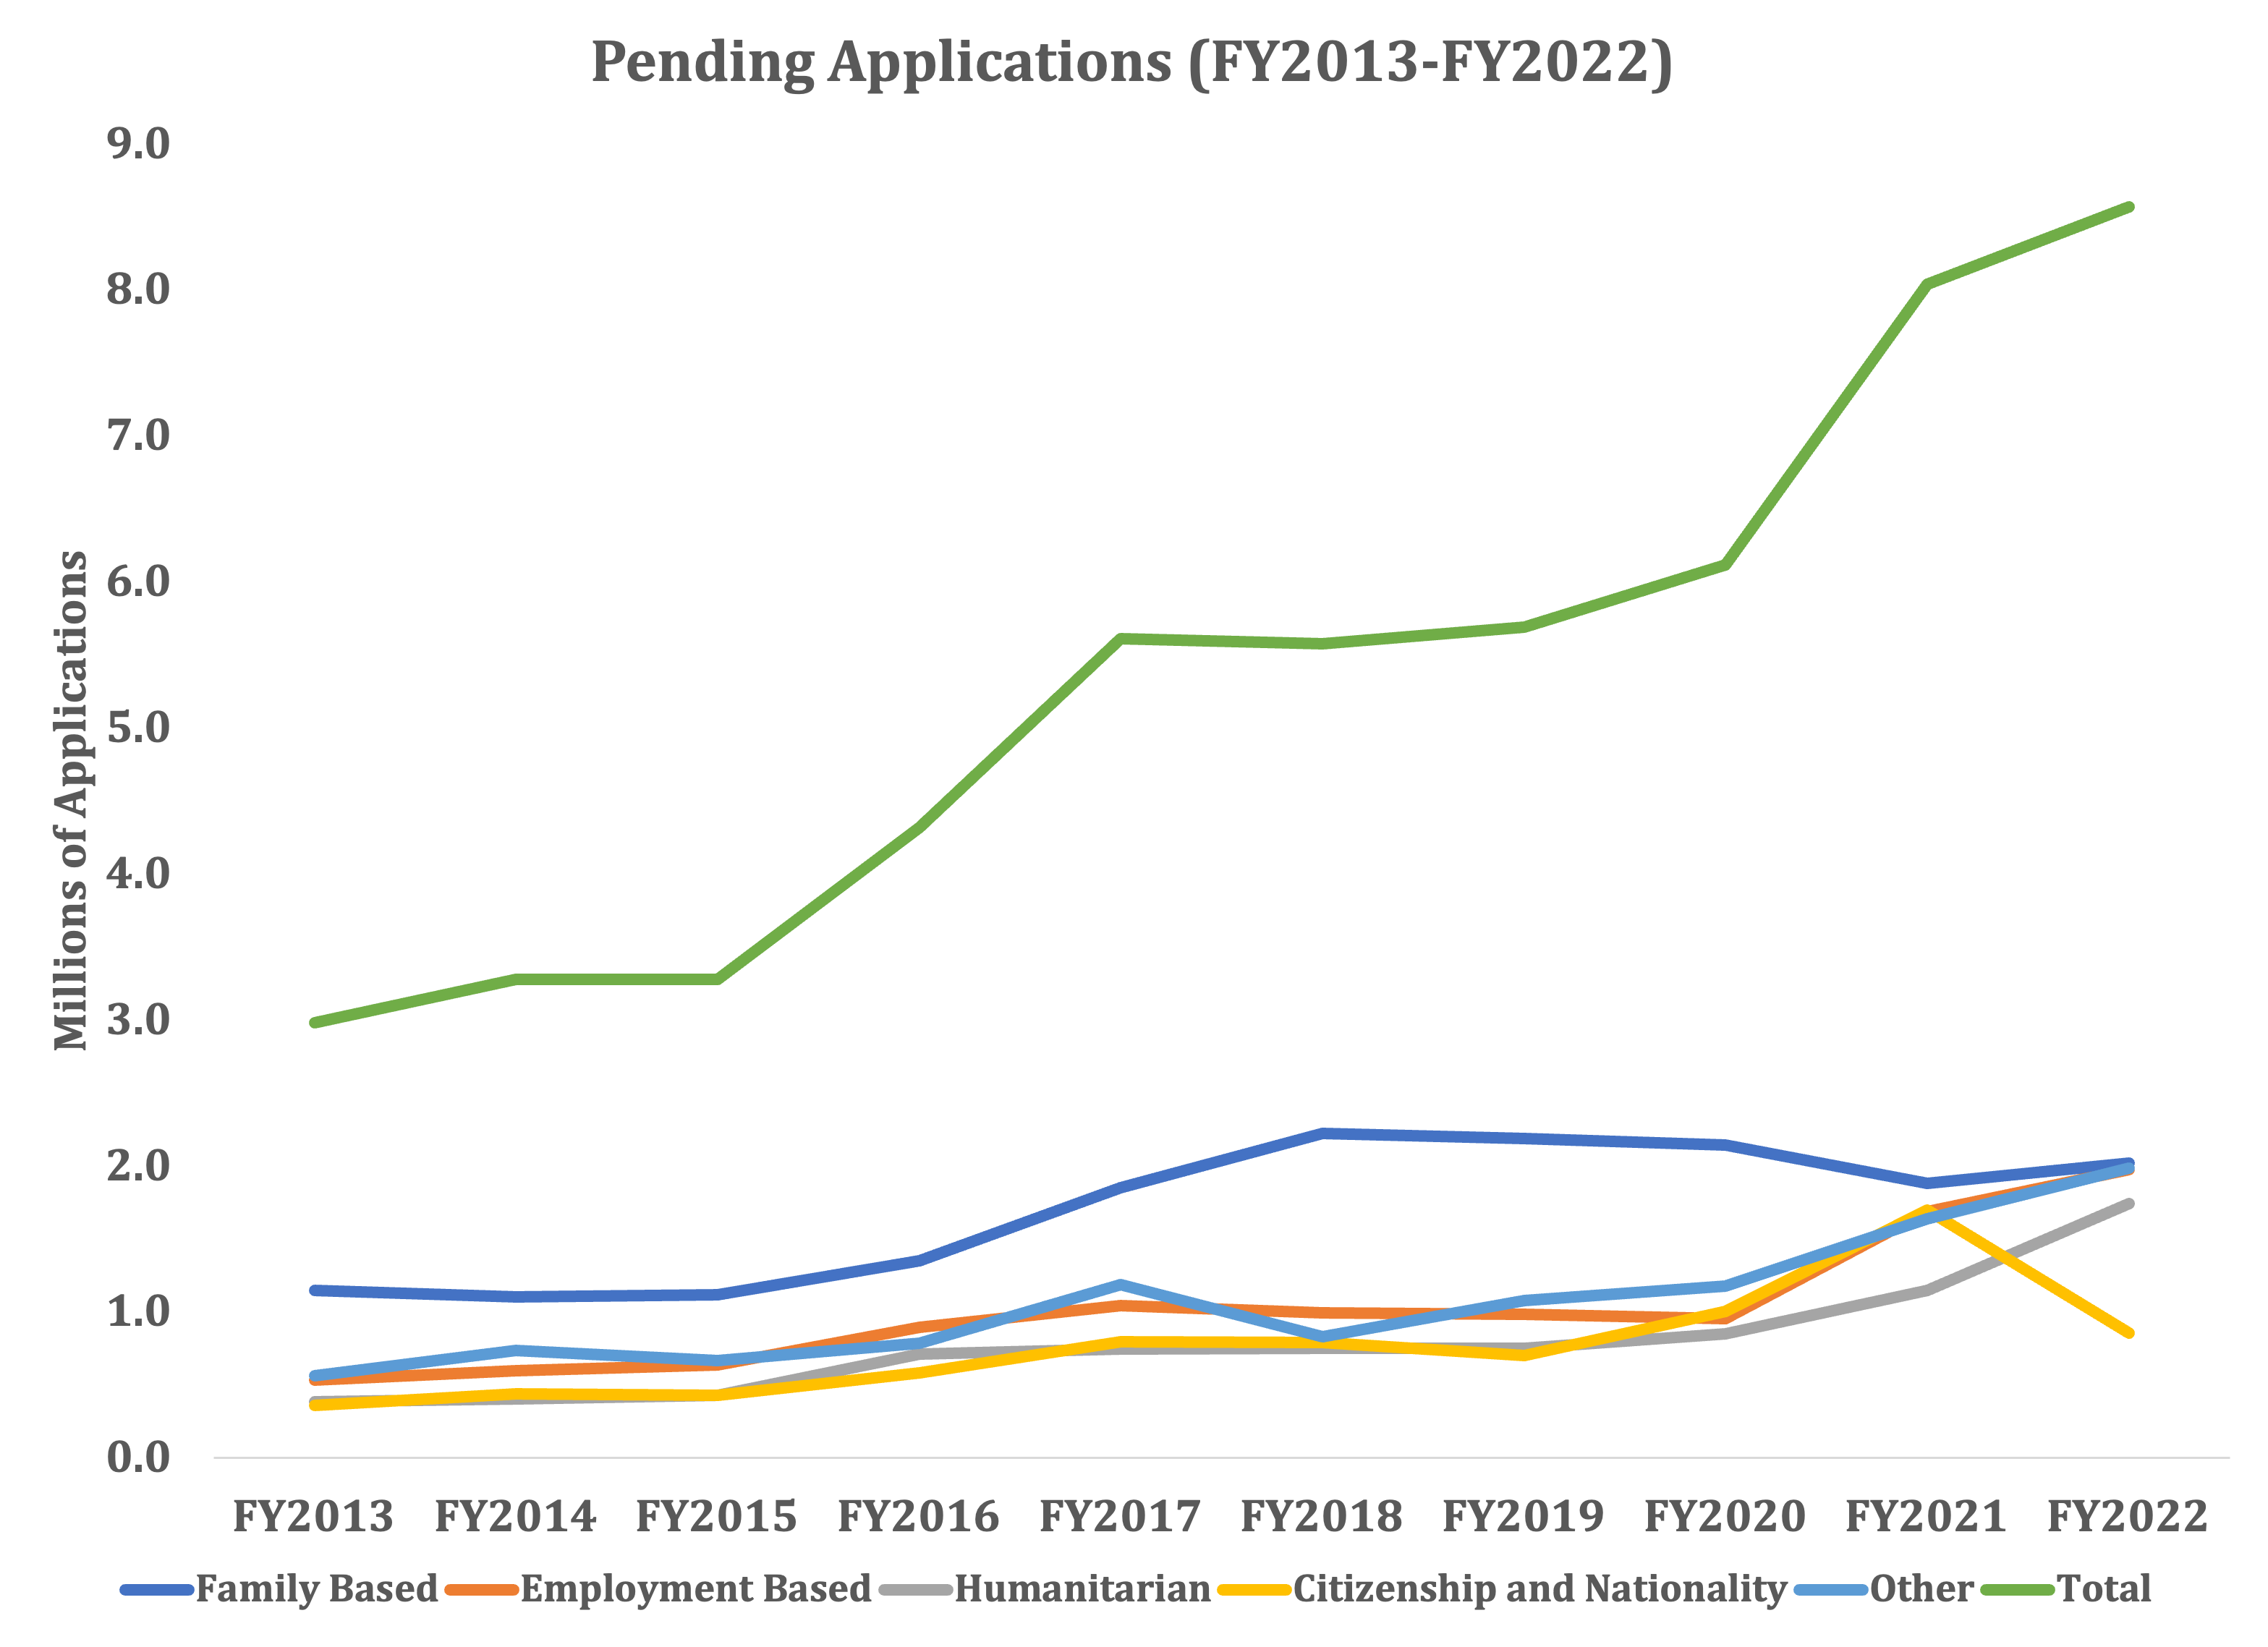
Given the substantial work volume, even a modest decline in agency efficiency can cause applications to back up. Indeed, over the past decade the number of applications pending with the agency has steadily grown and presently stands at 8.6 million.[6]
Table 3: Pending Applications
While there was a bit of an uptick in some types of applications, in general, the key metric in understanding the substantial increase in pending applications in the last two years has been the precipitous decline in completion rates, specifically in FY2021, when the agency completed 78.6 percent of applications received. This followed in the wake of substantial agency disruption caused by the COVID-19 pandemic. The agency must conduct interviews and other in-person functions to process many applications – indeed only about 10 percent of the agency’s application forms can be processed online – and these were significantly impaired by office closures and other pandemic-related disruptions.[7] As noted above, this period also coincided with a federal court preventing an update to the agency’s fee model. The agency has committed to a number of improvements of the agency’s efficiency in processing applications, including expanded digitization.[8] Nevertheless, there are risks that, despite these internal improvements, the backlog will only continue to grow.[9]
It was something of a perfect storm, and the agency is now charged with digging out from accumulated backlogs. It is important to distinguish between pending cases and the agency’s backlog. At any given time, there are millions of applications pending before USCIS. An application is considered part of the backlog by the lights of USCIS if it takes longer than the agency’s processing time goals, which the agency published in March of 2022.[10] The agency does not publish regularized or consistent data on its backlog. Indeed, USCIS ombudsman could only reference a broad measure of 5.3 million, as cited in recent testimony from the agency’s director.[11] More recent reporting pegs the FY2022 2nd quarter backlog at 5.169 million applications.[12]
Cost of Reducing Backlog
While USCIS generally relies on fees to support operations, it did receive a rare congressional appropriation for operations support of $275 million, plus an additional $193 million for help resettling Afghan refugees.[13] While this may be new-found money for the agency, it pales in comparison to the $2 billion and the $3 billion that the Departments of State and Health and Human Services received, respectively, for Afghan resettlements.[14] The agency appears to be generally unaccustomed to the annual appropriations process, however. The House Appropriations Committee, for example, observed a number of deficiencies in the agency’s justifications for its recent budget request. The Government Accountability Office (GAO) has similarly observed deficiencies in the agency’s planning and staffing approaches. Indeed, the agency’s staffing model itself is cumbersome, and does not reflect realistic hiring patterns.[15]
Similarly, the agency has not provided a clear plan to eliminate the pending backlog. The GAO noted that the agency developed a backlog reduction plan for FY2019 that would require 2,111 new personnel to eliminate the then-pending backlog by 2024.[16] According to GAO, the agency did not move forward with the plan due to resource constraints. USCIS has reportedly updated the plan as part of the interagency budget process, but as of GAO’s reporting, had not made the plan available to Congress or the public. GAO also noted that the Homeland Security Act of 2002 requires USCIS to report to the president and Congress on the backlog, as well as the resources needed to eliminate it. In its response available to GAO, it did not detail the resources needed to eliminate the backlog. Responses to congressional inquiries have been similarly thin.[17]
USCIS has announced additional measures to attempt to improve processing times, but fundamentally, the agency is structured and funded to meet incoming applications.[18] It is essentially required by statute to live hand-to-mouth. While the agency’s fee structure is designed to assign costs of applications somewhat in proportion to the agency’s costs to process them, there are a number of no-fee or fee-capped immigration benefits, the cost of which must be made-up by higher fees elsewhere. The total cost of no-fee or fee-capped humanitarian-based filing was $330 million in FY2021.[19] Over the next decade, these functions alone will cost $4.0 billion.[20] USCIS ombudsman has recommended that the agency seek congressional appropriations, and this is another function that could benefit from discretionary funding and ease burdens elsewhere in the agency fee structure. Between these challenges, and the subsistence funding model the agency uses, these challenges are only likely to grow in the absence of a sustained effort funded through congressional appropriations.
This analysis assesses three funding and staffing approaches to eliminate the pending application backlog. This assessment requires several assumptions. First, this estimate uses the most recently available backlog figure (5.169 million) as a starting point. It assumes that funding and backlog reduction efforts will begin at the beginning of FY2023. It also assumes, consistent with the agency’s funding model and recent appropriation, that the backlog is stable over time. That the backlog has declined somewhat from a recent high of 5.3 million provides some context for this assumption. Relatedly, it assumes that all of the new staffing is devoted to backlog reduction. Consistent with agency statistics, this analysis assumes it takes about six months to onboard an employee.[21] Further, this analysis does not consider the costs or disposition of the staffing scenarios after the backlog has been cleared. Depending on Congress, these employees could remain on staff and assist with ongoing operations, which would necessarily require follow-on appropriations consistent with the annual estimated cost of the new workforce. Staffing levels could be allowed to decline through attrition (GAO reported rates ranging from 10–42 percent attrition per year depending on the divisions) or alternative staffing approaches, such as contracting, could be considered.[22] Last, it assumes that the relative share of the types of applications (e.g., employment-based, family-based, humanitarian, etc.) in the backlog are proportional to the relative shares in the published pending application data.
For the following scenarios, full-time equivalent (FTE) is the basic staffing unit of analysis. To estimate the effectiveness of staffing in reducing the backlog, this analysis relies on an average employee completion rate based on hourly rates published by the agency in its most recent proposed fee rule.[23] This provides the average hours per adjudication of an immigration benefit request. Based on application data, we can calculate total adjudication hours for the agency, which amounted to about 5.8 million hours in FY2021. It would be rather optimistic to assume each of the new hires would spend all 2078 of the hours that make for an FTE’s working year on adjudications.[24] Rather, this analysis relies on employee utilization rates estimated from the agency’s budget request. For example, the agency reported 18,676 FTEs in FY2021, for an equivalent of over 38 million working hours. Dividing adjudication hours by total hours provides an agency utilization rate of about 15 percent. Focusing more specifically on the agency’s adjudication operations, the applicable utilization rises to about 24 percent, which means it takes about four employees to do the work of one automaton processing applications at the agency completion rate. The estimate relies on an estimated average cost of an FTE based on the agency’s budget justification.[25]
Table 1: Staffing Scenario 1
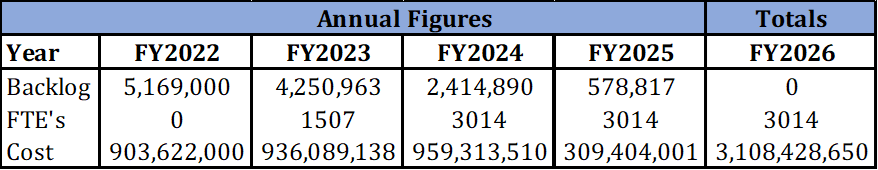
The first scenario begins with the FY2023 USCIS budget request, which called for the hiring of 4,001 positions, equating to 3,014 FTEs for operations and support, funded by a $903,622,000 discretionary appropriation.[26] If Congress appropriated $903.6 million at the end of FY2022, it could fund the hiring of 1507 new staff for FY2023 to begin backlog reduction. Based on estimated completion and utilization rates, those new personnel could reduce the backlog by over 900,000 in the first year, ramping up to an annual reduction in the backlog of over 1.8 million applications per year, until the backlog is eliminated in the first half of FY2026. The annual appropriation is assumed to grow at the rate of inflation in the most recent Congressional Budget Office (CBO) baseline.[27] In total, this staffing surge would cost about $3.1 billion.[28]
Table 2: Staffing Scenario 2
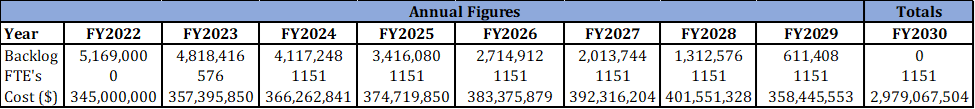
The second staffing scenario assumes Congress has a smaller appetite for new funding for the agency and begins with the FY2022 $345 million discretionary request in the president’s budget.[29] Based on more recent estimates, this would allow for the hiring of 1,151 new USCIS employees for backlog reduction. This more modest approach would take longer, resolving in FY2030 as opposed to FY2026, but would be incrementally less costly than staffing Scenario 2 at $3.0 billion.
Table 3: Staffing Scenario 3

The third staffing scenario is essentially the maximalist approach. The analysis begins essentially by dividing the total needed adjudication hours to eliminate the backlog, adjusted for completion and adjudication rates. If hiring could be instantaneous, then 8,485 new USCIS officers could eliminate the backlog in a single year. It takes at least six months or more, however, to onboard and train new employees. Under this approach, the backlog could be eliminated about halfway through FY2024 at a total cost of $3.9 billion.
Potential Economic Effects of Reducing the Backlog
USCIS processes over 50 different types of immigration benefit applications, across a similarly diverse range of forms.[30] These applications can be as mundane as replacing lost documents to providing asylum for Afghan special operators hunted by the Taliban. These varied applications can be broadly grouped into five major categories: family-based, employment-based, humanitarian, citizenship and naturalization, and other. Family-based applications relate to immigration benefits for eligible family members. Employment-based applications relate to employment authorizations and other immigration benefits that allow for employment for individuals otherwise unauthorized to work in the U.S. Humanitarian applications and include certain asylum applications, Deferred Action for Childhood Arrivals (or DACA), and other similar benefits.[31] Citizenship and nationality applications relate to applications for naturalizations and related benefits, while “other” includes myriad administrative applications to include replacement of lost documents and travel authorizations.
This analysis relies on the proportion of each category among currently pending applications to estimate the relative proportion of each category in the backlog. Most of these applications would not give rise to employment and significant economic effects, however. Indeed, many of the more numerous applications, such as applications for alien relatives (form I-130) or applications to replace a permanent resident card (Green card), give rise to no employment whatever. In the former case, an application for work authorization must also be completed. Accordingly, the elimination of the backlog would contribute far fewer workers to the United States than the totality of the backlog might suggest.
Assuming staffing Scenario 1 is enacted, it would eliminate the backlog by FY2026, reflecting a completion of nearly 5.2 immigration benefit applications. The vast majority are unrelated or are intermediate steps towards employment, however. To estimate the degree to which backlog elimination would contribute new workers to the economy, this estimate projects the new employment-based applications that would be approved over period (FY2023-FY2026) as well as lawful permanent resident (LPR), or “Green Card,” applications for humanitarian reasons. For the former category this analysis assumes all such applicants enter employment upon the approval of their application.[32] For humanitarian applications, this analysis assumes that approved applications convert to employment in proportion to the current employment-to-population ratio (0.601 percent).[33]
Based on these assumptions, under staffing Scenario 1, eliminating the backlog by FY2026 would add over 938,000 new workers to the U.S. economy. Of note, whereas their immigration benefit application and approval are essentially one-time events, their productivity will contribute to national income effectively for the rest of their lives. This analysis is limited by the conventional 10-year budget and economic window. This analysis assumes each new worker would contribute to the U.S. economy in proportion to potential labor productivity consistent with that estimated by CBO over the next decade.[34] Over that period, Staffing Scenario 1, and the new workers that would enter the U.S. economy as result, would add an average of nearly $110 billion per year in real terms to U.S. gross domestic product (GDP), or over $1 trillion over a decade.
Table 4. Economic Effects of Staffing Scenario 1

The Budgetary Effects of Staffing Scenario 1
The addition of nearly 1 million new workers to the U.S. economy is both an economic as well as a budgetary event. On the front-end, there is the one-time transaction cost of the immigration benefit application, while on the back-end, there are the lifetime earnings, tax payments and public services consumption that attach to U.S. residency. This analysis offers two approaches to broadly estimating the budgetary effects of the scenario specified here. The first uses on a top-down approach that relies on the GDP contribution from the new workers. The CBO publishes analyses called “Rules of Thumb” that provide the budgetary effects of alternative economic scenarios, including changes in productivity.[35] For example, if productivity growth average 0.1 percent less than CBO currently forecasts, revenues and spending fall, contributing to a net deficit increase of $292 billion over the next decade.
The productivity effects estimated under Staffing Scenario 1 equate to roughly an average increase in productivity growth of about 0.005 percentage points per year, which should lead to about $12 billion in deficit reduction, through $18 billion in increased revenue, offset by about $6 billion in additional spending over the next decade. Indeed, while adding nearly 1 million new workers to the economy is significant in absolute terms, it is a modest increase to employment and national income. The budgetary effects are similarly meaningful in absolute terms, though modest relative to the scale of federal budgetary flows over the next decade. Nevertheless, the positive budgetary effects of allowing these new workers to participate in the U.S. economy (And pay taxes) somewhat exceeds the estimated one-time cost of backlog reduction.
An alternative approach would be a bottom-up estimate that relies on the marginal fiscal effect of new immigrants. For this approach, this estimate looks beyond just new workers but rather estimates how many new immigrants would be added to the U.S. economy under Staffing Scenario 1. For this specification, this estimate combines the number of new family-based, employment-based, and humanitarian-based estimated to be approved annually under Staffing Scenario 1. This approach yields an estimated 2.7 million new immigrants in the U.S. economy by FY2026. To estimate the fiscal impact of this approach, this analysis relies on the National Academies fiscal estimates for immigrants.[36] It is important to note that on a per capita basis, every American is presently a fiscal drag on average to the extent that the United States is running a deficit. Fundamentally, the United States spends more on public goods than it collects in taxes. This does not universally hold true, however. The National Academies found that for first generation immigrants, the marginal federal fiscal effect is positive, with such immigrants paying $7,117 in taxes against $6,154 in the consumption of federal public goods, for a net effect of $963. Adjusted for inflation, this assumption suggests that Staffing Scenario 1 could yield about $33 billion in deficit reduction, more than enough to fund the staffing costs over the next decade, though this is very much an upper bound.
Conclusion
USCIS acts as an official gatekeeper for the domestic employment market. Immigrants must be authorized by USCIS to participate in the U.S. economy. That gatekeeping exercise is often brief, requiring on average less than an hour’s time for a USCIS official to approve an immigrant’s benefit application. Yet this transaction occurs millions of times a year, such is the demand for participation in the U.S. economy. Improving this process and clearing out the current backlog would ultimately yield positive economic and fiscal benefits. Indeed, the additional economic activity could more than pay for the one-time cost of backlog reduction. Basic math suggests it would be in the nation’s best interest to accelerate the entrance of these new participants who are currently being held up by administrative delays.
[1] https://www.dhs.gov/sites/default/files/2022-07/2022%20CIS%20Ombudsman%20Report_verified_medium_0.pdf
[2] https://www.federalregister.gov/documents/2020/08/03/2020-16389/us-citizenship-and-immigration-services-fee-schedule-and-changes-to-certain-other-immigration
[3] https://www.govinfo.gov/content/pkg/FR-2016-10-24/pdf/2016-25328.pdf
[4] https://www.dhs.gov/sites/default/files/2022-06/CIS%20OMBUDSMAN_2022_FEE_FOR_SERVICE_RECOMMENDATION_FINAL.pdf
[5] https://www.uscis.gov/tools/reports-and-studies/immigration-and-citizenship-data?topic_id%5B%5D=33700&ddt_mon=&ddt_yr=&query=&items_per_page=10
[6] https://www.uscis.gov/sites/default/files/document/data/Quarterly_All_Forms_FY2022_Q2.pdf
[7] https://www.dhs.gov/sites/default/files/publications/dhs_2021_ombudsman_report_med_508_compliant.pdf
[8] https://www.dhs.gov/sites/default/files/2022-07/2022%20CIS%20Ombudsman%20Report_verified_medium_0.pdf
[9] https://docs.house.gov/meetings/JU/JU01/20200729/110946/HHRG-116-JU01-Wstate-RandD-20200729-U1.pdf
[10] https://www.dhs.gov/sites/default/files/2022-07/2022%20CIS%20Ombudsman%20Report_verified_medium_0.pdf; https://www.uscis.gov/newsroom/news-releases/uscis-announces-new-actions-to-reduce-backlogs-expand-premium-processing-and-provide-relief-to-work
[11] https://docs.house.gov/meetings/AP/AP15/20220406/114604/HHRG-117-AP15-20220406-SD001.pdf
[12] https://federalnewsnetwork.com/workforce/2022/06/uscis-sets-ambitious-hiring-processing-goals-to-shrink-massive-immigration-case-backlog/
[13] https://docs.house.gov/meetings/AP/AP15/20220406/114604/HHRG-117-AP15-20220406-SD001.pdf
[14] https://www.dhs.gov/sites/default/files/2022-07/2022%20CIS%20Ombudsman%20Report_verified_medium_0.pdf
[15] https://www.gao.gov/assets/gao-21-529.pdf
[16] Ibid.
[17] https://www.uscis.gov/records/electronic-reading-room
[18] https://docs.house.gov/meetings/JU/JU01/20200729/110946/HHRG-116-JU01-Wstate-RandD-20200729-U1.pdf
[19] https://www.dhs.gov/sites/default/files/2022-07/2022%20CIS%20Ombudsman%20Report_verified_medium_0.pdf
[20] Author’s calculations
[21] Ibid.
[22] https://www.gao.gov/assets/gao-21-529.pdf
[23] The agency reported the time it takes immigration officers to process a given application by form type. This analysis uses a weighted average completion rate to determine a service-wide rate. The estimated completion rate is 0.8345 completions per adjudication hour.
[24] https://www.opm.gov/policy-data-oversight/pay-leave/pay-administration/fact-sheets/computing-hourly-rates-of-pay-using-the-2087-hour-divisor/#:~:text=Using%202%2C087%20as%20the%20average,year%20fluctuations%20in%20work%20hours.
[25] $299,808.2, which is calculated by dividing the FY2023 appropriation request by the number of new FTEs it would fund. While this measure exceeds just pay and benefits, it appropriately incorporates additional costs not simply captured by payroll expense.
[26] https://www.dhs.gov/sites/default/files/2022-03/U.S.%20Citizenship%20and%20Immigration%20Services_Remediated.pdf
[27] https://www.cbo.gov/data/budget-economic-data#4
[28] To measure robustness, two additional scenarios with alternative utilization rates were estimated for staffing Scenario 1. The first alternative assumed the agency-wide utilization rate of 15 percent. Under this alternative, it would take until FY2028 to eliminate the backlog at a cost of about $4.8 billion. The second alternative assumes a utilization rate that is double that of the agency’s adjudication operations. Under this alternative, the 3,014 new hires could eliminate the backlog by FY2024 at a cost of about $1.8 billion.
[29] https://www.dhs.gov/sites/default/files/2022-03/U.S.%20Citizenship%20and%20Immigration%20Services_Remediated.pdf
[30] https://www.uscis.gov/sites/default/files/document/data/Quarterly_All_Forms_FY2022_Q2.pdf
[31] Note that LPR applications are at times included partially in employment-based and humanitarian-based applications data.
[32] Importantly, not all completed applications are approved. Historically, 9.2 percent of applications are denied. This analysis deducts this proportion of completed applications from the employment figures.
[33] https://www.bls.gov/charts/employment-situation/employment-population-ratio.htm
[34] https://www.cbo.gov/data/budget-economic-data#4
[35] https://www.cbo.gov/publication/57980
[36] https://nap.nationalacademies.org/catalog/23550/the-economic-and-fiscal-consequences-of-immigration
