Research
June 11, 2021
The Cost of Clean Generation
Executive Summary
- The Biden Administration’s Nationally Determined Contribution submission to the United Nations climate agreement calls for all carbon emissions to be removed from electricity generation by 2035.
- Democratic leadership of the House Energy and Commerce Committee has introduced the CLEAN Future Act, which includes the same goal and thus serves as a model for the administration’s potential intentions moving forward.
- By considering two scenarios, one where all fossil fuel generation is eliminated and another where carbon capture technology is applied to natural gas combined-cycle facilities, it is possible to estimate the cost of achieving this goal.
- The analysis finds that meeting this goal requires approximately $2 trillion of investment in capital and operations and maintenance costs, an unprecedented amount that would result in an additional $1075 per year cost for consumers.
Introduction
Following President Biden’s executive order in January, the United States rejoined the Paris Climate Agreement. The United States initially joined the agreement under President Obama, but President Trump then withdrew the United States from it. Recently, President Biden submitted the United States’ second Nationally Determined Contribution (NDC) to the United Nations (UN) in adherence with the agreement, as the NDC sets out the United States’ targets for emissions reductions. The Obama Administration called for the reduction of greenhouse gas emissions by 26 to 28 percent by 2025 relative to 2005 levels. The Biden Administration has substantially increased the NDC’s goals, as it now calls for reducing greenhouse gas emissions by 50 to 52 percent by 2030 when compared to 2005 emissions levels. In addition, the NDC provides that by 2035 the United States will produce “100 percent carbon pollution-free electricity.”[1] The effort to reduce emissions to combat climate change is estimated to provide many benefits globally but will inevitably result in costs that are borne domestically.
While the administration has committed to the goal provided in the NDC, Congress has not passed legislation aiming to meet these goals. This analysis focuses on the costs associated with implementing the provisions of the Climate Leadership and Environmental Action for our Nation’s (CLEAN) Future Act, a bill introduced by the Democratic members of the Energy and Commerce Committee that addresses climate change by codifying a net-zero economy by 2050. The bill specifically aims to eliminate greenhouse gas emissions from the electricity generation sector by 2035 through a clean electricity standard, as discussed in an earlier AAF analysis.[2]
Policies Underlying the NDC
The goals in the newly submitted NDC are based on a sector-by-sector analysis. Similarly, the CLEAN Future Act includes provisions that impact various sectors that contribute to national greenhouse gas emissions.
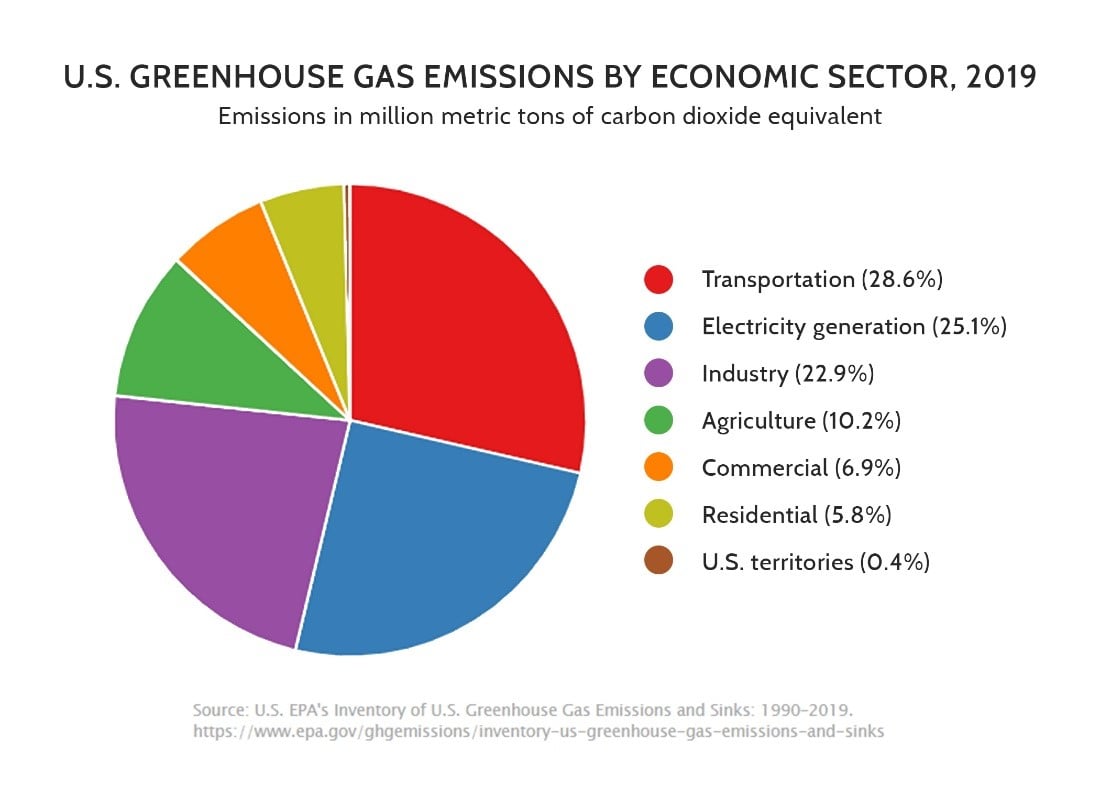
In the United States, emissions in 2019 were 17 percent lower than in 2005. Global emissions, however, are projected to continue growing throughout the next decade. The contribution of emissions by industry within the United States is illustrated in the chart below, which indicates that electric generation contributes 25.1 percent of emissions—the second-highest level of any sector.[3]
Emissions within the electricity generation sector can be attributed to coal and natural gas fired power plants, as well as the use of petroleum products to meet peak demand.[4] The analysis that follows intends to quantify the possible cost of eliminating those emissions. The analysis is not exhaustive and serves to highlight issues in attaining a “100 percent carbon pollution-free electricity” industry. In particular, the analysis considers employing existing generation technologies to meet the goal and their potential costs in the long term.
Assumptions
The analysis quantifies the potential costs associated with the goals established by the Biden Administration in the NDC by applying the policies provided in the CLEAN Future Act that address electricity generation to define the administration’s interpretation of clean energy development. The NDC, like the CLEAN Future Act, calls for the continued use of carbon-emitting power generation with the addition of carbon capture technology.
There are currently no operating generation facilities in the United States using carbon capture technology. In addition, existing carbon capture technology only captures 90 percent of emissions, suggesting that generators would be forced to offset with direct air capture. As a result, this analysis applies two assumptions. First, the installation of carbon capture technology at coal, petroleum, and natural gas-fired facilities would be prohibitive, and these facilities would no longer be in service by 2035. Second, the installation of carbon capture technology would only be feasible at natural gas combined-cycle generators while the remainder of natural gas, coal, and petroleum facilities are retired.
In addition, the CLEAN Future Act defines a clean energy project as one that “is anticipated to generate electricity without emitting greenhouse gases, such as wind, solar, nuclear, hydropower, and geothermal energy; or stores energy.”[5] The analysis assumes that any additional generation capacity will be limited to these technologies. The analysis thus further assumes that wind power is onshore and that both wind and solar power are coupled with battery storage. The analysis assumes that all electrical storage capacity will be large-scale lithium-ion batteries that are connected to the electrical grid rather than a distribution network. In keeping with the growing trend of co-locating storage facilities alongside renewable resources, 2 MW of either wind or solar capacity will be paired with 1 MW of storage capacity.[6] Batteries are assumed to deliver electricity for four hours.
Due to the expense of constructing and operating traditional nuclear facilities and the lack of commercialized advanced nuclear facilities, the additional nuclear capacity in the analysis will be limited. A small modular reactor (SMR) produced by Nuscale that is to be implemented at the Department of Energy’s Idaho National Laboratory is expected to provide 720 megawatts (MW) to the Utah Associated Municipal Power Systems in about five years. The reactor will serve as an experimental facility to identify improvements for broader deployment of SMR technology.[7] Microreactors, an advanced nuclear technology currently under review by the Nuclear Regulatory Commission, may be deployed in the next 20 years, but with nameplate capacity around 1 MW they would have to be deployed on a large scale to impact total generating capacity. As a result, they are not included in this analysis.[8]
The Department of Energy estimates that 12,000 MW of additional hydropower generating capacity could be attained by powering some of the 80,000 dams in the United States built for non-energy purposes. The analysis assumes that all this potential capacity is developed by 2035. Since hydroelectric pumped storage typically consumes more electricity than it produces, resulting in negative generation capacity, additional facilities will not be included in the analysis.[9]
The United States Geological Service has estimated that an additional 30,033 MW of geothermal energy could be generated in the United States by tapping into geological formations with appropriate conditions.[10] Similarly, the analysis will assume that all potential geothermal generating capacity is developed by 2035.
Resources the Energy Information Administration (EIA) categorizes as “wood and wood-derived products,” “other biomass,” “other gases,” and “other energy sources” are not included within the scope of the analysis because they are not explicitly included within the language of the CLEAN Future Act and each contribute less than 1 percent of current generating capacity. Collectively, all those resources contribute about 2 percent of generating capacity.
Analysis
The EIA provides data for generating capacity, electricity produced, and the capacity factor for each generation technology. This analysis combines data for actual generating capacity in 2019 with the cost and performance characteristics of new central station electricity generating technologies included in the EIA’s 2021 Annual Energy Outlook (AEO).[11] The AEO also projects that the average annual growth rate for electricity demand through 2050 will be about one percent while generation capacity will grow by about 13 percent.[12] Additional changes to the generation mix by 2035 are estimated to result in 1,388.6 gigawatts (GW) of capacity and result in 4.6 billion megawatt hours (MWh) of electricity, according to the AEO.
In the scenario where all coal, natural gas, and petroleum resources—about 60 percent of utility-scale electricity generation—are retired, baseload capacity must be replaced.[13] Assumptions fix the capacity of nuclear geothermal and hydroelectric resources, and as a result, the solar, wind, and storage resources are left to fill the large capacity gap left. In this case, the intermittency of a majority of the relied-upon resources in use may lead to battery overbuilding in order to ensure that even in the most unfavorable circumstances electricity is flowing.
These resources could be deployed in various quantities leading to a range of potential costs. Variation is driven by each technology’s capacity factor. A capacity factor represents the resources performance over time by comparing the potential electricity produced to what was actually produced. Generation resources, such as nuclear, coal, and petroleum, have relatively high capacity factors. Renewable technologies, particularly solar and wind, have relatively low capacity factors. While high capacity-factor resources, such as nuclear power, are nearly constantly generating electricity with the exception of maintenance events, low capacity-factor resources, such as solar, are dependent on external conditions; for example, solar resources can only operate during daytime and perform best when there is little cloud cover. For this reason, replacing a coal plant with a 100 MW capacity with a solar array with a 100 MW capacity will not result in the necessary electricity.
The table below shows the potential costs associated with the first scenario where fossil fuels are eliminated from the generation mmix. In this permutation, estimated wind and solar capacity are nearly equal. Costs tend to increase when one resource is increasingly chosen over the other. The total investment necessary to develop all of the generation capacity is approximately $2 trillion. For the next 14 years, approximately $152 billion would need to be spent annually.
Scenario 1 – All Fossil Fuel Retired by 2035
| Resource | Additional Capacity (MW) | Total Overnight Cost | Total Variable O&M Costs/year | Total Fixed O&M Costs/year |
| Natural Gas w/CC | – | – | – | – |
| Solar | 450,000 | – | $3.3 billion | |
| Wind | 500,000 | $877 billion | – | $4.3 billion |
| Battery Storage | 475,000 | – | $9.5 billion | |
| Nuclear | 720 | $4.9 billion | $17 million | $64 million |
| Geothermal | 30,033 | $83 billion | $214 million | $2.8 billion |
| Hydropower | 12,000 | $54 billion | $60 million | $207 million |
| Subtotal | $2.1 trillion | $292 million | $20 billion | |
| Total | $2.13 trillion ($153 billion spent annually over 14 years) | |||
An alternate scenario has the natural gas combined-cycle facilities continuing to operate but with the addition of carbon capture technology. With the CLEAN Future Act’s potential creation of a clean electricity standard, existing industry participants who own assets that are still economically viable, such as relatively new natural gas-fired power plants, may install carbon capture technology in order to maintain operation of their assets.
Generally, this alternative could require a smaller total investment of $1.8 trillion, as shown in the table below. Combined-cycle plants have a 57.3 percent capacity factor and result in the reliance on fewer low capacity-factor resources to maintain the same amount of electricity. The operations and maintenance costs of these facilities, however, are considerably higher than those of other generation resources.
Scenario 2 – Natural Gas Combined-Cycle Fleet Adopts Carbon Capture
| Resource | Assumed Capacity (MW) | Total Overnight Cost | Total Variable O&M Costs per year | Total Fixed O&M Costs per year |
| Natural Gas w/CC | 264,000 | $528 billion | $14.6 billion | $9.1 billion |
| Solar | 190,000 | $256 billion | – | $1.5 billion |
| Wind | 300,000 | $553 billion | – | $2.7 billion |
| Battery Storage | 245,000 | $285 billion | – | $5.2 billion |
| Nuclear | 720 | $4.8 billion | $ 2.4 billion | $64 million |
| Geothermal | 30,033 | $83 billion | $232 million | $2.8 billion |
| Hydropower | 12,000 | $54 billion | $463 million | $207 million |
| Subtotal | $1.77 trillion | $17 billion | $21.6 billion | |
| Total | $1.8 trillion ($128 billion spent annually over 14 years) | |||
In addition, carbon capture does not currently capture 100 percent of greenhouse gas emissions. As a result, direct air capture technologies would need to be employed in order to capture the released emissions. The price of direct air capture is estimated to be between $94 and $232 per ton of CO2.[14] In 2019, 560 million tons of CO2 were emitted from natural gas generation. If 95 percent of those emissions are captured at the facility and only five percent are extracted by direct air capture, a cost of $2.6 billion is created using $94 per ton of CO2 price.[15]
The level of investment necessary to achieve “100 percent carbon pollution-free electricity” is unprecedented. According to Bloomberg New Energy Finance, in 2020, U.S. investment in renewable capacity was $49.3 billion while globally it was $303.5 billion.[16] Investment in all generation facilities amounted to $408.35 billion globally in 2020.[17] This analysis, finding that these goals would cost at least $164 billion each year, suggests that the United States would need to invest at least three times as much in renewable capacity—per year—as it did in 2020 to achieve the Biden Administration’s commitment. And on a macro level, the prices of renewable energy technologies may increase in response to the elevated demand created by legislation such as the CLEAN Future Act.
Costs may prove to be higher than estimated in this analysis. Modifications to the generation mix will necessitate further investments in the transmission grid and local distribution systems, costs that are unaccounted for. The analysis does not capture the cost of interest on the capital necessary for construction. It also does not capture the cost of replacement facilities for those that would be retired by 2035 nor the stranded costs of facilities that are retired.
Geographic factors result in varied prices for the same resource and varied performance at each generating facility. In the analysis the cost of wind generation was calculated using only the costs associated with onshore wind facilities, which are significantly lower than those offshore. Similarly, the highest capacity factors were associated with generation resources, despite varied performance among, for example, solar technology.
Cost to Consumers
The cost of new generation as well as transmission and distribution facilities will be borne by the consumer. Utilities, municipalities, and cooperatives pass on the cost in the form of higher rates leading to higher monthly utility bills for households and businesses. These rates are based on the value of capital invested in the construction and operation of a generation facility in addition to a reasonable return on investment. The return on investment is typically around 10 percent. As a result, the total cost incurred by the consumer will be even higher, an additional $200 billion over the lifetime of the assets.
In 2019, the average monthly bill in the United States was between $75 and $168 per state while average retail prices spanned from 0.25 cents/kWh to 124.69 cents/kWh.[18] By employing the levelized cost of energy for each generating technology at the lowest unsubsidized value within its range, this analysis found that on an annual basis consumers would see an additional $1,075 per year of costs. On a monthly basis, this sum would equal about $90 should the United States retire all fossil fuel generators by 2035. This value is based on an estimated 160 million retail customers, of which EIA estimates 138 million will be residential customers in 2035. With the broad range of electricity prices and variation in consumption among consumers, the individual impact will vary. Additional costs will be associated with transmission and distribution modifications, and the treatment of stranded assets will vary by state.
Conclusion
By approaching the administration’s NDC goals with simple definitions and policy considerations from the CLEAN Future Act, it is possible to roughly estimate the cost of transitioning to “100 percent carbon pollution-free electricity” by 2035. The goal calls for approximately $2 trillion of capital investment and annual operations and maintenance costs in addition to what is already spent in the industry to maintain existing assets. It would be necessary to increase investment in generation by 300 percent in the coming 14 years and potentially increase utility costs by $1,075 per year by 2035.
[1] https://www4.unfccc.int/sites/ndcstaging/PublishedDocuments/United%20States%20of%20America%20First/United%20States%20NDC%20April%2021%202021%20Final.pdf
[2] https://www.americanactionforum.org/insight/the-clean-future-acts-clean-electricity-standard/
[3] https://cfpub.epa.gov/ghgdata/inventoryexplorer/#allsectors/allsectors/allgas/econsect/current
[4] https://www.eia.gov/electricity/annual/html/epa_01_01.html
[5] https://www.congress.gov/117/bills/hr1512/BILLS-117hr1512ih.pdf
[6] https://www.eia.gov/analysis/studies/electricity/batterystorage/pdf/battery_storage.pdf
https://www.nrel.gov/docs/fy21osti/72330.pdf
[7] https://www.reutersevents.com/nuclear/doe-expands-nuscale-smr-plan-quantify-heat-hydrogen-benefits
[8] https://pv-magazine-usa.com/2020/09/28/can-20-people-with-25-million-get-oklos-fast-fission-micro-reactor-to-market/
[9] https://www.energy.gov/sites/prod/files/2013/12/f5/npd_report_0.pdf
https://www.energy.gov/sites/default/files/2021/01/f82/us-hydropower-market-report-full-2021.pdf
[10] https://pubs.usgs.gov/fs/2008/3082/
[11] https://www.eia.gov/electricity/annual/html/epa_04_05.html
https://www.eia.gov/outlooks/aeo/
[12] https://www.eia.gov/outlooks/aeo/electricity/sub-topic-01.php
[13] https://www.eia.gov/energyexplained/electricity/electricity-in-the-us-generation-capacity-and-sales.php
[14] https://www.sciencedirect.com/science/article/pii/S2542435119303162
[15] https://www.eia.gov/tools/faqs/faq.php?id=74&t=11
[16] https://assets.bbhub.io/professional/sites/24/Energy-Transition-Investment-Trends_Free-Summary_Jan2021.pdf
[17] https://www.globenewswire.com/fr/news-release/2021/03/29/2200669/28124/en/Global-Power-Generation-Market-Report-2020-2030-Total-Power-Investment-is-Likely-to-Grow-from-408-35-Billion-in-2020-to-545-Billion-in-2030.html