Research
April 3, 2025
The Costs of “Liberation Day”
Executive Summary
- On April 2, dubbed “Liberation Day,” President Trump announced tariffs on all U.S. trade partners, with rates ranging from a baseline of 10 percent up to 50 percent depending upon the trade deficit with that country; these “reciprocal” tariffs came in addition to 25-percent tariffs on automobiles and compound upon the standing 20-percent tariffs on China and 25-percent tariffs on steel and aluminum.
- The method by which the Trump Administration implemented these reciprocal tariffs imposes larger rates than if the United States had simply matched the weighted average tariffs of other countries or if it had instituted a universal tariff of between 10 and 20 percent.
- Without exemptions, “reciprocal” tariffs alone would cost U.S. consumers and businesses roughly $371.4 billion annually; however, factoring in exempted products and additional tariffs from this year, the cost is between $366.5–391.6 billion, which does not account for trade partner retaliation.
Introduction
On April 2, dubbed “Liberation Day,” President Trump announced tariffs on all U.S. trade partners, with rates ranging from a baseline of 10 percent up to 50 percent depending upon the size of the trade deficit with that country. These “reciprocal” tariffs came alongside 25-percent tariffs on all imports of automobiles and certain automobile components and compound upon the standing 20-percent tariffs on China and 25-percent tariffs on steel and aluminum. The method by which the Trump Administration implemented these reciprocal tariffs imposes larger rates than if the United States had simply matched the weighted average tariffs of other countries or if it had instituted a universal tariff of between 10 and 20 percent.
Without exemptions, “reciprocal” tariffs alone would cost U.S. consumers and businesses roughly $371.4 billion annually; however, factoring in exempted products and additional tariffs from this year, the cost is between $366.5–391.6 billion. This does not account for U.S. tariff actions sparking retaliation from trade partners that could escalate a global trade war not seen since the Great Depression and have ripple effects that further impact the U.S. economy.
Lead-up to “Liberation Day”
The initial intention of “Liberation Day” was to implement “reciprocal tariffs,” import duties designed to match the tariff and non-tariff barriers of other countries. The groundwork for these tariffs was initially outlined in the White House’s February 13 memorandum, which detailed the president’s “Fair and Reciprocal Plan” for U.S. trade policy. Two approaches for these tariffs included country-level reciprocity in which a uniquely calibrated tariff rate would be applied to each affected country and product-level reciprocity in which products from every country are given unique tariff rates to allow for more precision and therefore more reciprocity. Other predictions for what these tariffs might have resembled included a tiered system that sorted countries into tariff brackets based on trade barriers and hit them with either a 10- or 20-percent universal tariff. Each of these predictions was proven to be incorrect, however, with the announcement of a far less precise and large-scale tariff regime that, definitionally speaking, is not reciprocal.
The Implementation of “Liberation Day” Tariffs
The announced tariffs came as a surprise to many trade policy experts due to the unanticipated scale of tariff rates and the method used to calculate a rate that factors in non-tariff barriers. Many countries were given a separate tariff rate as outlined in the reciprocal tariff approach. Yet these were not based on countries’ weighted average tariffs on the United States. Instead, the administration decided the best way to price trade barriers was by factoring in the U.S. trade deficit with each country. To calculate the sum of tariff and non-tariff trade barriers other countries apply to U.S. goods – a category labeled “tariffs charged to the U.S.A.” – the U.S. trade deficit with a country was divided by the total imports from that country. This “tariff” rate was finally divided by two to come up with the “discounted” tariff rate the United States would place on that country in response. This approach seems to consider trade deficits as direct evidence that another country is engaging in unfair trade practices or has trade barriers in place. This is not the case, however. If it were, the United States would have unfair trade barriers on the 132 countries with which it has a trade surplus. Trade surpluses and trade deficits instead represent consumer decisions and comparative advantages more so than trade barriers that significantly stifle U.S. exports.
The “Liberation Day” tariffs were imposed via an executive order that declared the overall U.S. trade deficit a threat to national security to justify the use of the International Emergency Economic Powers Act (IEEPA). The IEEPA authority has already been used to impose tariffs on China, Mexico, and Canada during the first months of the administration, despite it being a previously untested pathway for such an action. President Trump justified the use of IEEPA by arguing that the United States’ small agricultural trade deficit constitutes a national emergency of significant enough scale to pursue a broad tariff agenda. It is also worth noting the same executive order made a soft directive to end de minimis for all packages once Customs and Border Protection has enough to enforce such an action.
These new tariff rates are expected to stack on top of any previously declared tariffs, such as the 20-percent tax on China, but will be separate from Section 232 tariffs, such as those on steel, aluminum, and automobiles.
The Trump Administration issued an additional executive order to end de minimis for packages from China, meaning into the United States will no longer be eligible for entry free from fees and tariffs. As for Mexico and Canada, certain imports will be able to enter via the United States-Mexico-Canada free trade agreement, but it is unclear exactly how many goods will still be subject to new tariffs.
Figure 1: Comparison of Trump’s April 2 Tariffs and True Reciprocity
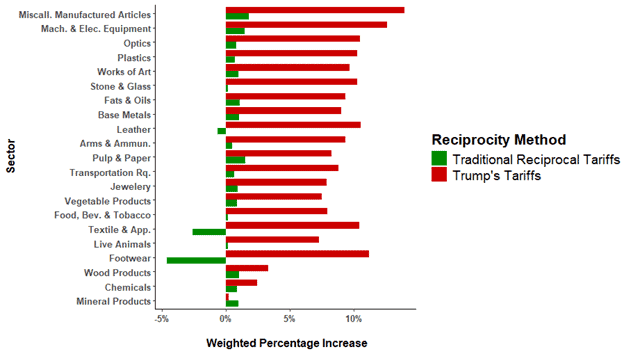
Sources: Feodora Teti’s Global Tariff Database (v_beta1-2024-12) from Teti (2024), U.S. International Trade Commission DataWeb, World Bank WITS Database, Annex I of April 2 EO, Annex II of April 2 EO
Impact and Cost Estimates of “Liberation Day”
If the “reciprocal” tariffs were applied across the board to imports from each impacted country, the estimated cost would be roughly $371.4 billion in the first year of implementation. The April 2 executive order did not cover all products, leaving holdouts for automobiles, copper, lumber, and various other sectors, meaning $2.7 trillion in commodities or 80 percent of 2024 imports were covered. Factoring in exempted products, this research estimates that tariffs on these goods will create $283.3 billion in new tax liabilities annually. This cost estimate is more than 10-times higher than the $26.3 billion predicted from a true tariff match and demonstrates that the administration prices non-tariff barriers at between 15–20 times costlier than tariff barriers.
Figure 3 displays the most import-reliant commodities in the United States by calculating the share of the product supply that come from imports. This gives a rough estimate of what commodities will be most impacted by recent tariffs, with Figure 6 in the appendix showing which industries are most reliant on these imported commodities. The total value of imported commodities used by these industries ranges from hundreds of millions to billions of dollars, making up a significant share of total industry use. Domestic U.S. industries will see increased costs that they will either absorb or pass on to consumers, making these businesses less competitive and more likely to reduce costs by lowering investment or wages. For example, electronic computer manufacturing is nearly 60 percent import reliant and some of the major industries that use this commodity are in the automotive industry, as Figure 6 shows. This means that rising electronic commodity prices will negatively impact and raise inputs costs for U.S. car manufacturers, which runs counter to the administration’s desire to assist U.S. automakers.
Figure 2: Estimated Costs of Recent Tariffs
|
Tariff |
Estimated Cost ($ billions) |
| Liberation Day Tariffs (No Exemptions) |
$371.4 |
| Liberation Day Tariffs (Exemptions) |
$283.3 |
| 25-Percent Tariffs on Automobiles and Auto Parts |
$31.0 to $56.2 |
| 25-Percent Tariffs on Steel and Aluminum |
$6.5 |
| 20-Percent Tariffs on China |
$45.7 |
|
Total |
$366.5 to $391.6 |
Figure 3: Top 10 Commodities by Import Share of Product Supply
|
Commodity |
Imports as a Percent of Total Product Supply (Purchaser Prices) |
|
| Electronic computer manufacturing |
58% |
|
| Computer terminals and other computer peripheral equipment manufacturing |
58% |
|
| Speed changer, industrial high-speed drive, and gear manufacturing |
51% |
|
| Fishing, hunting and trapping |
50% |
|
|
Alumina refining and primary aluminum production |
|
|
| Nonferrous metal (except aluminum) smelting and refining |
49% |
|
| Broadcast and wireless communications equipment |
49% |
|
| Institutional furniture manufacturing |
48% |
|
| Audio and video equipment manufacturing |
46% |
|
| Biological product (except diagnostic) manufacturing |
44% |
Source: BEA Interactive Data Application 2017
Appendix and Methods:
To estimate this exact cost of President Trump’s “Liberation Day” tariffs, this research first took all U.S. imports at the HTS8 level and removed the 1,039 of 10,908 potential codes that the administration exempted from its universal tariffs. This left approximately 80 percent of U.S. import volume in 2024. After removing the commodities not included in the executive order, we aggregated import volumes to the sector level for each economy. Although this aggregation theoretically misses some pre-existing high HTS8-level tariffs, the enormous difference between existing tariff rates and the “Liberation Day” rates means that this effect is minimal.
Once we aggregated import volumes, we adjusted for existing tariff rates as of 2021, a 15-percent evasion rate, and 25-percent non-collection rate. We did not remove Mexico and Canada from our numbers given the administration’s aggressive language and unclear direction on which products still qualify for exemption under the United States-Mexico-Canada Agreement.
Figure 4: Weighted Percentage Increase of April 2 Tariffs by Sector
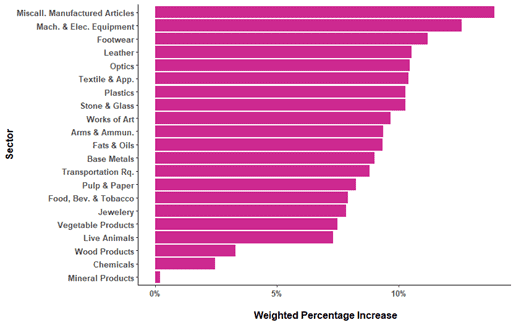
Sources: Feodora Teti’s Global Tariff Database (v_beta1-2024-12) from Teti (2024), U.S. International Trade Commission DataWeb, World Bank WITS Database, Annex I of April 2 EO, Annex II of April 2 EO
Figure 5: Tax Liability in Millions by Sector of April 2 Tariffs
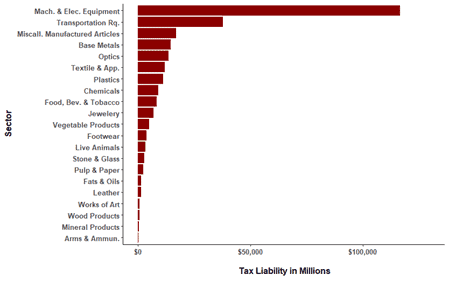
Sources: Feodora Teti’s Global Tariff Database (v_beta1-2024-12) from Teti (2024), U.S. International Trade Commission DataWeb, World Bank WITS Database, Annex I of April 2 EO, Annex II of April 2 EO
Figure 6: Industry Use of Import Reliant Commodities
| Commodity Description | Top Five Industry Uses | Industry Use $ (millions) |
| Electronic computer manufacturing (334111) | ||
| Other crop farming (111900) |
$72 |
|
| Computer terminals and other computer peripheral equipment manufacturing (334118) |
$542 |
|
| Automobile manufacturing (336111) |
$103 |
|
| Light truck and utility vehicle manufacturing (336112) |
$692 |
|
| Management of companies and enterprises (550000) |
$131 |
|
| Computer terminals and other computer peripheral equipment manufacturing (334118) | ||
| Other real estate (531ORE) |
$922 |
|
| Management consulting services (541610) |
$961 |
|
| Management of companies and enterprises (550000) |
$1,643 |
|
| Services to buildings and dwellings (561700) |
$994 |
|
| State and local government (educational services) (GSLGE) |
$937 |
|
| Speed changer, industrial high-speed drive, and gear manufacturing (333612) | ||
| Construction machinery manufacturing (333120) |
$288 |
|
| Motor vehicle transmission and power train parts manufacturing (336350) |
$2,158 |
|
| Machinery, equipment, and supplies (423800) |
$235 |
|
| Waste management and remediation services (562000) |
$389 |
|
| Commercial and industrial machinery and equipment repair and maintenance (811300) |
$496 |
|
| Fishing, hunting and trapping (114000) | ||
| Animal (except poultry) slaughtering, rendering, and processing (31161A) |
$1,143 |
|
| Seafood product preparation and packaging (311700) |
$6,285 |
|
| Food and beverage stores (445000) |
$818 |
|
| Full-service restaurants (722110) |
$2,635 |
|
| Limited-service restaurants (722211) |
$2,559 |
|
| Alumina refining and primary aluminum production (331313) | ||
| Secondary smelting and alloying of aluminum (331314 |
$805 |
|
| Aluminum product manufacturing from purchased aluminum (33131B) |
$9,560 |
|
| Nonferrous metal foundries (331520) |
$1,339 |
|
| Metal can, box, and other metal container (light gauge) manufacturing (332430) |
$1,082 |
|
| Military armored vehicle, tank, and tank component manufacturing (336992) |
$1,250 |
|
| Nonferrous metal (except aluminum) smelting and refining (331410) | ||
| Iron and steel mills and ferroalloy manufacturing (331110) |
$3,509 |
|
| Nonferrous metal (except aluminum) smelting and refining (331410) |
$4,273 |
|
| Copper rolling, drawing, extruding and alloying (331420) |
$8,081 |
|
| Nonferrous metal (except copper and aluminum) rolling, drawing, extruding and alloying (331490) |
$3,800 |
|
| Storage battery manufacturing (335911) |
$2,214 |
|
| Broadcast and wireless communications equipment (334220) | ||
| Broadcast and wireless communications equipment (334220) |
$2,049 |
|
| Search, detection, and navigation instruments manufacturing (334511) |
$2,352 |
|
| Aircraft manufacturing (3364110) |
$9,780 |
|
| Data processing, hosting, and related services (518200) |
$2,113 |
|
| Federal general government (defense) (S00500) |
$7,118 |
|
| Institutional furniture manufacturing (337127) | ||
| Office and commercial structures (2332A0) |
$35 |
|
| Other nonresidential structures (2332D0) |
$251 |
|
| Institutional furniture manufacturing (337127) |
$35 |
|
| Outpatient care centers (621400) |
$49 |
|
| Other ambulatory health care services (621900) |
$153 |
|
| Audio and video equipment manufacturing (334300) | ||
| Audio and video equipment manufacturing (334300) |
$215 |
|
|
Automobile manufacturing (336111) |
$267 |
|
| Light truck and utility vehicle manufacturing (336112) |
$2,130 |
|
| Motor vehicle and parts dealers (441000) |
$142 |
|
| Federal general government (nondefense) (S00600) |
$325 |
|
| Biological product (except diagnostic) manufacturing (325414) | ||
| Pharmaceutical preparation manufacturing (325412) |
$41,581 |
|
| In-vitro diagnostic substance manufacturing (325413) |
$4,694 |
|
| Biological product (except diagnostic) manufacturing (325414) |
$7,696 |
|
| Outpatient care centers (621400) |
$7,460 |
|
| Medical and diagnostic laboratories (621500) |
$6,057 |
Source: BEA Interactive Data Application