Research
May 10, 2018
The Impact of Chinese Retaliatory Tariffs
Executive Summary
- In response to recent tariffs announced by the United States, China has imposed retaliatory tariffs on approximately $53 billion of U.S. exports
- These tariffs will apply to a wide-ranging list of U.S. exports. Products will be significantly impacted both if they are exported to China in large amounts (i.e. a high dollar value) and if they are exported to China in higher quantities than to other nations (i.e. a high percentage). Using both of these metrics, the most affected exports include soybeans, aluminum scrap and waste, grains, and other agricultural products.
- In term of absolute dollars, Louisiana, Washington, and Texas will have the most exports facing new tariffs. Meanwhile, Hawaii, North Dakota, and Washington send the highest proportion of their exports to China, meaning the tariffs will especially impact them, as well.
Background
On March 23, President Trump imposed a broad 25 percent tariff on steel imports and 10 percent tariff on aluminum imports. These tariffs followed two Section 232 investigations launched by the president into the national security implications of steel and aluminum imports. While the investigations concluded that these imports do threaten national security and that broad tariffs were the correct solution, the Department of Defense did not support these conclusions.
The president has also suggested that the tariffs were intended to protect domestic industry from foreign competition. In particular, he indicated the tariffs would protect domestic manufacturers from foreign “dumping” – the process of exporting underpriced goods (often due to government subsidies in the exporting nation) to foreign countries. Because China supplies half of the world’s steel and nearly half of the world’s aluminum, the tariffs primarily targeted putatively underpriced steel and aluminum sold by Chinese producers.
Today, tariffs on steel and aluminum affect $17.5 billion of U.S. imports, with $2.9 billion of that total coming from China. South Korea and Argentina have both earned permanent exemptions, but if current exemptions for Canada, Mexico, the European Union, and other nations are not also made permanent, the tariffs will affect $42.8 billion of U.S. imports. In response to these tariffs, China imposed retaliatory tariffs on approximately $3 billion of U.S. exports, ranging from steel and aluminum to agricultural products such as fruits, nuts, and wine.
On April 3, the United States released an additional list of over 1,300 Chinese imports (valued at $46.2 billion) that could be subject to a new 25 percent tariff as early as this June. The release of this list follows a separate investigation (called Section 301) that the Trump Administration launched into unfair Chinese trade practices, particularly forced technology transfer. The tariffs were largely aimed at protecting industries with sensitive U.S. technology that are most vulnerable to intellectual property (IP) theft. In response, China released its own list of U.S. products – also accounting for about $50 billion – that will face a 25 percent import tax in the event that the Section 301 tariffs are enacted.
Previous American Action Forum research found that U.S. tariffs on steel and aluminum imports could increase nationwide consumer costs by $3.4 billion to $8.2 billion, and the tariffs on specific Chinese products could raise consumer costs by $11.5 billion. Retaliation from China will further increase the amount consumers can be expected to pay, as retaliation will both increase the cost of imports and shift production to the United States. This paper aims to gauge how Chinese retaliation will affect both individuals and industries across the country.
The Impact of Chinese Retaliation
China released two lists of U.S. products that will face retaliatory tariffs. The first was in response to Section 232 tariffs on steel and aluminum (which are already in effect) and the second was in response to Section 301 tariffs counteracting China’s unfair trade practices. Taken together, these tariffs will expose approximately $53 billion of U.S. exports to new taxes from China.
This paper break downs the impact of Chinese retaliatory tariffs in all 50 states. For this study, the products outlined in the lists released by China are matched with U.S. classifications of the same products. This study then uses data from the U.S. Census Bureau to find the dollar value of U.S. exports from each state that will be exposed to new tariffs, based on 2017 export levels.
Due to limited data availability, this analysis underestimates the total impact of Chinese retaliation. While China announced tariffs on $50 billion of U.S. exports in response to Section 301 tariffs, only $33 billion of those exports could be identified. Similarly, data was missing for approximately $0.6 billion of exports that are already subject to retaliation for Section 232 tariffs on steel and aluminum.
The underlying data used in the following analysis can be found in an Excel spreadsheet here.
The map below displays the value of each state’s exports that will be exposed to new tariffs from China. The only exports that will be affected are those specifically identified by the Chinese. Therefore, “targeted products” refers to all U.S. products identified by China and thus facing tariffs. The map also compares the value of exports facing tariffs (i.e. targeted products exported to China) with the total value of exports for these products (i.e. targeted products exported worldwide). The resulting percentage describes what proportion of the products identified by the Chinese tariff lists are actually exported to China.
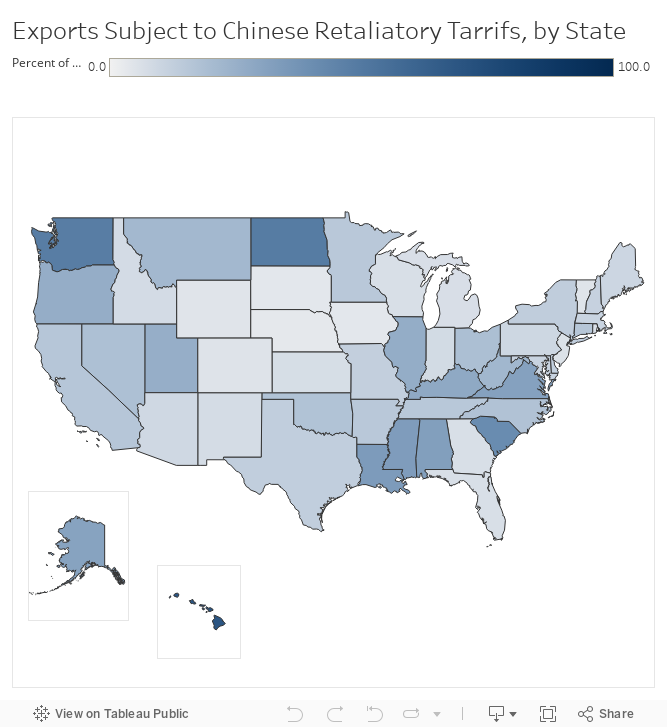
Ten states will face tariffs on over $1 billion of their exports. The state with the highest value of exports affected is Louisiana ($6.0 billion), followed by Washington ($5.3 billion) and Texas ($4.0 billion). Additionally, for 15 states, the share of exports sent to China comprises more than 20 percent of all exports of those products. Hawaii has the most, with 70 percent of the products facing tariffs exported to China, followed by North Dakota with 49 percent and Washington with 48 percent.
Table 1 below displays the top ten states most affected by Chinese retaliation. This is measured by the overall value of exports that will be impacted by new tariffs, based on 2017 levels.
Table 1: States Most Affected by Chinese Retaliatory Tariffs
|
State |
Total Value of Exports Affected by New Tariffs |
|
Louisiana |
$6.0 B |
|
Washington |
$5.3 B |
|
Texas |
$4.0 B |
|
California |
$4.0 B |
|
Alabama |
$2.9 B |
|
South Carolina |
$2.7 B |
|
Illinois |
$2.2 B |
|
Ohio |
$1.3 B |
|
Kentucky |
$1.1 B |
|
Michigan |
$1.0 B |
Additionally, to get a better picture of which U.S. industries will be most negatively impacted, Table 2 below shows the products in each state that will be most affected by new tariffs. These exports are broken down in two ways. The most affected product in percentage terms describes which export (of those identified by China) has the highest percentage sold to China. The most affected product in absolute dollar terms describes which product has the highest dollar value exported to China. Along with each product is its corresponding HS code and, as with the map above, all data is from 2017.
Table 2: Exports Most Affected by Chinese Retaliatory Tariffs, by State
| State |
Most Affected Product in Percentage Terms |
Most Affected Product in Absolute Dollar Terms |
||||
|
Product & HS Code |
Exports to China (Millions of USD) |
Percent Exported to China |
Product & HS Code |
Exports to China (Millions of USD) |
Percent Exported to China |
|
| All States |
Soybeans 120190 |
$12.4 B |
57% |
Soybeans 120190 |
$12.4 B |
57% |
| Alabama |
Soybeans 120190 |
$169.0 M |
82% |
Passenger Vehicles 870323 |
$2.0 B |
58% |
|
Alaska |
Aluminum Waste & Scrap 760200 |
$208,230 |
100% |
Aluminum Waste & Scrap 760200 |
$208,230 |
100% |
|
Arizona |
Dried Fruits and Nuts 081350 |
$33,822 |
71% |
Cotton 520100 |
$29.9 M |
20% |
| Arkansas |
Cotton Linters 140420 |
$162,797 |
100% |
Cotton 520100 |
$12.0 M |
19% |
|
California |
Cotton Linters 140420 |
$2.2 M |
97% |
Electric Motor Vehicles 870380 |
$1.5 B |
50% |
|
Colorado |
Oranges 080510 |
$33,021 |
100% |
Aluminum Waste & Scrap 760200 |
$28.7 M |
81% |
|
Connecticut |
Macadamia Nuts 080262 |
$35,802 |
100% |
Aluminum Waste & Scrap 760200 |
$25.0 M |
82% |
|
Delaware |
Plastic Plates 392099 |
$10.3 M |
49% |
Plastic Plates 392099 |
$10.3 M |
100% |
|
Florida |
Aluminum Waste & Scrap 760200 |
$71.7 M |
63% |
Aluminum Waste & Scrap 760200 |
$71.7 M |
63% |
|
Georgia |
Cranberries 200893 |
$47,600 |
100% |
Aluminum Waste & Scrap 760200 |
$39.1 M |
50% |
| Hawaii |
Macadamia Nuts 080261 |
$9.4 M |
100% |
Macadamia Nuts 080262 |
$9.4 M |
100% |
| Idaho |
Brewing or Distilling Dregs 230330 |
$125,359 |
100% |
Brewing or Distilling Dregs 230330 |
$125,359 |
100% |
|
Illinois |
Grain Sorghum 100790 |
$132.8 M |
100% |
Soybeans 120190 |
$1.3 B |
63% |
| Indiana |
Lemons and Limes 080550 |
$91,394 |
97% |
Gear Boxes for Motor Vehicles 870840 |
$94.4 M |
4% |
| Iowa |
Wine 220421 |
$84,026 |
100% |
Frozen Pork Offal 020649 |
$33.0 M |
15% |
| Kansas |
Frozen Pork Meat 020322 |
$6.8 M |
80% |
Grain Sorghum 100790 |
$53.5 M |
57% |
| Kentucky |
Aluminum Waste & Scrap 760200 |
$18.4 M |
89% |
Passenger Vehicles 870323 |
$856.5 M |
52% |
| Louisiana |
Grain Sorghum 100790 |
$43.0 M |
89% |
Soybeans 120190 |
$5.6 B |
53% |
| Maine |
Polymers of Ethylene 390190 |
$5,141 |
100% |
Laboratory & Diagnostic Reagants 382200 |
$5.2 M |
11% |
| Maryland |
Cellulose Acetates 391211 |
$43,477 |
100% |
Aluminum Waste & Scrap 760200 |
$39.3 M |
73% |
| Massachusetts |
Sour Cherries 080921 |
$65,000 |
100% |
Aluminum Waste & Scrap 760200 |
$38.6 M |
64% |
| Michigan |
Pistachios 080251 |
$50,000 |
95% |
Passenger Vehicles 870323 |
$482.0 M |
34% |
| Minnesota |
Frozen Pork Carcasses 020321 |
$1.3 M |
97% |
Plastic Plates 392099 |
$91.6 M |
27% |
| Mississippi |
Soybeans 120190 |
$109.7 M |
100% |
Soybeans 120190 |
$109.7 M |
100% |
| Missouri |
Frozen Pork Offal 020649 |
$45.1 M |
92% |
Frozen Pork Offal 020649 |
$45.1 M |
92% |
| Montana |
Aluminum Waste & Scrap 760200 |
$4.5 M |
100% |
Aluminum Waste & Scrap 760200 |
$4.5 M |
100% |
| Nebraska |
Soybeans 120190 |
$2.7 M |
47% |
Grain Sorghum 100790 |
$25.9 M |
8% |
| Nevada |
Polyvinyl Chloride 390410 |
$59,240 |
100% |
Cranberries 200893 |
$2.6 M |
50% |
| New Hampshire |
Reaction Initiators & Accelerators 381590 |
$1.5 M |
60% |
Articles of Plastics 392690 |
$5.2 M |
9% |
| New Jersey |
Frozen Pork Offal 020649 |
$52,915 |
100% |
Aluminum Waste & Scrap 760200 |
$29.5 M |
51% |
| New Mexico |
Frozen Pork Offal 020649 |
$42,227 |
100% |
Cotton 520100 |
$4.9 M |
34% |
| New York |
Ginseng Roots 121120 |
$7.8 M |
62% |
Polyethers 390720 |
$67.8 M |
29% |
| North Carolina |
Grain Sorghum 100790 |
$110,000 |
100% |
Tobacco 240120 |
$156.3 M |
25% |
| North Dakota |
Soybeans 120190 |
$28.2 M |
52% |
Soybeans 120190 |
$28.2 M |
52% |
| Ohio |
Pears 080830 |
$5,789 |
100% |
Soybeans 120190 |
$691.3 M |
38% |
| Oklahoma |
Aluminum Waste & Scrap 760200 |
$391,178 |
60% |
Frozen Pork 020329 |
$29.2 M |
52% |
| Oregon |
Coconuts 080111 |
$5,241 |
100% |
Passenger Vehicles 870323 |
$189.9 M |
84% |
| Pennsylvania |
Aluminum Waste & Scrap 760200 |
$20.8 M |
60% |
Articles of Plastics 392690 |
$33.0 M |
11% |
| Rhode Island |
Reaction Initiators & Accelerators 381590 |
$10,170 |
100% |
Articles of Plastics 392690 |
$1.5 M |
13% |
| South Carolina |
Frozen Pork Offal 020649 |
$33.0 M |
99% |
Passenger Vehicles 870323 |
$1.9 B |
62% |
| South Dakota |
Chemical Products 382499 |
$421,824 |
60% |
Polymer Plates & Sheets 392010 |
$4.3 M |
27% |
| Tennessee |
Electric Passenger Vehicles 870340 |
$202.3 M |
87% |
Electric Passenger Vehicles 870340 |
$202.3 M |
87% |
| Texas |
Soybeans 120190 |
$112.8 M |
91% |
Propane, Liquefied 271112 |
$1.6 B |
15% |
| Utah |
Chemical Products 382499 |
$421,824 |
60% |
Polymer Plates & Sheets 392010 |
$4.3 M |
27% |
| Vermont |
Polymers of Ethylene 390190 |
$642,236 |
75% |
Polymers of Ethylene 390190 |
$642,236 |
75% |
| Virginia |
Prunes 081320 |
$44,880 |
100% |
Soybeans 120190 |
$360.7 M |
61% |
| Washington |
Soybeans 120190 |
$3.7 B |
98% |
Soybeans 120190 |
$3.7 B |
98% |
| West Virginia |
Chemical Products 381512 |
$43.3 M |
54% |
Chemical Products 381512 |
$43.3 M |
54% |
|
Wisconsin |
Polyvinyl Chloride 390410 |
$68,639 |
88% |
Laboratory & Diagnostic Reagants 382200 |
$17.5 M |
7% |
| Wyoming |
Chemical Products 382484 |
$30,624 |
21% |
Chemical Products 382484 |
$125,559 |
2% |
Table 2 shows a wide range of exports that will be significantly impacted by the new tariffs. However, some distinct patterns emerge. For instance, in 2017, the United States exported $1.17 billion in aluminum waste and scrap to China, comprising of 52 percent of total exports of the product. It is the most affected export in absolute dollar terms for 10 states and the most affected export in percentage terms for six. Furthermore, while not always the top export, 37 states sent more than 40 percent of their aluminum waste and scrap to China in 2017.
Soybeans are the largest U.S. export to China and thus will be the most affected product across the United States. In 2017, the United States exported $12.4 billion of soybeans to China, or 57 percent of total U.S. soybean exports. In terms of dollar values, the states with the most soybean exports to China were Louisiana ($5.6 billion), Washington ($3.7 billion), and Illinois ($1.3 billion). China is also the destination for 100 percent of soybean exports from Mississippi, 98 percent from Washington, and 91 percent from Texas.
Some additional insights can be obtained from this analysis. First, the data show that the most affected exports in a number of states will be agricultural products, ranging from fruits and nuts to grains. Pork is another commonly affected export, with Iowa sending nearly $33 million in pork exports to China and Missouri exporting $45 million. Finally, in Michigan, autos will take a hit: Michigan’s largest export to China is small passenger vehicles, which were valued at $482 million in 2017.
Conclusion
The Trump Administration’s decision to impose new tariffs both on the basis of national security and in response to Chinese IP theft has sparked retaliation, which has real impacts for U.S. exporters. As more tariffs are imposed, Americans should expect more retaliation both from China and our other trading partners. The costs of retaliation are in addition to the economic costs of restricting imports, and both will have significant impacts on the U.S. economy.