Research
December 7, 2022
The Rise of Synthetic Opioids Could Explain Part of the Missing Workforce
Executive Summary
- An estimated 6.3 million workers are currently missing from the labor force; this study estimates that the loss of at least 1.3 million of those workers may be attributable to the ongoing opioid epidemic.
- The rise of synthetic opioid use increased overall opioid overdose fatalities by more than 200 percent between 2013 and 2021; it also contributes to lower worker productivity, increased worker absenteeism, increased job openings through employee turnover, and a reduced labor supply.
- The loss of more than 1.3 million workers due to opioid use indicates a cumulative loss of 7 billion work hours and $526.1 billion in reduced real output supply between 2013 and 2021.
Introduction
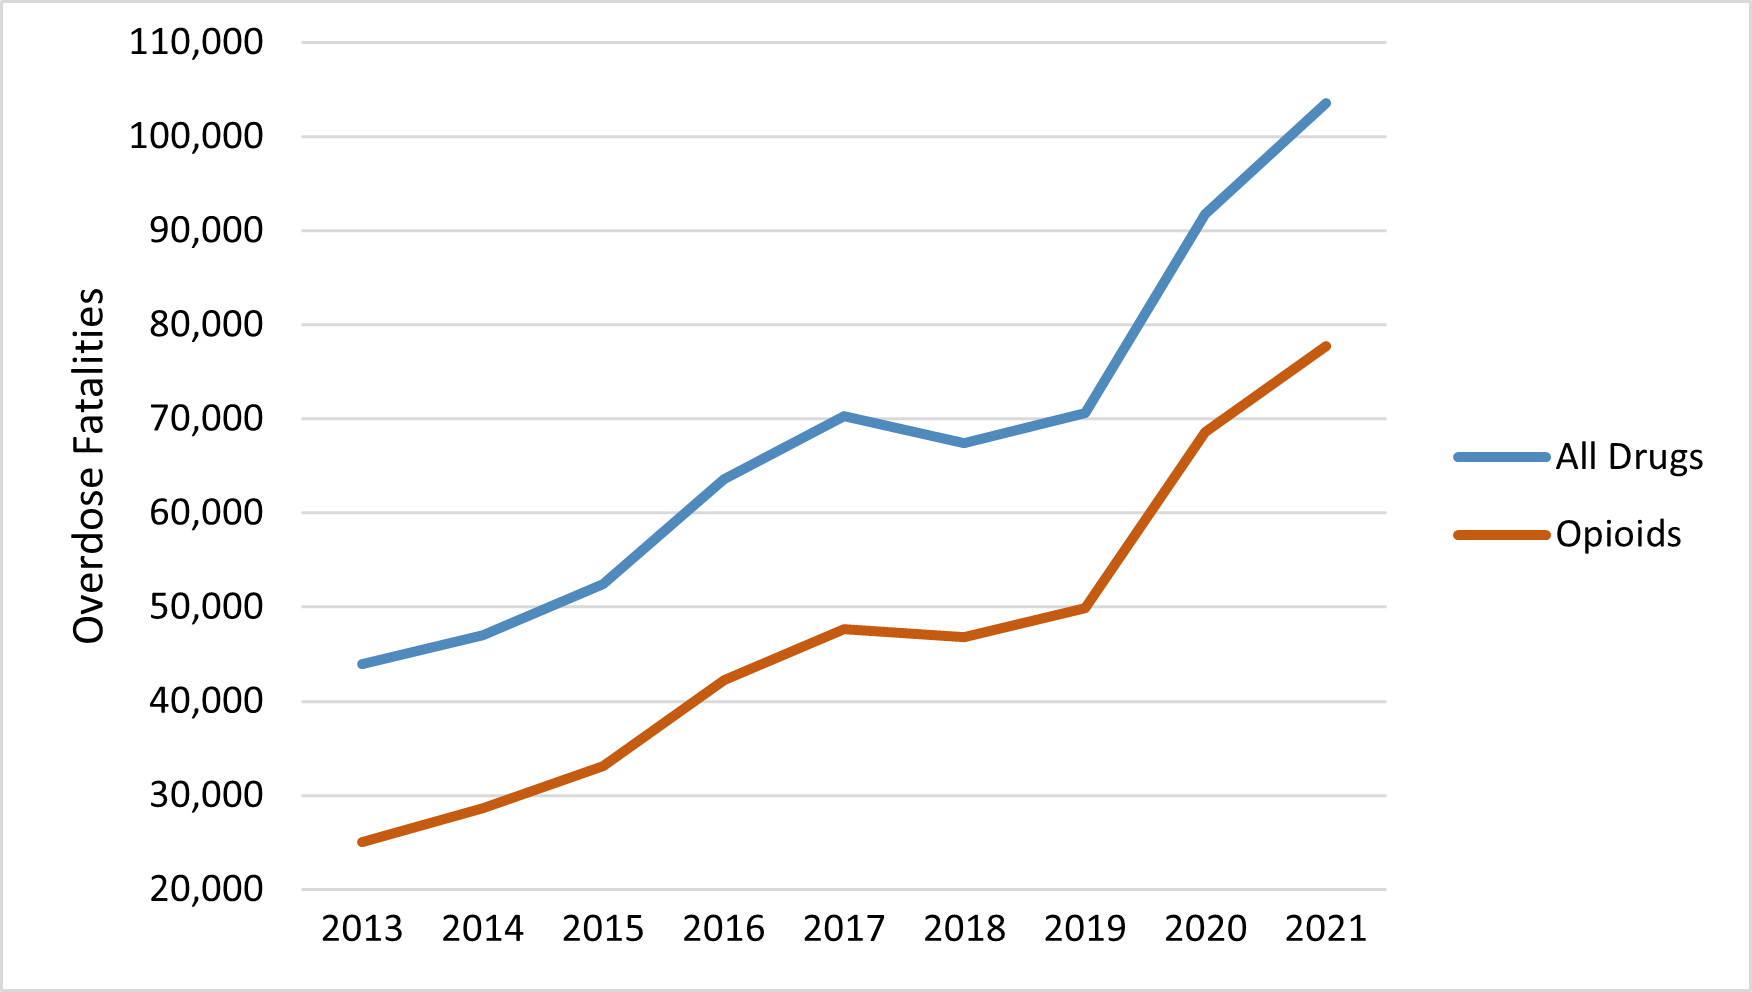
Compared to pre-pandemic trends, the U.S. economy is suffering a shortfall of an estimated 6.3 million workers.[1] As the opioid epidemic continues to worsen, overdose fatalities have increased—particularly since 2013, coinciding with the use of synthetic opioids such as illicit fentanyl, which is more potent than morphine, cheaply made, and easily transported. In 2021 alone, there were approximately 68,500 deaths resulting from synthetic opioid overdoses and nearly 78,000 deaths due to opioid overdoses overall. It is therefore reasonable to ask to what extent the opioid crisis is contributing to the worker shortage.
This study builds on previous American Action Forum research by former Labor Market Policy Director Ben Gitis, which examined the impact of opioids on the labor market and economic output from 1999–2015.[2] This new research estimates that, in 2021, relative to 2013 labor force participation rate projections, at least 1.3 million workers were absent from the labor force as a result of opioid use. This is likely a conservative estimate as it assumes that the incidence of opioid fatalities during the pandemic was the same as prior to the pandemic. Even using this lower-bound estimate, the loss of workers translates to a significant drag on the economy through lost work hours and output. Assuming this study’s estimated 1.3 million missing workers from opioid use, opioids were responsible for a cumulative loss of at least 7 billion work hours and $526.1 billion in real output between 2013 and 2021.
Beyond health concerns, the impact of the opioid epidemic is particularly pronounced in the current economic environment, as demand for workers is outpacing supply, thus contributing to rising inflation. This study explores the extent to which the opioid epidemic is both weakening and reducing the U.S. labor force.
Rise of Synthetic Opioids
Opioid use has been a rising concern in the United States since the 1990s and was declared a public health emergency in 2017. Opioids are now a factor in approximately 75 percent of drug overdose fatalities, and opioid overdose fatalities hit an all-time high of 77,697 deaths in 2021.[3] The Centers for disease Control and Prevention (CDC) divides the increases in opioid-involved deaths into three waves: The rise of prescription opioid use starting in the 1990s; the rise in heroin use in 2010; and the rise in the use of synthetic opioids, such as illicit fentanyl, which started in 2013.[4] Table 1 reports the growth rates of overdose fatalities involving all drugs, opioids, and synthetic opioids during the third wave between 2013-2021.
Table 1: Growth Rate of Overdose Fatalities by Type
| Year | Synthetic Opioids | All Opioids | All Drugs |
| 2013-2021 | 2107.0% | 210.1% | 135.5% |
Between 2013–2021, overdose fatalities from all drugs and opioids alone followed the same upward trend. Chart 1 shows the number of annual drug and opioid-involved overdose fatalities since 2013.[5]
Chart 1: Opioid and All Drug Overdose Fatalities 2013-2021[6]
Fentanyl—which is more potent than morphine, cheaply made, and easily transported—is fueling the synthetic opioid wave and, consequently, the majority of opioid overdose fatalities. Fentanyl can be prescribed but is more commonly produced and sold illegally.[7] Law enforcement seizures of pills containing illicit fentanyl have increased by almost 9.5 million since 2018.[8] As the drug is not naturally produced, it is not bound to a specific geographic area. What’s more, the source of fentanyl flowing into the United States is diversifying: Mexico and China are the primary producers of illicit fentanyl and India is emerging in the market. The ease with which fentanyl is produced and distributed has resulted in a significant increase of synthetic opioid involved deaths from 2013 to 2021, contrasting with the plateau of fatalities involving other types of opioids. Chart 2 shows the change in overdose fatalities by the type of opioid starting in 2013.
Chart 2: Type of Opioid Fatalities 2013-2021[9]
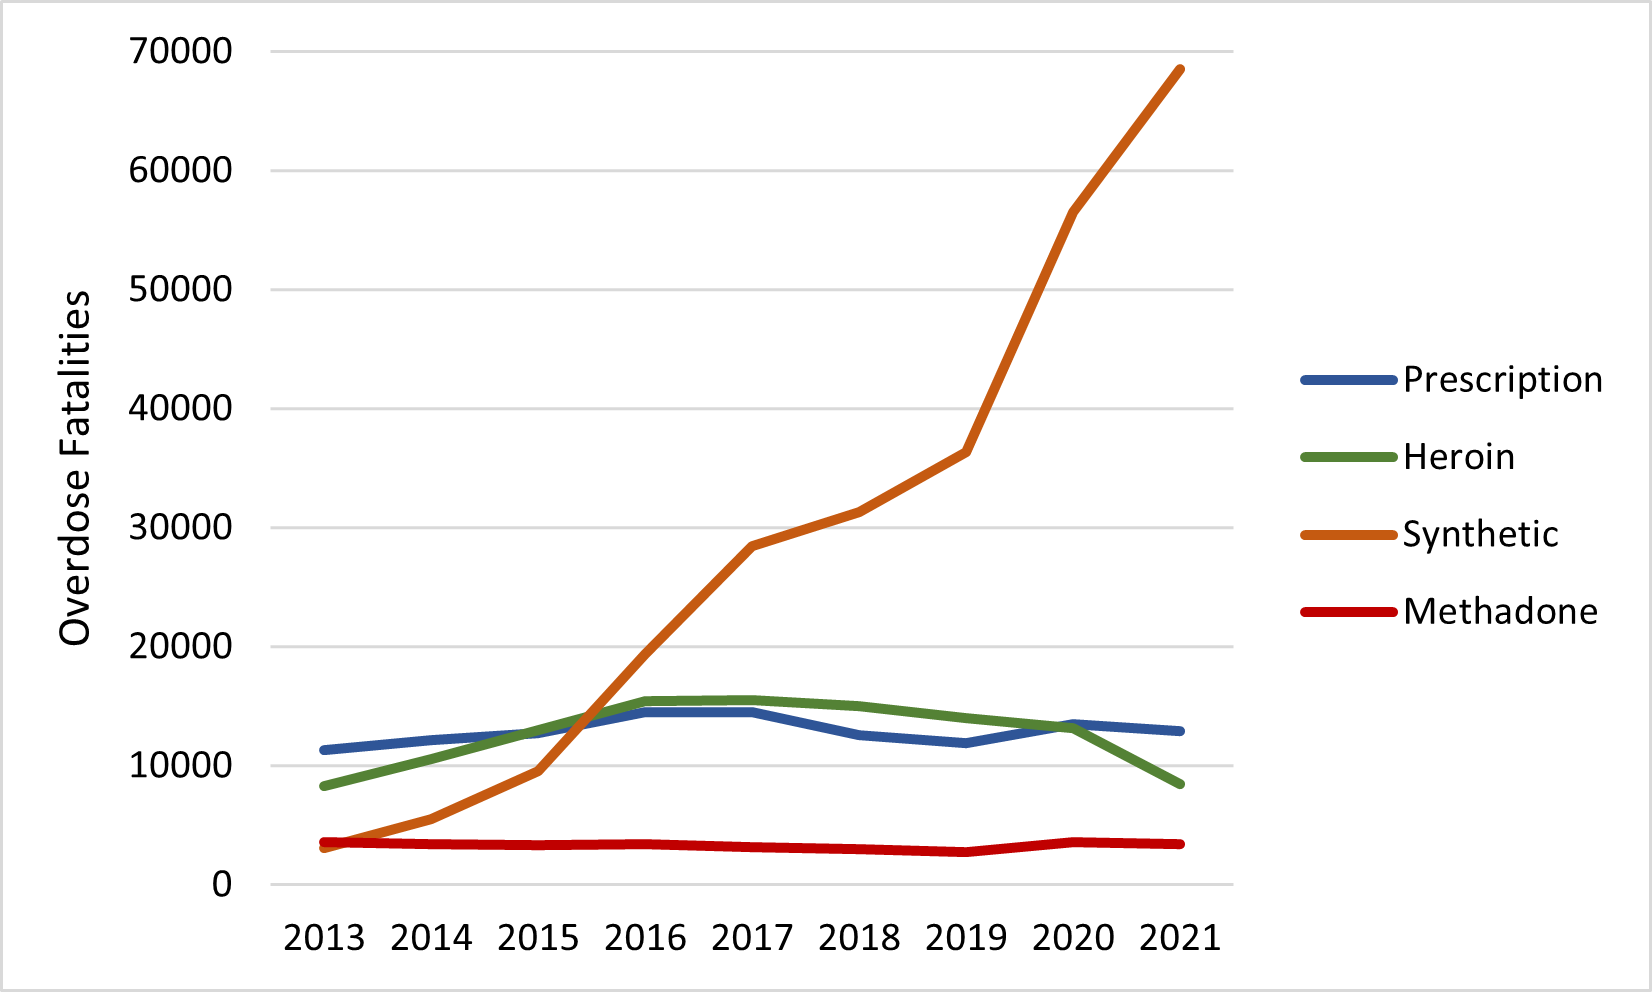
By 2021, the number of synthetic opioid-related fatalities increased to approximately 68,500, accounting for 88 percent of total opioid-related deaths.
Declining Labor Force Participation and the Role of Opioids
In addition to being a public health concern, increasing opioid-involved fatalities are an economic concern, as well. Workers using opioids tend to be less productive, lead to increased job openings through employee turnover, and are commonly absent from their positions. Workers with opioid dependency issues are likely to drop out of the labor market, negatively impacting the economies labor supply.
The most recent release of the Bureau of Labor Statistics Job Openings and Labor Turnover Summary reported 10.3 million job openings on the last business day in October.[10] In the same month, the number of unemployed individuals increased to 6 million, resulting in a market with approximately 1.7 job openings for each unemployed person.[11] As opioid-involved deaths increased from 2013 to 2021, the labor force participation rate decreased and widened the gap between job openings and available workers. The most notable alignment is the significant drop in the labor force participation rate between 2019 and 2020 as opioid fatalities surged. Chart 3 shows the change in the labor force participation rate since the start of the synthetic opioid wave.
Chart 3: Labor Force Participation Rate, 2013-2021[12]
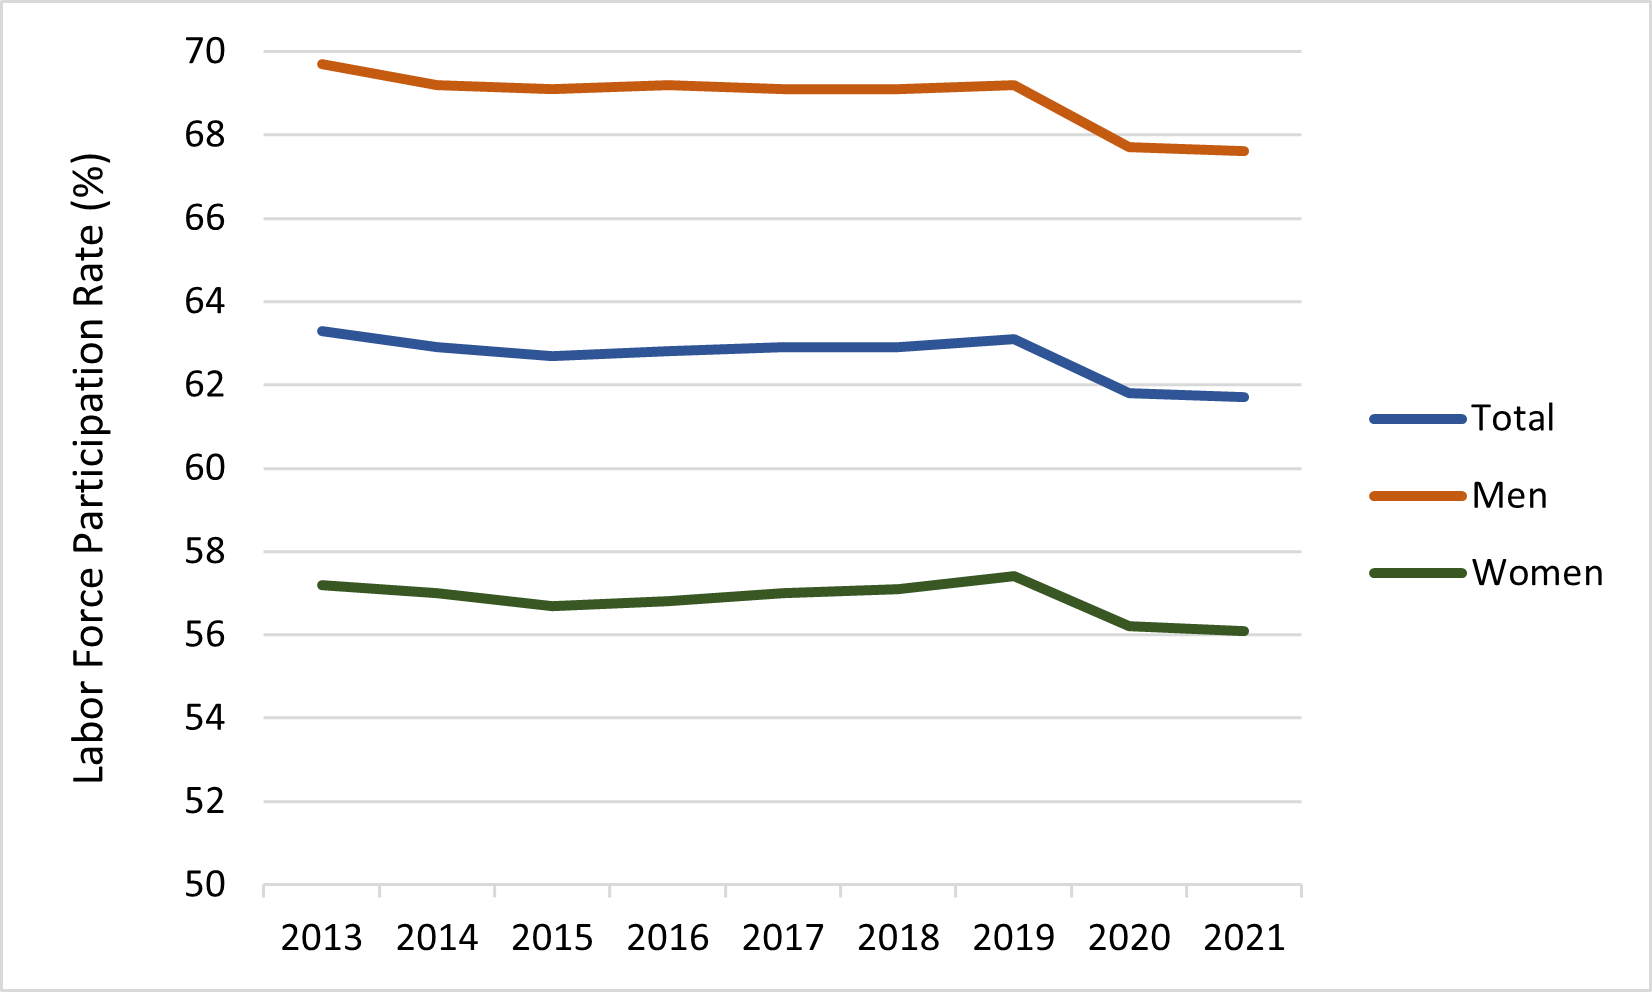
During the same period that opioid-involved deaths rose by 210 percent (23 percent annually), the labor force participation rate decreased from 63.3 percent to 61.7 percent. For men it decreased from 69.7 percent to 67.6 percent and for women it declined from 57.2 percent to 56.1 percent.
Decline in Labor Force Participation and Employment Due to Opioids
Previous research suggests that the opioid crisis could be a primary cause of declining labor force participation rates. In a 2017 study, former Council of Economic Advisors Chairman Alan Krueger found statistically significant evidence that opioids could account for up to 43 percent of the prime-age male and 25 percent of the prime-age female workforce decline over the period of interest, 1999–2015.[13][14] Former American Action Forum Labor Market Policy Director Ben Gitis used Krueger’s estimates to quantify the number of workers lost from the labor force due to opioid use in a 2018 study. Gitis then estimated the loss of work hours and economic output (gross domestic output) from the absent workers. His results suggest that 919,400 prime-age individuals were missing from the labor force in 2015. Between 1999 and 2015, the decline in prime-age labor force cost the economy 12.1 billion work hours and $702.1 billion in real output.[15] This study builds from these previous studies and estimates the impact that opioids have had on the labor market and economic productivity outcomes since the start of the synthetic opioid wave in 2013.
In 2021, relative to 2013, the overall decline in the labor force participation rate equates to a loss of 2.6 million workers. Table 2 shows the total loss of workers due to the decline in the labor force participation rate since 2013. Put simply, the estimates report the number of workers who would have been in the labor force if the participation rate had remained at 2013 levels: 63.3 percent for all labor, 69.7 percent for males, and 57.2 percent for females. As all impacts are calculated relative to 2013, there are no measured impacts for that year as represented by 0 in the following tables.
Table 2: Change in Labor Force Participation, 2013–2021
| Year | Men | Women | Total |
| 2013 | 0 | 0 | 0 |
| 2014 | 414,400 | 146,100 | 560,500 |
| 2015 | 501,700 | 367,600 | 869,300 |
| 2016 | 423,800 | 297,700 | 721,500 |
| 2017 | 510,900 | 150,400 | 661,300 |
| 2018 | 516,600 | 76,000 | 592,600 |
| 2019 | 433,400 | -153,700[16] | 279,700 |
| 2020 | 1,704,100 | 755,400 | 2,459,500 |
| 2021 | 1,795,600 | 832,700 | 2,628,300 |
In 2021, there were 2.6 million fewer workers in the labor force than if the labor force participation rate had remained at 2013 levels. The loss translated to 1.8 million missing male workers and 832,700 missing female workers.
This study adjusts Krueger’s methodology to estimate the number of those absent workers that left the labor force because of opioid use. Instead of using prime-age labor force participation, this study uses labor force participation rate data for those over the age of 16 to include the tail ends of the labor force. To account for the difference, this study used opioid death data from 2020 broken down by age and gender to scale Krueger’s estimates and account for those aged 16–24 and above 54 years.[17] The estimated number of prime-age workers who died from opioid overdose was compared to the number of workers in the 15–24 and 55–64 age brackets to create a ratio and appropriate percentage of labor market loss for each tail. The tails were then added to the original figure estimated by Krueger to produce a total estimate for the percentage of labor force participation loss caused by opioids. The resulting estimates report that opioids could account for up to 57 percent of the decline in male labor force participation and 34 percent in female labor force participation. These percentages are a conservative estimate of the actual impact of opioids as they do not account for human behavioral adaptations from the coronavirus pandemic. As this study estimates the opioid impact through 2021, the pandemic likely had a considerable impact on the last two years of data, as many individuals increased their drug and alcohol consumption, suggesting that opioids may have had a greater impact than 57 percent and 34 percent on labor loss from 2020–2021.[18] The following estimates, therefore, represent a lower-bound estimate of the opioid-involved impacts on the labor market and economic output.
Table 3 displays the estimates for the number of labor force participants and employed individuals that were absent due to opioid use from the start of the synthetic opioid wave (2013–2021).
Table 3: Workers and Employed Workers Who Left the Labor Force Due to Opioids, 2013–2021
| Year | Men | Women | Total | |||
| Labor Force | Employed | Labor Force | Employed | Labor Force | Employed | |
| 2013 | 0 | 0 | 0 | 0 | 0 | 0 |
| 2014 | 236,200 | 221,300 | 49,700 | 46,600 | 285,900 | 267,900 |
| 2015 | 286,000 | 270,500 | 125,000 | 118,500 | 411,000 | 389,000 |
| 2016 | 241,600 | 229,700 | 101,200 | 96,400 | 342,800 | 326,100 |
| 2017 | 291,200 | 278,400 | 51,100 | 48,900 | 342,300 | 327,300 |
| 2018 | 294,500 | 282,900 | 25,800 | 24,900 | 320,300 | 307,800 |
| 2019 | 247,000 | 237,900 | -52,300 | -50,400 | 194,700 | 187,500 |
| 2020 | 971,300 | 895,600 | 256,800 | 235,500 | 1,228,100 | 1,131,100 |
| 2021 | 1,023,500 | 967,200 | 283,100 | 268,400 | 1,306,600 | 1,235,600 |
Assuming that 57 percent of the reduction in male labor force participation and 34 percent of the reduction in female labor force participation is due to opioids, in 2021 opioids kept approximately 1,023,500 males and 283,100 females out of the labor force for a total of at least 1.3 million missing workers. Opioids are therefore potentially responsible for 21 percent of the 6.3 million missing workers. (Recall that the 6.3 million figure is the estimated number of workers that the labor force is missing in comparison to pre-pandemic employment trends.)
This study calculates the estimated loss of employed individuals due to opioids using reported annual unemployment rates for each gender, each year. The estimates that most of the lost workers would have been active employees. [19] Therefore, in 2021 opioids were responsible for the loss of 1.2 million employees, of which 967,200 were male and 268,400 were female.
Decline in Work Hours
The decrease in employed individuals results in lost work hours. Table 4 contains the hours of labor lost from absent workers because of opioid use.
Table 4: Work Hours Lost Due to Opioids, 2013-2021[20]
| Year | Average Work Hours per Employed Person[21] | Decline in Hours (in millions) | ||
| Men | Women | Total | ||
| 2013 | 1687.0 | 0.0 | 0.0 | 0.0 |
| 2014 | 1691.0 | 374.2 | 78.8 | 453.0 |
| 2015 | 1690.0 | 457.1 | 200.3 | 657.4 |
| 2016 | 1684.2 | 386.9 | 162.4 | 549.3 |
| 2017 | 1683.4 | 468.4 | 82.3 | 550.7 |
| 2018 | 1,683.7 | 476.3 | 41.9 | 518.2 |
| 2019 | 1,675.6 | 398.6 | -84.5 | 314.1 |
| 2020 | 1,673.0 | 1,498.3 | 394.0 | 1,892.3 |
| 2021 | 1,672.8 | 1617.9 | 449.0 | 2,066.9 |
| Cumulative | N/A | 5,677.7 | 1,324.2 | 7,001.9 |
These estimates were calculated by multiplying average annual work hours per employee by the decrease in employment. From the beginning of 2013 to the end of 2021, there were fluctuations in the number of hours lost each year, but the overall trend shows an increase in hours lost over the nine-year period. In 2021, the economy lost approximately 2 billion hours of work as a result of opioid use. Cumulatively, from 2013 through 2021, the economy lost at least 7 billion hours of work, nearly 5.7 billion from lost male workers and over 1.3 billion from lost female workers.
Decline in Real Output
The lost work hours translate into a significant decrease in economic output. Table 5 reports the annual and total reduction in real output as a result of opioid use from 2013 through 2021.
Table 5: Decline in Output Due to Opioids, 2013–2021[22] (2022 dollars)
| Year | Labor Productivity[23] | Decline in Output (billions) | ||
| Men | Women | Total | ||
| 2013 | $65.73 | $0.0 | $0.0 | $0.0 |
| 2014 | $67.11 | $25.1 | $5.3 | $30.4 |
| 2015 | $68.10 | $31.1 | $13.6 | $44.7 |
| 2016 | $68.87 | $26.6 | $11.2 | $37.8 |
| 2017 | $70.87 | $33.2 | $4.8 | $38.0 |
| 2018 | $73.54 | $35.0 | $3.1 | $38.1 |
| 2019 | $76.10 | $30.3 | -$6.4 | $23.9 |
| 2020 | $78.32 | $117.4 | $30.9 | $148.3 |
| 2021 | $79.77 | $129.1 | $35.8 | $164.9 |
| Cumulative | N/A | $427.8 | $98.3 | $526.1 |
The decline in labor force participation due the opioid crisis has produced an increasing economic cost. In 2019, despite growth in female labor force participation, opioids cost the economy $23.9 billion in output. By 2021, the economy lost at least $164.9 billion in real output due to opioids. Cumulatively, from 2013–2021, loss of output inflicts a significant strain on the current economy. The average annual decline in output due to opioids between these years was $58.5 billion, equating to a cumulative economic loss of $526.1 billion over the nine-year span. The use of illicit drugs is more common among men than women, with men accounting for over 80 percent of the lost output.[24] The absent male workers translated to a cumulative output decrease of $427.8 billion and the absent female workers translated to a loss of $98.3 billion in output. At the individual level, the average annual lost output of $58.5 billion equates to $176.26 per U.S. resident. Looking at 2021 alone, however, the loss in output of $164.9 billion translates to $496.80 per U.S. resident.[25]
The gap between job openings and available labor is preventing the U.S. economy from maximizing its output. The U.S. demand for output currently outstrips the supply and the loss of workers due to opioids is a primary cause. In addition to the loss of at least $526.1 billion in output, the 1.3 million absent workers are adding additional strain to the economy. Remaining workers in the market can make demands like higher wages because of the excess available jobs.
Conclusion
The U.S. labor force is missing 6.3 million workers as measured against pre-pandemic trends. As the use of synthetic opioids has significantly risen since 2013, the opioid epidemic has become an increasingly costly health and economic challenge. Updating previous AAF research, this study finds that in 2021, at least 1.3 million workers were absent from the labor force because of opioid use, accounting for approximately 21 percent of the missing labor force. The missing workers translate to a drag on the U.S. economy in the form of lost work hours and output. From 2013–2021, opioids cost the economy a cumulative loss of about 7 billion work hours and $526.1 billion in real output.
[1] “The 2022 Report of the Joint Economic Committee Congress of the United States on the 2022 Economic Report of the President,” Joint Economic Committee Republicans, 2022, jec-republican-erp-response-2022.pdf (senate.gov)
[2] Ben Gitis, “The Labor Force and Output Consequences of the Opioid Crisis,” American Action Forum, March 27, 2018, https://www.americanactionforum.org/research/labor-force-output-consequences-opioid-crisis/
[3] “Provisional Drug Overdose Death Counts,” National Vital Statistics System, National Center for Health Statistics, Centers for Disease Control and Prevention, February 9, 2018, https://www.cdc.gov/nchs/nvss/vsrr/drug-overdose-data.htm.
[4] “Understanding the Epidemic,” Centers for Disease Control and Prevention, March 17, 2021, https://www.cdc.gov/drugoverdose/epidemic/index.html
[5] “Data Brief 428. Drug Overdose Deaths in the United States, 1999-2020,” Figure 4, Centers for Disease Control and Prevention, https://www.cdc.gov/nchs/data/databriefs/db428-tables.pdf#1
[6] “Provisional Drug Overdose Death Counts,” National Vital Statistics System, National Center for Health Statistics, Centers for Disease Control and Prevention, February 9, 2018, https://www.cdc.gov/nchs/nvss/vsrr/drug-overdose-data.htm.
[7] “Illegal Use of Fentanyl,” Centers for Disease Control and Prevention, November 28, 2016, https://www.cdc.gov/niosh/topics/fentanyl/illegaluse.html
[8] “Law enforcement seizures of pills containing fentanyl increased dramatically between 2018-2021,” National Institute on Drug Abuse, March 31, 2022, https://nida.nih.gov/news-events/news-releases/2022/03/law-enforcement-seizures-of-pills-containing-fentanyl-increased-dramatically-between-2018-2021
[9] 2021 estimates were gathered from the CDC’s Vital Statistics Rapid Release Provision Drug Overdose Data. As provisional data, the 2021 estimates are based on available records that meet data quality at the time of analysis and may not include all deaths during the given time period (one year). Provisional results are therefore not as accurate as final data.
[10] Job Openings and Labor Turnover Summary, Bureau of Labor Statistics, October 2022, https://www.bls.gov/news.release/jolts.nr0.htm
[11] Employment Situation Summary, Bureau of Labor Statistics, August 2022, https://www.bls.gov/news.release/empsit.nr0.htm
[12] Labor Force Statistics from the Current Population Survey, Bureau of Labor Statistics, https://www.bls.gov/cps/tables.htm.
[13] Krueger’s original study reported that opioids could account for up to 20 percent of the prime-age male work force decline. The study was updated in 2019 to with a corrected estimate of 43 percent.
[14] Alan Krueger, “Where Have All the Workers Gone An Inquiry into the Decline of the U.S. Labor Force Participation Rate,” Brookings Papers on Economic Activity, Sept 7-8, 2017, p. 31, https://www.brookings.edu/wp-content/uploads/2017/09/1_krueger.pdf.
[15] Ben Gitis, “The Labor Force and Output Consequences of the Opioid Crisis,” American Action Forum, March 27, 2018, https://www.americanactionforum.org/research/labor-force-output-consequences-opioid-crisis/
[16] In 2019 the labor force participation rate for women exceeded the rate in 2013. Therefore, the labor force gained 153,700 female workers in 2019.
[17] “Overdose deaths by select drugs, United States, 199-2020,” NSC Injury Facts, 2021, https://injuryfacts.nsc.org/home-and-community/safety-topics/drugoverdoses/data-details/
[18] “Drug and Alcohol Use Increase During COVID-19,” The Recovery Village, May 09, 2022, https://www.therecoveryvillage.com/drug-addiction/drug-alcohol-use-rising-during-covid/
[19] For the purpose of this research the term employee refers to any employed member of the workforce.
[20] “Average annual hours actually worked per worker,” OECD Stat, July 14, 2022, https://stats.oecd.org/index.aspx?DataSetCode=ANHRS
[21] Average hours worked per employed person was derived from the division of total hours worked by total employment. Data used for calculations came from BLS Historical Multifactor productivity tables.
[22] Multifactor Productivity, Bureau of Labor Statistics, https://www.bls.gov/mfp/.
[23] Productivity estimates were derived from the division of private sector real value added by private sector hours worked. Data used for calculations came from BLS Historical Multifactor productivity tables.
[24] “Sex and Gender Differences in Substance Use,” National institute on Drug Abuse, April 2020, https://nida.nih.gov/publications/research-reports/substance-use-in-women/sex-gender-differences-in-substance-use
[25] Based on 2021 US population estimate of 331,893,745, U.S. Census Bureau QuickFacts: United States