


Research
September 11, 2017
Trends in Hotel Employment, Hours, and Wages since the NLRB Broadened the Joint Employer Standard
Executive Summary
This paper builds on previous American Action Forum research that found the National Labor Relations Board’s 2015 decision to fundamentally broaden the joint employer standard could cost up to 1.7 million franchise jobs. This paper specifically examines labor market trends in the accommodations industry (i.e. hotels), where a substantial portion of the workers are employed by franchises. While the evidence is not conclusive, the analysis finds that the new standard may already be creating problems for the accommodations workforce.
Since the 2015 ruling, the accommodations industry has seen:
- Franchise employment growth decline by 1.4 percentage points, driving a decline in job growth across the industry;
- Wage growth stall and work hours beginning to contract;
- Growth in total wages earned by all industry workers decrease by 7 percentage points, leading to a net decline in wage earnings.
The entire private sector has also experienced a decline in labor market growth since the introduction of the new joint employer standard. However, the negative trends have been much more pronounced in the accommodations industry. This suggests that broader macroeconomic forces are not solely responsible and that the new joint employer standard may be adding an extra burden to the industry.
Introduction
The joint employer standard is back in the spotlight as Rep. Bradley Byrne (R-AL) recently introduced the Save Local Business Act, which would permanently reverse the National Labor Relations Board’s (NLRB) decision in Browning-Ferris Industries (BFI).[1] In August 2015, the NRLB’s decision in BFI fundamentally broadened the legal definition of “joint employer” so that an employer is more likely to be held responsible for the employment and pay conditions in a separate business.[2] Previous research by the American Action Forum (AAF) reviewed the legal and economic implications of the BFI decision for franchises, which are among the businesses most impacted by the decision. It found that the broadened joint employer standard could result in a loss of up to 1.7 million franchise jobs.[3]
This paper narrows the focus to the accommodations industry (i.e. hotels). With recent job growth lagging the rest of the private sector and over one-third of its workers employed by independent franchisees, the accommodations industry is perhaps most susceptible to the deleterious effects of the new joint employer standard. Specifically, this paper compares labor market trends within the hotel industry before and after the NLRB issued its BFI decision. It finds that since the BFI decision, growth in hotel employment, wages, and hours have slowed.
Franchises and Job Growth in the Hotel Industry
As AAF previously detailed, the broadened joint employer standard inherently reduces incentive to franchise. If a franchisor is more likely to be held responsible for a franchisee’s workers, the franchisor will be less likely to sell franchise licenses to independent business owners. This means there will be fewer franchises, which have been among the most dependable sources of job creation in the United States since the end of the Great Recession. Since 2012, private-sector franchise employment has been growing 3.4 percent annually while non-franchise jobs have only been increasing at a 2 percent rate. If the joint employer rule leads to franchise employment growth simply slowing to the non-franchise growth rate, it could mean a loss of 1.7 million jobs over the next ten years.[4]
Moreover, this change is highly problematic for industries that rely on franchises. Restaurants and fast food chains, such as McDonalds and Burger King, employ the majority of franchise workers. Yet, franchises are also vital in the accommodations industry. Table 1 contains the number of employed people in each of the major industries within the leisure and hospitality sector, and the number of those who work for franchises.
Table 1: Franchise Workers (in thousands) as of December 2016
| Industry |
Total[5] |
Franchise[6] |
Percent Franchise |
| Total Private Sector |
121,881.5 |
8,528.3 |
7.0% |
| Leisure & Hospitality |
15,365.3 |
5,224.0 |
34.0% |
| Food Services & Drinking Places |
11,363.9 |
4,486.5 |
39.5% |
| Accommodations |
1,891.5 |
655.8 |
34.7% |
| Leisure |
2,110.0 |
81.7 |
3.9% |
While the accommodations industry is much smaller than the restaurant industry, franchises are almost just as important to hotels as they are to restaurants. According to the payroll processing firm ADP, as of December 2016, 8.5 million people worked for a franchise, which represented 7 percent of private sector employment. 4.5 million of those franchise workers were employed by restaurants, representing just over half of the entire franchise workforce and 39.5 percent of the 11.4 million workers working in the food services and drinking places industry. Hotels have a much smaller portion of the franchise workforce, with 655,800 franchise workers as of December 2016. These workers, however, accounted for a vital 34.7 percent of all workers in the industry, which only had 1.9 million workers total at the end of 2016. This suggests the new joint employer standard impacts hotels nearly as much as it impacts restaurants.
Analysts often combine restaurant, hotel, and leisure workers into the larger leisure and hospitality sector category. When comparing job growth in leisure and hospitality to the rest of the private sector, it creates a portrait of a thriving sector of the economy. Chart 1 compares the annual job growth in each since 2010.
Chart 1: Job Growth in Leisure and Hospitality and the Rest of the Private Sector[7]
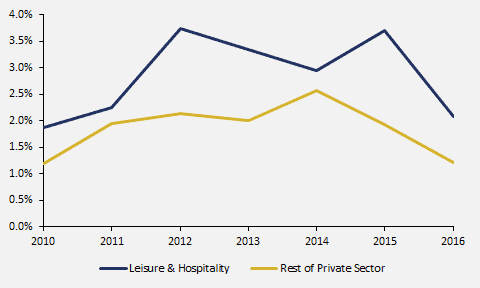
Since 2010, job growth in leisure and hospitality has far outpaced the rest of private sector. Employment in leisure and hospitality has grown at a 3 percent compounded annual rate between December 2010 and December 2016. At the end of 2016, leisure and hospitality had 15.4 million workers, 5.2 million of whom were in franchises. Employment in the rest of the private sector meanwhile has only grown at a 2 percent annual rate.
Splitting up leisure and hospitality in to its three major components (restaurants, hotels, and leisure services), however, reveals that hotel employment has grown much slower than the rest of the sector. Chart 2 compares the job growth rates in restaurants, hotels, and leisure services to the rest of the private sector.
Chart 2: Job Growth in Restaurants, Hotels, Leisure Services, and the rest of the Private Sector[8]
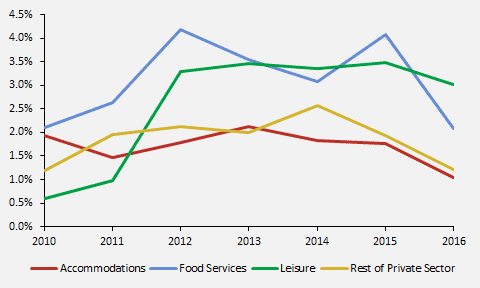
While restaurants and leisure services are driving the job growth in the leisure and hospitality sector, hotels have been struggling. Since 2010, employment in restaurants and leisure services have grown at 3.3 percent and 2.9 percent compounded annual rates, respectively, well above the 2 percent annual rate experienced in the rest of the private sector. Employment in hotels, however, has grown slower at a 1.7 percent annual rate. So not only is hotel employment growing slower than restaurants and leisure services, but it is also growing slower than the rest of the private sector.
Labor Market Trends in Accommodations Since 2015 Joint Employer Decision
With intense competition from Airbnb and a weak economic recovery, the accommodations industry has struggled in recent years. In its weakened condition, and given its reliance on franchises, the accommodations industry is perhaps the most susceptible to the negative consequences of the broadened joint employer standard. Since the NLRB’s decision faces significant challenges in the courts[9] and in Congress,[10], [11] many businesses are likely waiting to substantially adjusted their operations to comply with the new standard until they are certain of its fate. Yet preliminary trends indicate that the new standard may already be creating problems in the accommodations industry. In particular, after the BFI decision in 2015, employment, wage, and hours growth in the accommodations industry all stalled in 2016. In addition, franchise data indicate that a decline in franchise job growth is the primary culprit for the overall decline in accommodations job growth.
Table 2 illustrates that since the BFI decision, job growth in the accommodations industry slowed substantially, and franchises have been driving the downward trend.
Table 2: Job Growth in Accommodations Overall and by Franchise Status[12], [13]
| Category |
Pre-BFI |
Post-BFI |
Percentage Point Change |
| Total |
1.9% |
1.1% |
-0.8 |
| Franchise |
1.8% |
0.4% |
-1.4 |
| Non-Franchise |
1.9% |
1.4% |
-0.5 |
In the years leading up to the BFI decision (2011 to 2015), employment in the accommodations industry grew at a 1.9 percent annual rate. In 2016 (the first year after BFI), however, hotel employment grew by only 1.1 percent, a 0.8 percentage point decline. Moreover, most of this slowdown was driven by substantial drop in franchise job growth. Before BFI, jobs in hotel franchises and non-franchises grew at 1.8 percent and 1.9 percent annual rates, respectively. But, in 2016, hotel franchise job growth dropped 1.4 percentage points to 0.4 percent, while non-franchise job growth declined by only 0.5 percentage points to 1.4 percent.
In addition, hotel worker wages and hours have flatlined or contracted. Table 3 contains wages and hours growth before and after the BFI decision.
Table 3: Growth in Wages, Hours, Weekly Earnings, and Total Wage Earnings in Accommodations[14], [15]
| Category |
Pre-BFI |
Post-BFI |
Percentage Point Change |
| Real Hourly Wages |
1.1% |
0.0% |
-1.1 |
| Hours |
0.5% |
-0.3% |
-0.8 |
| Real Weekly Earnings |
1.6% |
-0.2% |
-1.8 |
| Total Wage Earnings |
5.7% |
-1.2% |
-7.0 |
In the year following BFI, real hourly wages in accommodations stopped growing completely. This came after real hourly wages in the industry grew at a 1.1 percent annual rate from 2011 to 2015. In addition, work hours went from growing 0.5 percent annually to declining by 0.3 percent. Between the deceleration in real wages and reduction in hours, real weekly earnings declined by 0.2 percent in 2016, after rising by 1.6 percent per year before the NLRB issued its decision in BFI. Finally, among experiencing a lower job growth rate, no growth in hourly wages, and a decline in work hours, the sum of all pay earned by all workers (total wage earnings) in the accommodations industry went from rising by 5.7 percent annually before BFI to declining by 1.2 percent after BFI.
It is important to note that the entire private sector also experienced a decline in labor market growth since the NLRB broadened the joint employer standard. This suggests that the decline in labor market growth in the accommodations industry may be due in part to broader macroeconomic trends. The private sector’s slowdown, however, tends to be less pronounced than in the accommodations industry. Table 4 contains wage, hours, and employment growth rates in the entire private sector before and after BFI decision.
Table 4: Growth in Employment, Wages, Hours, Weekly Earnings, and Total Wage Earnings in the Private Sector[16], [17]
| Category |
Pre-BFI |
Post-BFI |
Percentage Point Change |
| Employment |
2.3% |
1.3% |
-1.0 |
| Real Hourly Wages |
1.0% |
0.8% |
-0.2 |
| Hours |
0.1% |
-0.3% |
-0.4 |
| Real Weekly Earnings |
1.0% |
0.5% |
-0.6 |
| Total Wage Earnings |
5.7% |
-0.3% |
-6.0 |
For the most part, in 2016 the decline in labor market growth was far less severe in the private sector than in the accommodations industry. As the only exception, private sector job growth declined by 1 percentage point, which was a slightly larger decline than the 0.8 percentage point drop in accommodations job growth. Meanwhile, the growth rate in real hourly wages declined by only 0.2 percentage points in the private sector, while it declined by 1.1 percentage points in the accommodations industry. Hours growth decreased by 0.4 percentage points in the private sector and by 0.8 percentage points in accommodations. Finally, the growth rates in private sector real weekly earnings and total wage earnings declined by 0.6 percentage points and 6.0 percentage points, respectively. In comparison, the growth rates in real weekly earnings and total wage earnings in accommodations declined by 1.8 percentage points and 7.0 percentage points, respectively.
Conclusion
The NLRB’s broadened joint employer standard reversed decades old precedent and is particularly consequential for the franchise business model. While franchises are among the most significant sources of job creation in the country, not every franchise-dense industry has been performing well. The accommodations industry is particularly vulnerable to the economic consequences of the new joint employer standard and early trends indicate that workers in the industry may already be paying the price. There has been a substantial slowdown in franchise employment growth in accommodations since the NLRB issued the new standard, which seems to be driving an overall decline in hotel job growth and may even be leading to a decline in pay and hours growth. Moreover, these trends are far more pronounced in accommodations than in the entire private sector, indicating that they are likely not only due to broader macroeconomic forces.
[1] “Save Local Business Act Bill Summary,” Education and Workforce Committee, House of Representatives, July 27, 2017, https://edworkforce.house.gov/news/documentsingle.aspx?DocumentID=401930.
[2] “Board Issues Decision in Browning-Ferris Industries,” National Labor Relations Board, August 27, 2015, https://www.nlrb.gov/news-outreach/news-story/board-issues-decision-browning-ferris-industries.
[3] Ben Gitis, “The NLRB’s New Joint Employer Standard, Unions, and the Franchise Business, Model,” American Action Forum, April 26, 2017, https://www.americanactionforum.org/research/nlrbs-new-joint-employer-standard-unions-franchise-business-model/.
[4] Ibid.
[5] Quarterly Census of Employment and Wages, Bureau of Labor Statistics, https://www.bls.gov/data/.
[6] “ADP National Franchise Report: June 2017,” Historical Data, https://www.adpemploymentreport.com/2017/June/NFR/NFR-June-2017.aspx.
[7] Author’s analysis of the Quarterly Census of Employment and Wages, Bureau of Labor Statistics, https://www.bls.gov/data/.
[8] Author’s analysis of the Quarterly Census of Employment and Wages, Bureau of Labor Statistics, https://www.bls.gov/data/.
[9] Robert Iafolla, “U.S. Appeals court grapples with labor board ‘joint employment’ test,” Reuters, March 9, 2017, http://www.reuters.com/article/us-usa-employment-republic-servs-idUSKBN16G2WQ.
[10] Protecting Local Business Opportunity Act, H.R.3459, 114th Congress, 2015, https://www.congress.gov/bill/114th-congress/house-bill/3459.
[11] “Save Local Business Act Bill Summary,” Education and Workforce Committee, House of Representatives, July 27, 2017, https://edworkforce.house.gov/news/documentsingle.aspx?DocumentID=401930.
[12] The pre-BFI growth rates are the compounded annual growth rates from December 2011 to December 2015. The pre-BFI period starts in 2011 because that is the first year for which ADP makes franchise employment data available. In the post-BFI period, the growth rate represents the change in employment from December 2015 to December 2016.
[13] Since ADP only provides monthly franchise employment data for the accommodations industry, total accommodations employment data comes from the Quarterly Census of Employment and Wages (QCEW). To calculate non-franchise employment levels, we simply subtracted ADP industry franchise employment estimates from QCEW total industry employment estimates.
[14] Real hourly wage, hours, and real weekly wages are from Current Employment Statistics, Bureau of Labor Statistics, https://www.bls.gov/data/.
[15] Total wage earnings are from Quarterly Census of Employment and Wages, Bureau of Labor Statistics, https://www.bls.gov/data/.
[16] Real hourly wage, hours, and real weekly wages are from Current Employment Statistics, Bureau of Labor Statistics, https://www.bls.gov/data/.
[17] Employment and total wage earnings are from Quarterly Census of Employment and Wages, Bureau of Labor Statistics, https://www.bls.gov/data/.
