


Research
August 25, 2016
U.S. Natural Gas Pipelines: An Infrastructure Crisis
Summary
- U.S. natural gas supply is at an all-time high, creating economic growth by reducing exports and solidifying energy security.
- The United States natural gas pipeline infrastructure is grossly underdeveloped and The Federal Energy Regulatory Commission’s (FERC) recent rejection of the Pacific pipeline project further exacerbates this situation.
- FERC’s inefficient pipeline approval process puts essential projects on multi-year holds and has arguably prevented the creation of over 200,000 construction jobs. The natural gas permitting process can and should be reformed.
The Shale Revolution
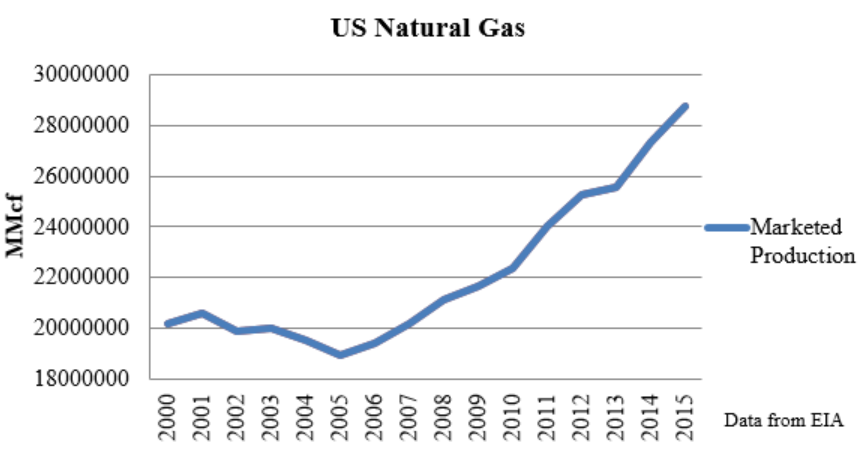
With the advent of the shale revolution, U.S. energy security has become a top priority. Technological advances in hydraulic fracturing and horizontal drilling, in addition to newly exploited gas deposits in both the Marcellus and Mancos formations, have supported a 146 percent increase in U.S. domestic production of natural gas over the past 15 years as evidenced by the graph below.[1] In response to this production boom, U.S. natural gas imports have plummeted by 75 percent over the same period.[2] According to the International Business Times, “the U.S. has surpassed oil exporting giants Saudi Arabia and Russia by holding more oil reserves for the first time ever, according to a new survey released Monday. A study, conducted by Oslo-based Rystad Energy over three years shows the U.S. holds more recoverable oil reserves that are technologically and economically possible to extract, than top global exporters. U.S. reserves are estimated at 264 billion barrels compared with Russia at 256 billion barrels and Saudi Arabia at 212 billion barrels.”
Value Add
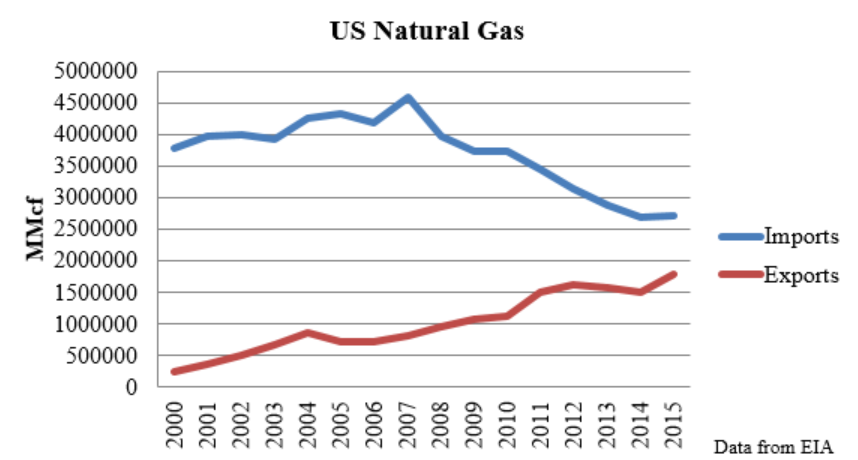
The United States Geological Survey’s (USGS) most recent evaluation has declared the Mancos Shale formation, located in Colorado and Utah, to be the nation’s second largest potential shale and gas resource. The formation encompasses an estimated 66 trillion cubic feet of natural shale gas, 74 million barrels of shale oil and 45 million barrels of natural gas liquids which include hydrocarbons such as ethane, propane, butane, isobutene and pentane. Using today’s price of natural gas ($11.51[3] per thousand cubic feet) the total value is more than $759 billion, and using today’s price of crude oil (hovering at $40 per barrel) yields a value of more than $2.96 billion. [4] With the abundance of natural gas from regions like the Mancos and Marcellus formations, imports are plummeting and exports are continuing to climb, as illustrated by the graph below. The Energy Information Administration (EIA) estimates the U.S. will become a net exporter of natural gas by 2017, contributing to the elimination of America’s foreign energy dependence.[5]
Benefits of Shale
The shale revolution has been recognized for helping to keep money in the wallets of American consumers while also reducing the focus of U.S. energy interests in foreign policy decisions. American households that use domestically produced natural gas save $840 dollars annually compared to households that rely solely on electricity. [6][7] Further, according to a study conducted by IHS Economic, increased domestic shale gas production generated an average of $1,337 of real disposable income for American families. [8] Unfortunately, these savings are diluted where distribution pipelines aren’t present.
Infrastructure Crisis
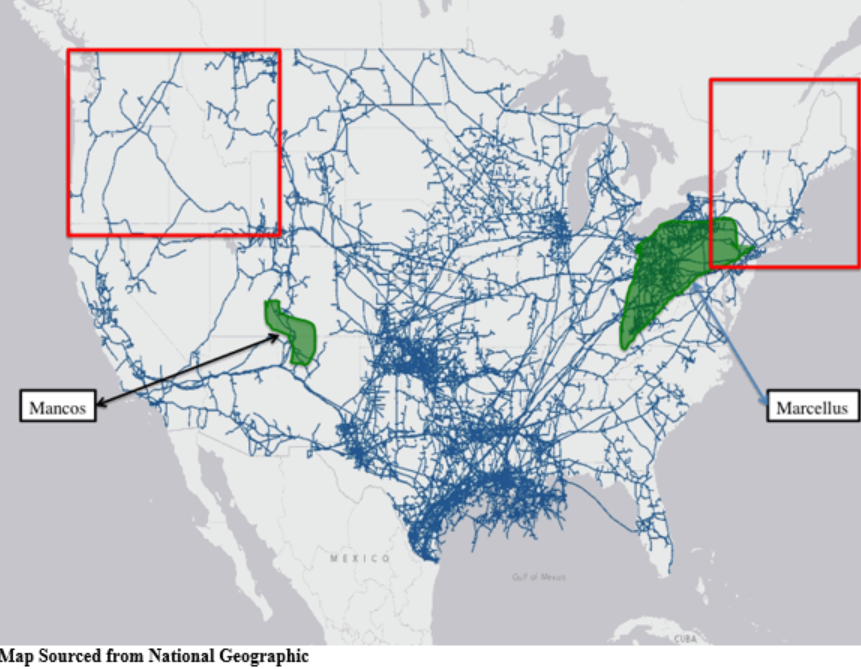
Despite the cost savings, having the world’s largest natural gas resources is useless if there is no infrastructure in place to deliver the physical resource and economic benefits to the end-user. An extensive pipeline infrastructure is essential to delivering natural gas from the extraction point to its final destination. Unfortunately, large areas of the United States are lacking sufficient pipeline infrastructure, as evidenced by the map below. Regions such as the Northwest and New England contain very little pipeline infrastructure; this forces these regions to import and purchase natural gas at a premium cost. [9]
The Costs of Imports
New England’s lack of pipeline infrastructure has forced the region to continue its reliance on foreign Liquid Natural Gas (LNG). New England is currently importing most of its LNG from Trinidad & Tobago, and these imports are causing extreme price volatility and high costs to residential consumers.[10] Like much of the U.S., New England has a strong appetite for natural gas. According to Bloomberg News, “Gas-fired plants are providing more than half of the Northeast’s power supply this month [July, 2016].”[11] The imported LNG is being transported nearly 2000 nautical miles[12] several times a month, which is significantly raising costs for residents of the Northeast. Scroll over the map below to see natural gas prices in your state.
https://www.americanactionforum.org/highmap/natural-gas-prices-state/
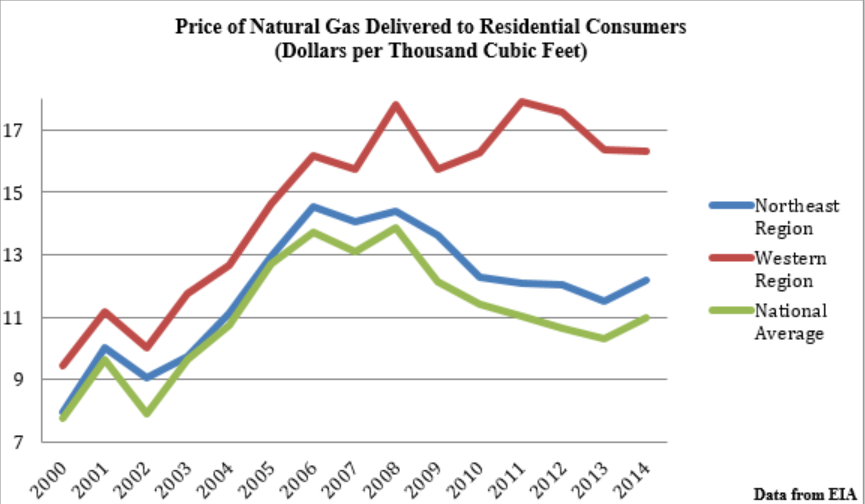
In the winter of 2014, New England was paying 15 times more for imported LNG than the cost of natural gas from the Marcellus Shale deposits in Pennsylvania. Unfortunately, this foreign dependence is not isolated; imports continue to be sourced from Norway, Canada, and the war-torn nation of Yemen. This supply dynamic is mirrored in the Northwest, where only six domestic interstate pipelines exist, none of which provides gas from the Mancos formation.[13] The chart below highlights the disproportionate costs that are seen in regions lacking adequate pipeline infrastructure.[14]
Safety
Environmentalists often argue that the economic benefits of a strong pipeline infrastructure do not outweigh the risks. However, with today’s modern pipeline safety requirements, this argument does not stand up. According to the Department of Transportation, “Pipelines are the safest, most environmentally-friendly and most efficient and reliable mode of transporting natural gas.” [15] Further, natural gas utility companies spend over $22 billion dollars a year to enhance and maintain our nation’s pipelines.[16] Pipelines are not only the safest mode of transportation; they also make the most economic sense. It would take nearly 750 tanker trucks constantly shipping out every two minutes, non-stop, 24/7 to transport the equivalent of a small to medium diameter pipeline. [17]
Regulatory Hurdles
While pipeline construction has consistently supported economic growth, energy security, and job creation, burdensome regulation from the Federal Energy Regulatory Commission (FERC) has slowed or in some cases even blocked construction. For example, after waiting three years’ for approval, FERC rejected the William’s Pacific Connector pipeline and its affiliated Jordan Cove export facility in Coos Bay, Oregon– a project, which would have provided 232 miles of new pipeline infrastructure, jobs, tax revenue, and increased exports. On July 12th 2016, the House Subcommittee on Energy and Mineral Resources heard witness testimony from the Bureau of Land Management, local elected officials, and industry leaders. The consensus among the witnesses was clear that FERC’s rejection of the Pacific Connector and the Jordan Cove export facility is hurting American workers, damaging local budgets, and is a disservice to the American consumer.
Permitting Process
Under the Natural Gas Act of 1938, companies seeking to build interstate pipelines must first obtain certificates of public convenience and necessity from FERC. The approval process is unnecessarily complex, expensive, and time consuming – often taking upwards of three years.[18] Before even officially applying, applicants must go through a six-month pre-filing process requiring constant communication with FERC and submit over 10 full reports on the expected construction and environmental impacts. According to ADI Analytics, one report submitted by an applicant was over 12,000 pages long.[19] Only following this extensive pre-filling process does FERC even begin its official review, but even then, the timeline is uncertain and extensive. According to FERC, Maine’s Down East Pipeline, which was filed for approval in December of 2006, over a decade ago, is still awaiting judgment.[20]Meanwhile, it takes an average of only 30 days for states to permit oil or gas wells. [21]
The Keystone Pipeline is a perfect example of the painstakingly overregulated pipeline permitting process. The 1,179-mile line was poised to run from Montana to Nebraska and was estimated to deliver 830,000 barrels a day to crude refiners along the gulf coast. After a seven-year review period, President Obama denied operator TransCanada the required presidential permit. This project would have provided thousands of U.S. jobs. According to a previous the Keystone Pipeline would have grossed over $15 billion a year in revenue. $175 billion in economic activity went untapped due to delay and ultimate permit denial.
Taking it National
The need for additional natural gas pipeline infrastructure is not isolated to the Northwest and Northeast regions. The federal government’s excessive pipeline regulation has blocked industry from passing economic benefits on to consumers and manufacturers. Natural gas provides a third of all U.S. energy,[i] 64 percent more than in 2000,[ii] but total gas pipeline mileage has only increased by 15 percent over the same period. [iii] In 2015, a report by the National Association of Manufacturers showed that natural gas provided 57.9 direct, indirect and induced jobs per mile constructed.[iv] In 2015 alone FERC was overseeing 80 major pipeline projects amounting to 6,327 miles of major pipeline projects, many which had been in process for years. Between 2006 and 2016 there have been 52[v] pending natural gas pipeline projects waiting for approval, this pipeline mileage alone would have accounted for over 200,000 U.S. jobs.[vi]
Conclusion
Pipelines are the safest and most effective instrument for transporting oil and natural gas around the United States. The over-regulation and painstakingly slow approval process by government agencies, such as FERC, is a substantial hurdle. Weak pipeline distribution networks ultimately contribute to higher prices, which disproportionately impact low-income Americans.[27] Pipeline infrastructure creates jobs and economic growth. Policymakers should support pro-growth policy that allows industry and taxpayers to reap the benefits of our domestic natural resources.
[i] https://www.eia.gov/tools/faqs/faq.cfm?id=427&t=3
[ii]http://www.eia.gov/electricity/data/browser/#/topic/8?agg=2,0,1&fuel=vtvv&geo=g&sec=g&linechart=ELEC.CONS_TOT_BTU.NG-US-99.A~~~~&columnchart=ELEC.CONS_TOT_BTU.COW-US-99.A&map=ELEC.CONS_TOT_BTU.COW-US-99.A&freq=A&start=2001&end=2015&chartindexed=1&ctype=linechart<ype=pin&rtype=s&maptype=0&rse=0&pin=
[iv] http://www.nam.org/Data-and-Reports/Reports/Natural-Gas-Study/Energizing-Manufacturing-Full-Report/
[v] http://www.ferc.gov/industries/gas/indus-act/pipelines/pending-projects.asp
[vi] http://www.ferc.gov/industries/gas/indus-act/pipelines/pending-projects.asp
[1] https://www.eia.gov/dnav/ng/hist/n9050us2a.htm
[2] https://www.eia.gov/dnav/ng/hist/n9180us1A.htm
[3] https://www.eia.gov/dnav/ng/hist/n3010us3m.htm
[4] https://www.usgs.gov/news/usgs-estimates-66-trillion-cubic-feet-natural-gas-colorado-s-mancos-shale-formation
[5] https://www.eia.gov/dnav/ng/hist/n9180us1A.htm
[6] http://www.bloomberg.com/news/articles/2016-07-12/pipeline-phobia-keeps-new-england-s-unlikely-trade-route-open
[7] https://www.aga.org/news/news-releases/new-data-highlights-natural-gas-savings-consumers-and-our-economy
[8] http://www.nam.org/Data-and-Reports/Reports/Natural-Gas-Study/Energizing-Manufacturing-Full-Report/
[9] EIA
[10] http://www.bloomberg.com/news/articles/2016-07-12/pipeline-phobia-keeps-new-england-s-unlikely-trade-route-open
[11] http://www.bloomberg.com/news/articles/2016-07-12/pipeline-phobia-keeps-new-england-s-unlikely-trade-route-open
[12] http://www.sea-distances.org/
[13] https://www.eia.gov/pub/oil_gas/natural_gas/analysis_publications/ngpipeline/western.html
[14] http://www.eia.gov/dnav/ng/ng_pri_sum_a_epg0_prs_dmcf_a.htm
[15]http://phmsa.dot.gov/portal/site/PHMSA/menuitem.6f23687cf7b00b0f22e4c6962d9c8789/?vgnextoid=2c6924cc45ea4110VgnVCM1000009ed07898RCRD&vgnextchannel=daa52186536b8210VgnVCM1000001ecb7898RCRD&vgnextfmt=print
[16]http://phmsa.dot.gov/portal/site/PHMSA/menuitem.6f23687cf7b00b0f22e4c6962d9c8789/?vgnextoid=2c6924cc45ea4110VgnVCM1000009ed07898RCRD&vgnextchannel=daa52186536b8210VgnVCM1000001ecb7898RCRD&vgnextfmt=print
[17]http://phmsa.dot.gov/portal/site/PHMSA/menuitem.6f23687cf7b00b0f22e4c6962d9c8789/?vgnextoid=2c6924cc45ea4110VgnVCM1000009ed07898RCRD&vgnextchannel=daa52186536b8210VgnVCM1000001ecb7898RCRD&vgnextfmt=print
[18] http://adi-analytics.com/2015/02/17/summary-of-the-lng-export-regulatory-process/
[19] http://adi-analytics.com/2015/02/17/summary-of-the-lng-export-regulatory-process/
[20] https://www.ferc.gov/industries/gas/indus-act/pipelines/pending-projects.asp
[21] RNC PLATFORM PG 19
[22] https://www.eia.gov/tools/faqs/faq.cfm?id=427&t=3
[23]http://www.eia.gov/electricity/data/browser/#/topic/8?agg=2,0,1&fuel=vtvv&geo=g&sec=g&linechart=ELEC.CONS_TOT_BTU.NG-US-99.A~~~~&columnchart=ELEC.CONS_TOT_BTU.COW-US-99.A&map=ELEC.CONS_TOT_BTU.COW-US-99.A&freq=A&start=2001&end=2015&chartindexed=1&ctype=linechart<ype=pin&rtype=s&maptype=0&rse=0&pin=
[25] http://www.nam.org/Data-and-Reports/Reports/Natural-Gas-Study/Energizing-Manufacturing-Full-Report/
[26] http://www.ferc.gov/industries/gas/indus-act/pipelines/pending-projects.asp
[27] RNC platform pg 19