Research
June 16, 2025
Update: Are Monopolies Really a Growing Feature of the U.S. Economy?
Executive Summary
- Changes to antitrust enforcement policy during the Biden Administration were guided by the belief that “excessive market concentration” was threatening “basic economic liberties, democratic accountability, and the welfare of workers, farmers, small businesses, startups, and consumers.”
- This contention was dubious at the time, and new data from the 2022 Economic Census shows no evidence to support the claim that oligopolies and monopolies were gaining ground as the predominant market structure in the U.S. economy; most industries continued to operate in a low-concentration environment.
- This study finds that the share of industries operating in high, medium, and low concentration environments has remained relatively stable over the past 20 years.
Introduction
In July 2021, President Biden’s Executive Order on “Promoting Competition in the American Economy” set in motion a “whole-of-government” approach to antitrust enforcement that was broadly skeptical of market concentration. The fear among the nation’s trustbusters was that “excessive market concentration” was threatening “basic economic liberties, democratic accountability, and the welfare of workers, farmers, small businesses, startups, and consumers.”
This concern prompted the federal antitrust agencies – the Federal Trade Commission and Department of Justice – to rewrite the jointly published 2023 Merger Guidelines. The updated guidelines jettisoned the consumer welfare standard that had guided antitrust enforcement for nearly 50 years and replaced it with a “big is bad” approach focusing largely on firm size. The agencies adopted several policies designed to quash merger activity by raising the cost of mergers.
Like previous iterations, new data from the 2022 Economic Census show no evidence to support the claim the oligopolies and monopolies were gaining ground as the predominant market structure in the U.S. economy. Most industries continued to operate in a low-concentration environment.
This research – which provides an update to previous American Action Forum research that found, using the 2017 Economic Census, no evidence to support the claim of increased industry concentration – finds that the share of industries operating in high, medium, and low concentration environments has remained relatively stable over the past 20 years.
Market Concentration Levels
To measure concentration, this study focuses on the share of sales by the four largest firms (CR4) in an industry and identifies industries using the North American Industry Classification System (NAICS). There are degrees of specificity ranging from a 2-digit NAICS code (a general sector, e.g., 22 – Utilities) to a 6-digit code (a specific industry, e.g., 221115 – Wind Electric Power Generation).
The main finding is displayed in Figure 1. It shows that the distribution of market concentration largely remained unchanged between 2002 and 2022. In 2002, just 9 percent of all 6-digit NAICS industries were classified as highly concentrated with a CR4 of 70 percent or greater. Fast forward to 2022, and the share of highly concentrated industries was slightly lower at 8 percent, unchanged from 2017.
The average CR4 for all 6-digit NAICS industries in 2002 was 35.0 percent. That level increased to 36.8 percent in 2007 before falling to 35.2 percent in 2012, to 34.8 percent in 2017, and to 34.7 percent in 2022 (the last year for which there are data).
Comparing 6-digit NAICS codes with data for both 2002 and 2022, the average change in CR4 was 2.6 percentage points. Forty percent of firms saw a decrease in the CR4, while just 21 percent saw an increase of 10 percentage points or more.
For industries with data for both 2017 and 2022, nearly half (46.9 percent) saw a decrease in the CR4, showing a lower share of sales among the four largest firms. The average change in the CR4 was an increase of 0.4 percentage points, while the median change was up 0.2 percentage points. Of the industries that saw an increase in concentration ratios, only 5.6 percent increased by at least 10 percentage points.
The stability of the distribution among low, medium, and high concentration levels and the small share of the sample with an increase of the CR4 of greater than 10 percentage points makes it difficult to argue that industries have become more concentrated over time.
Figure 1

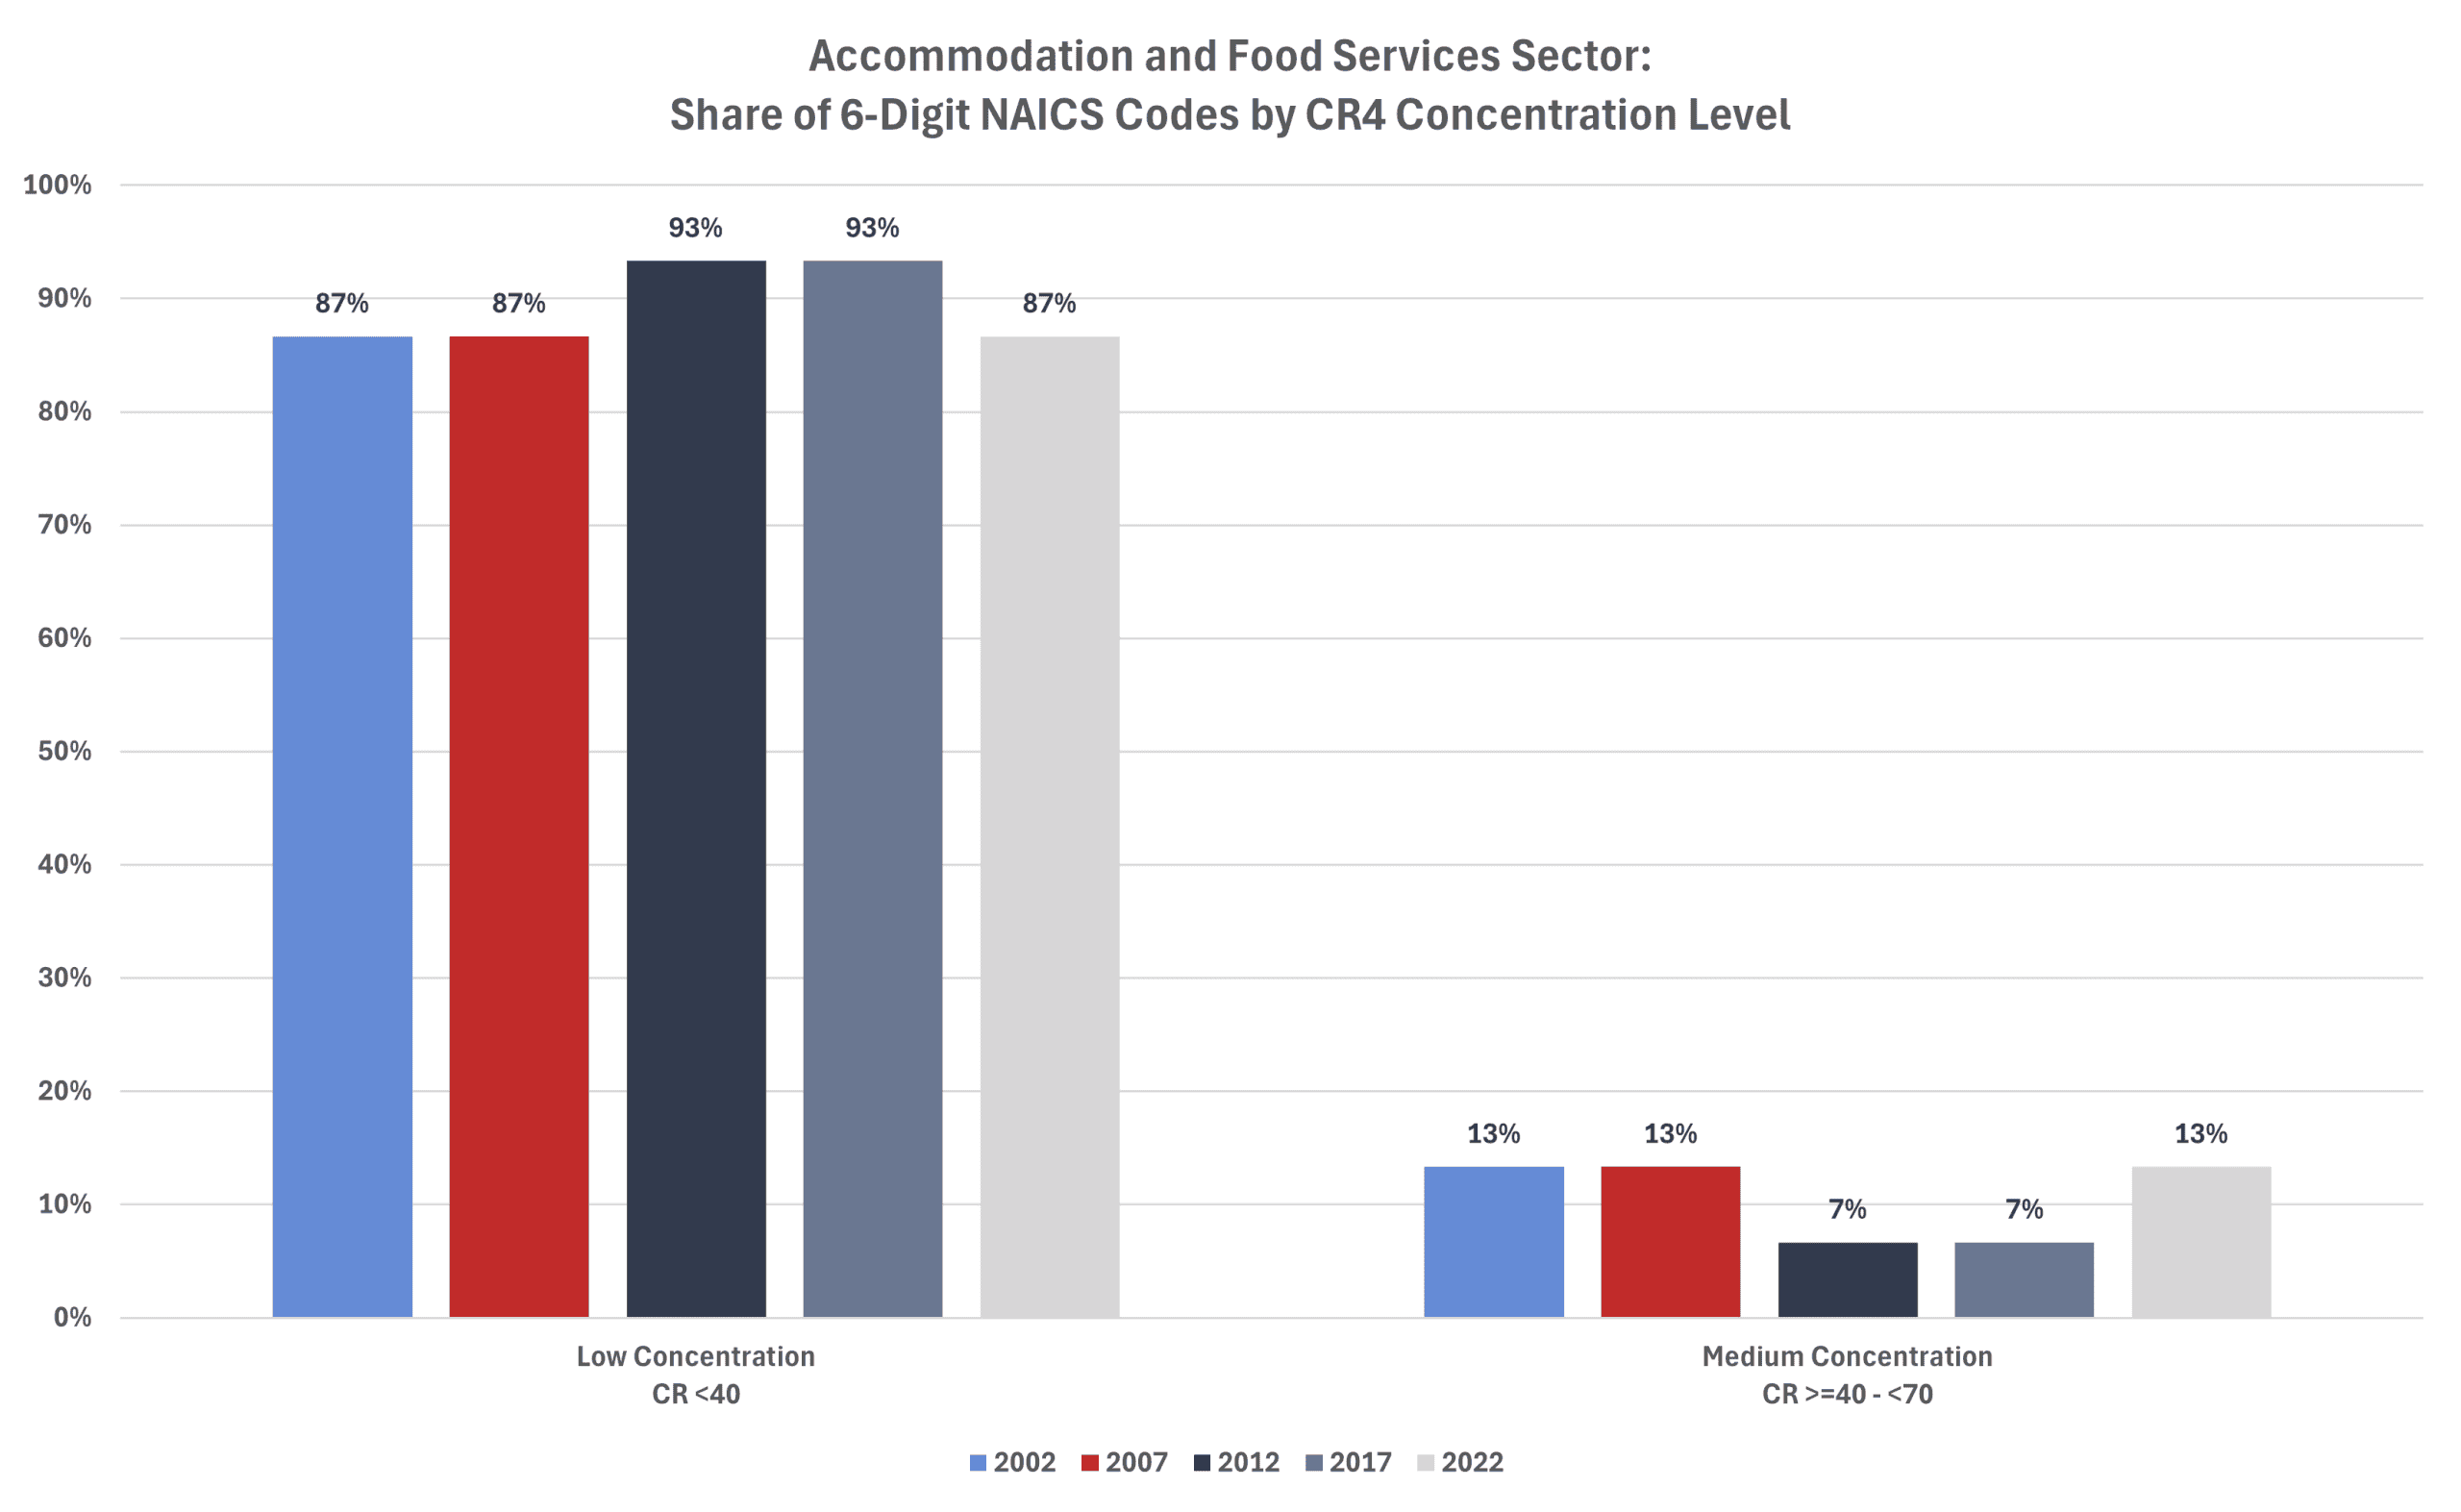
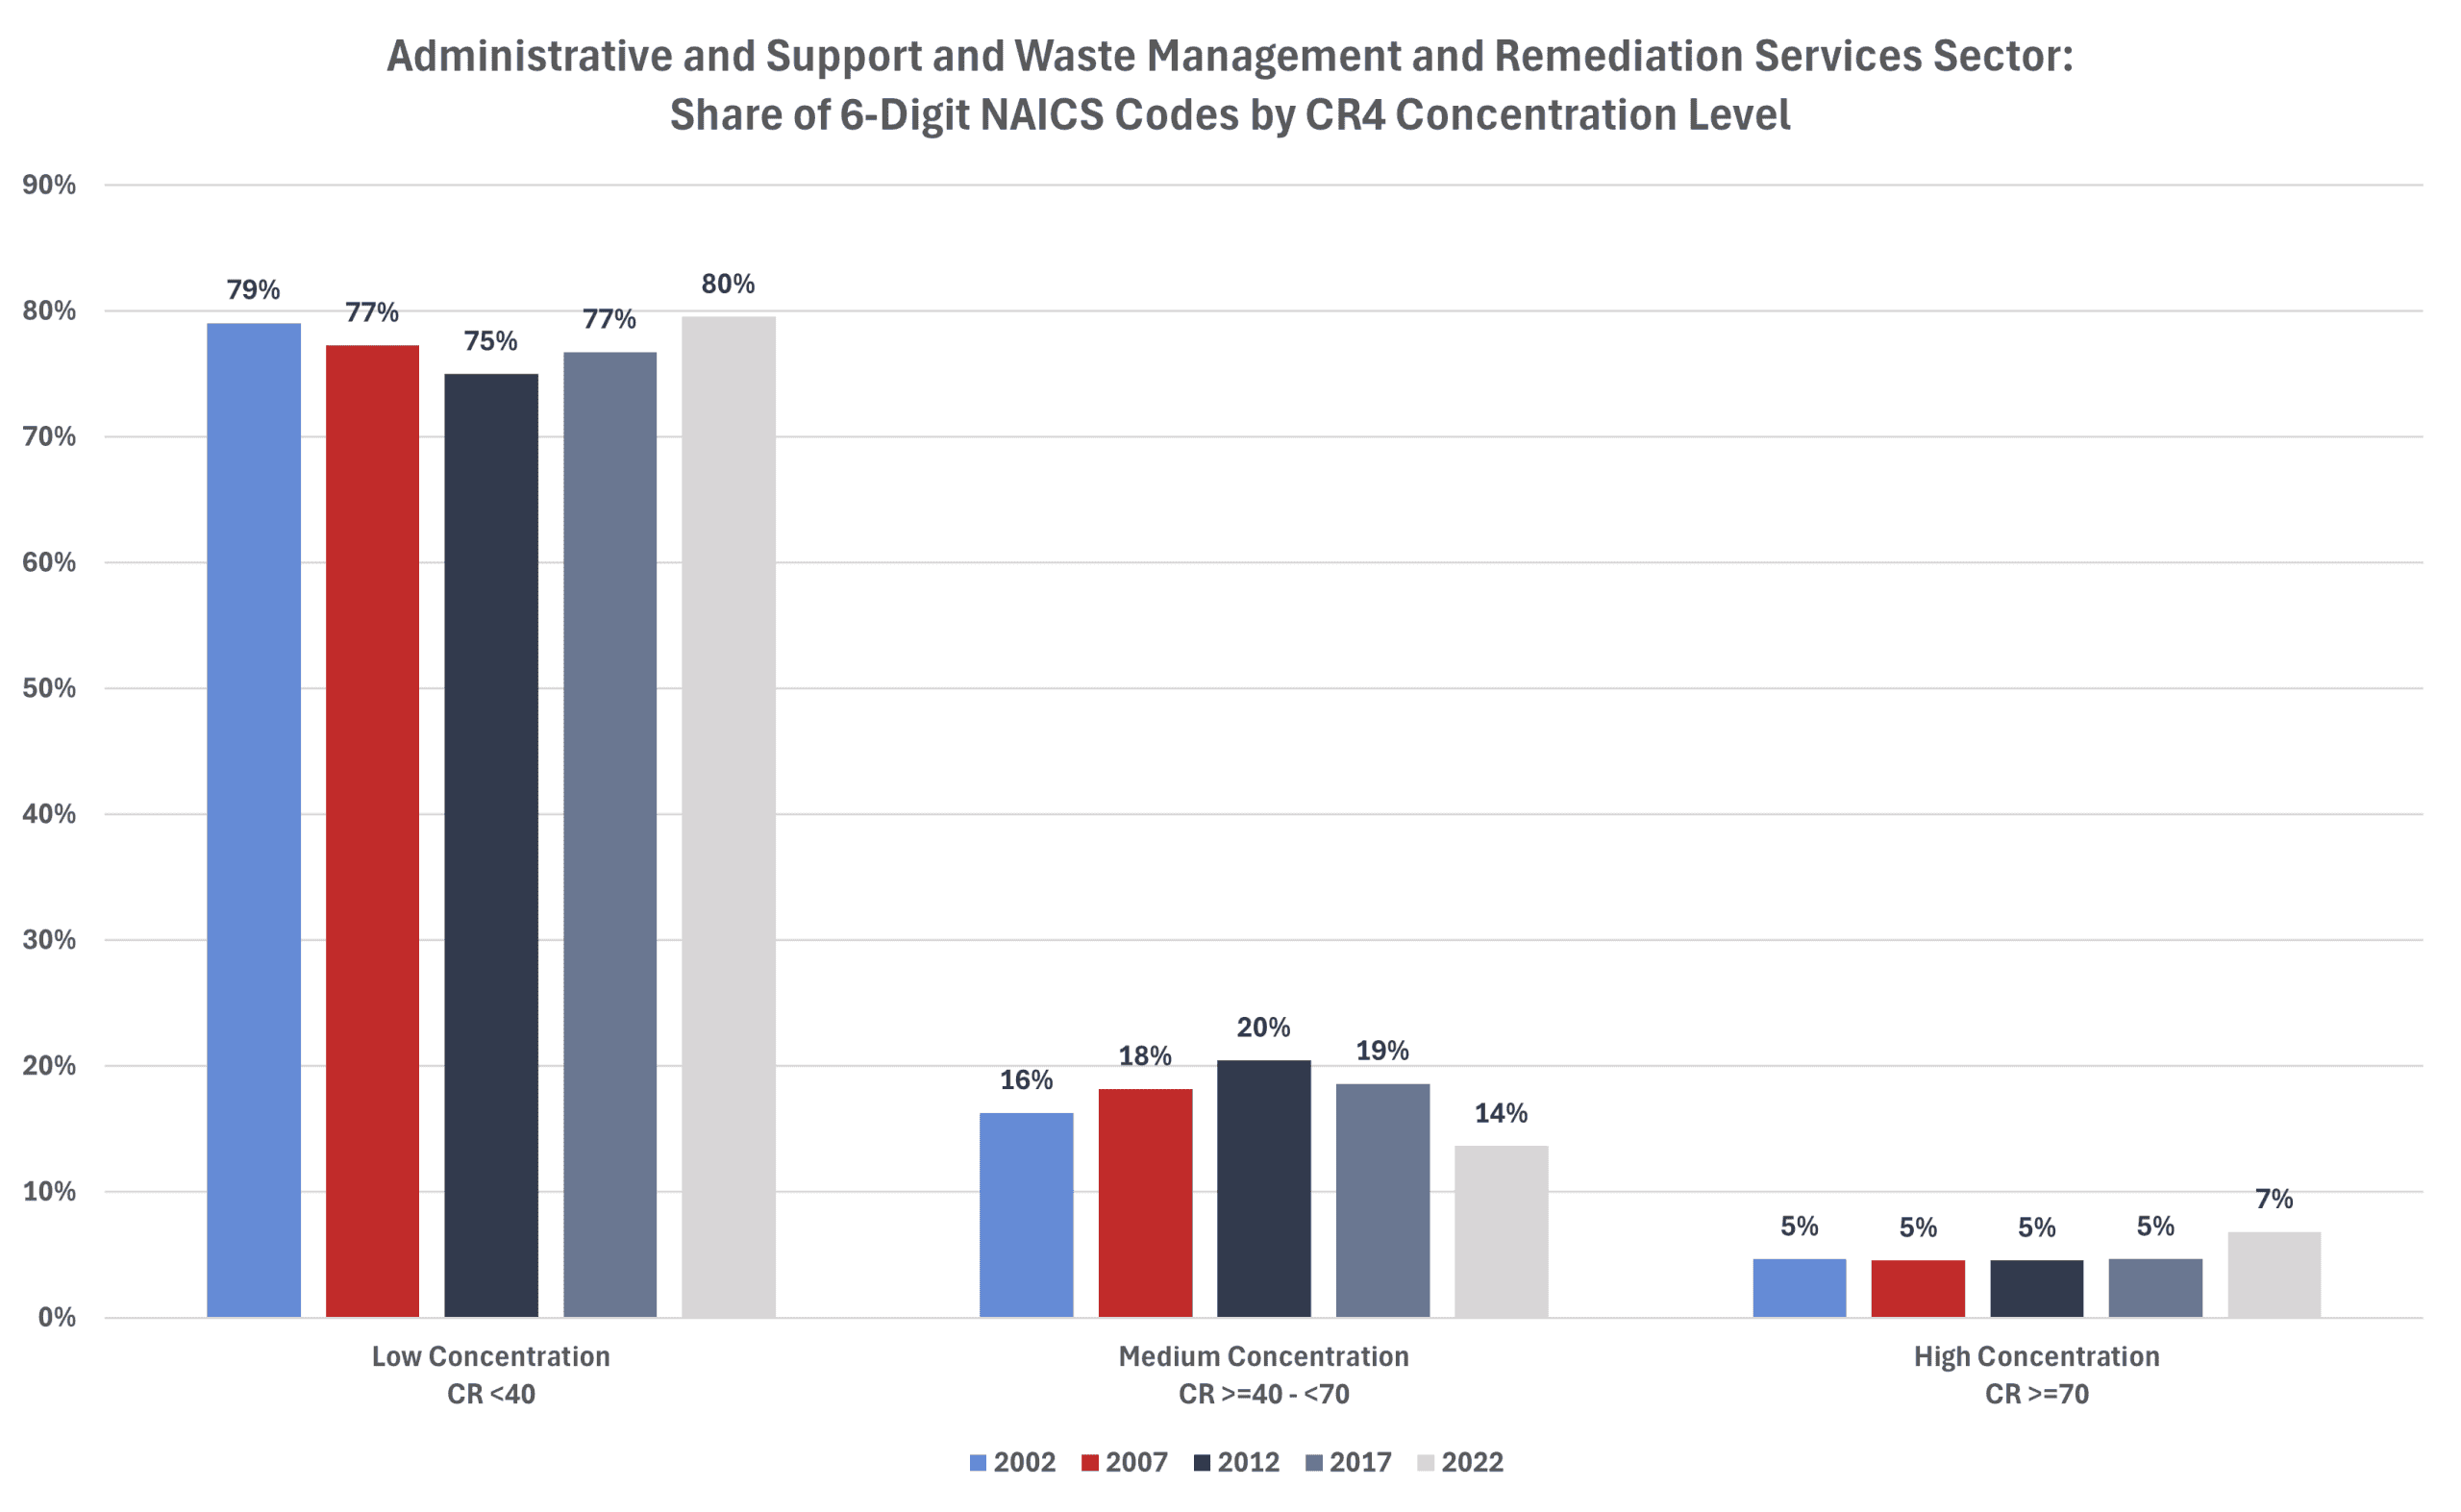
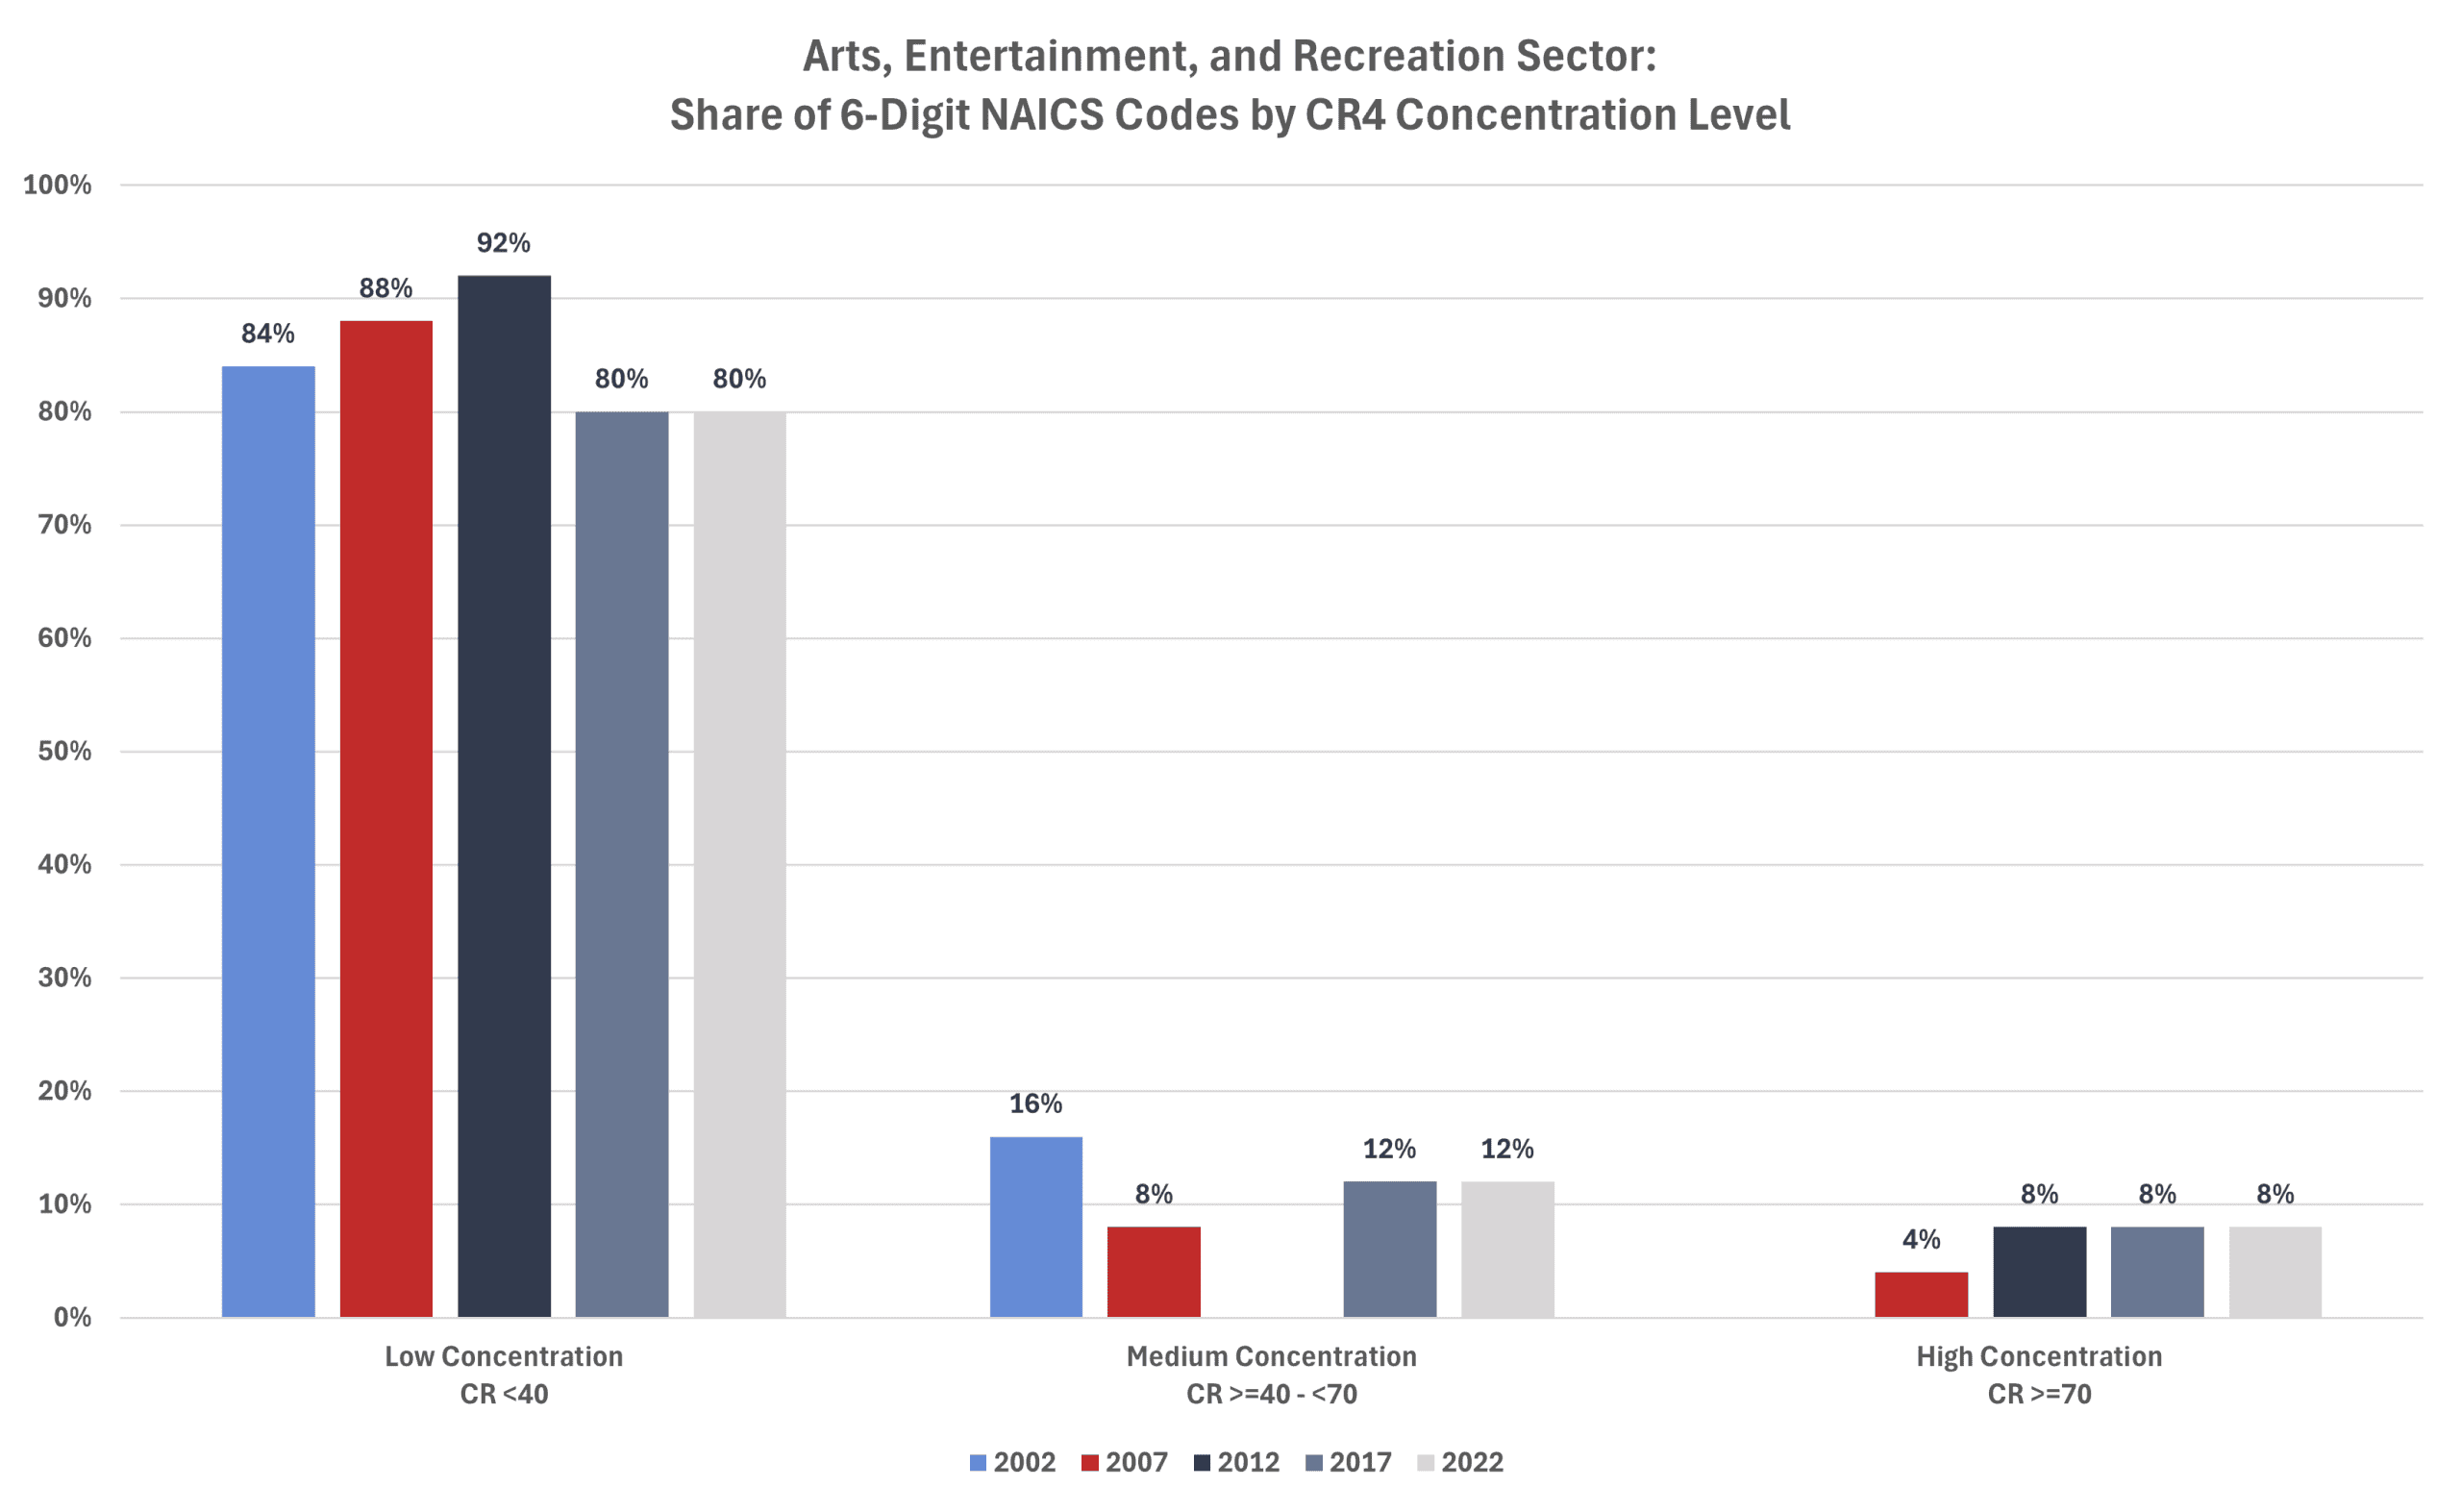
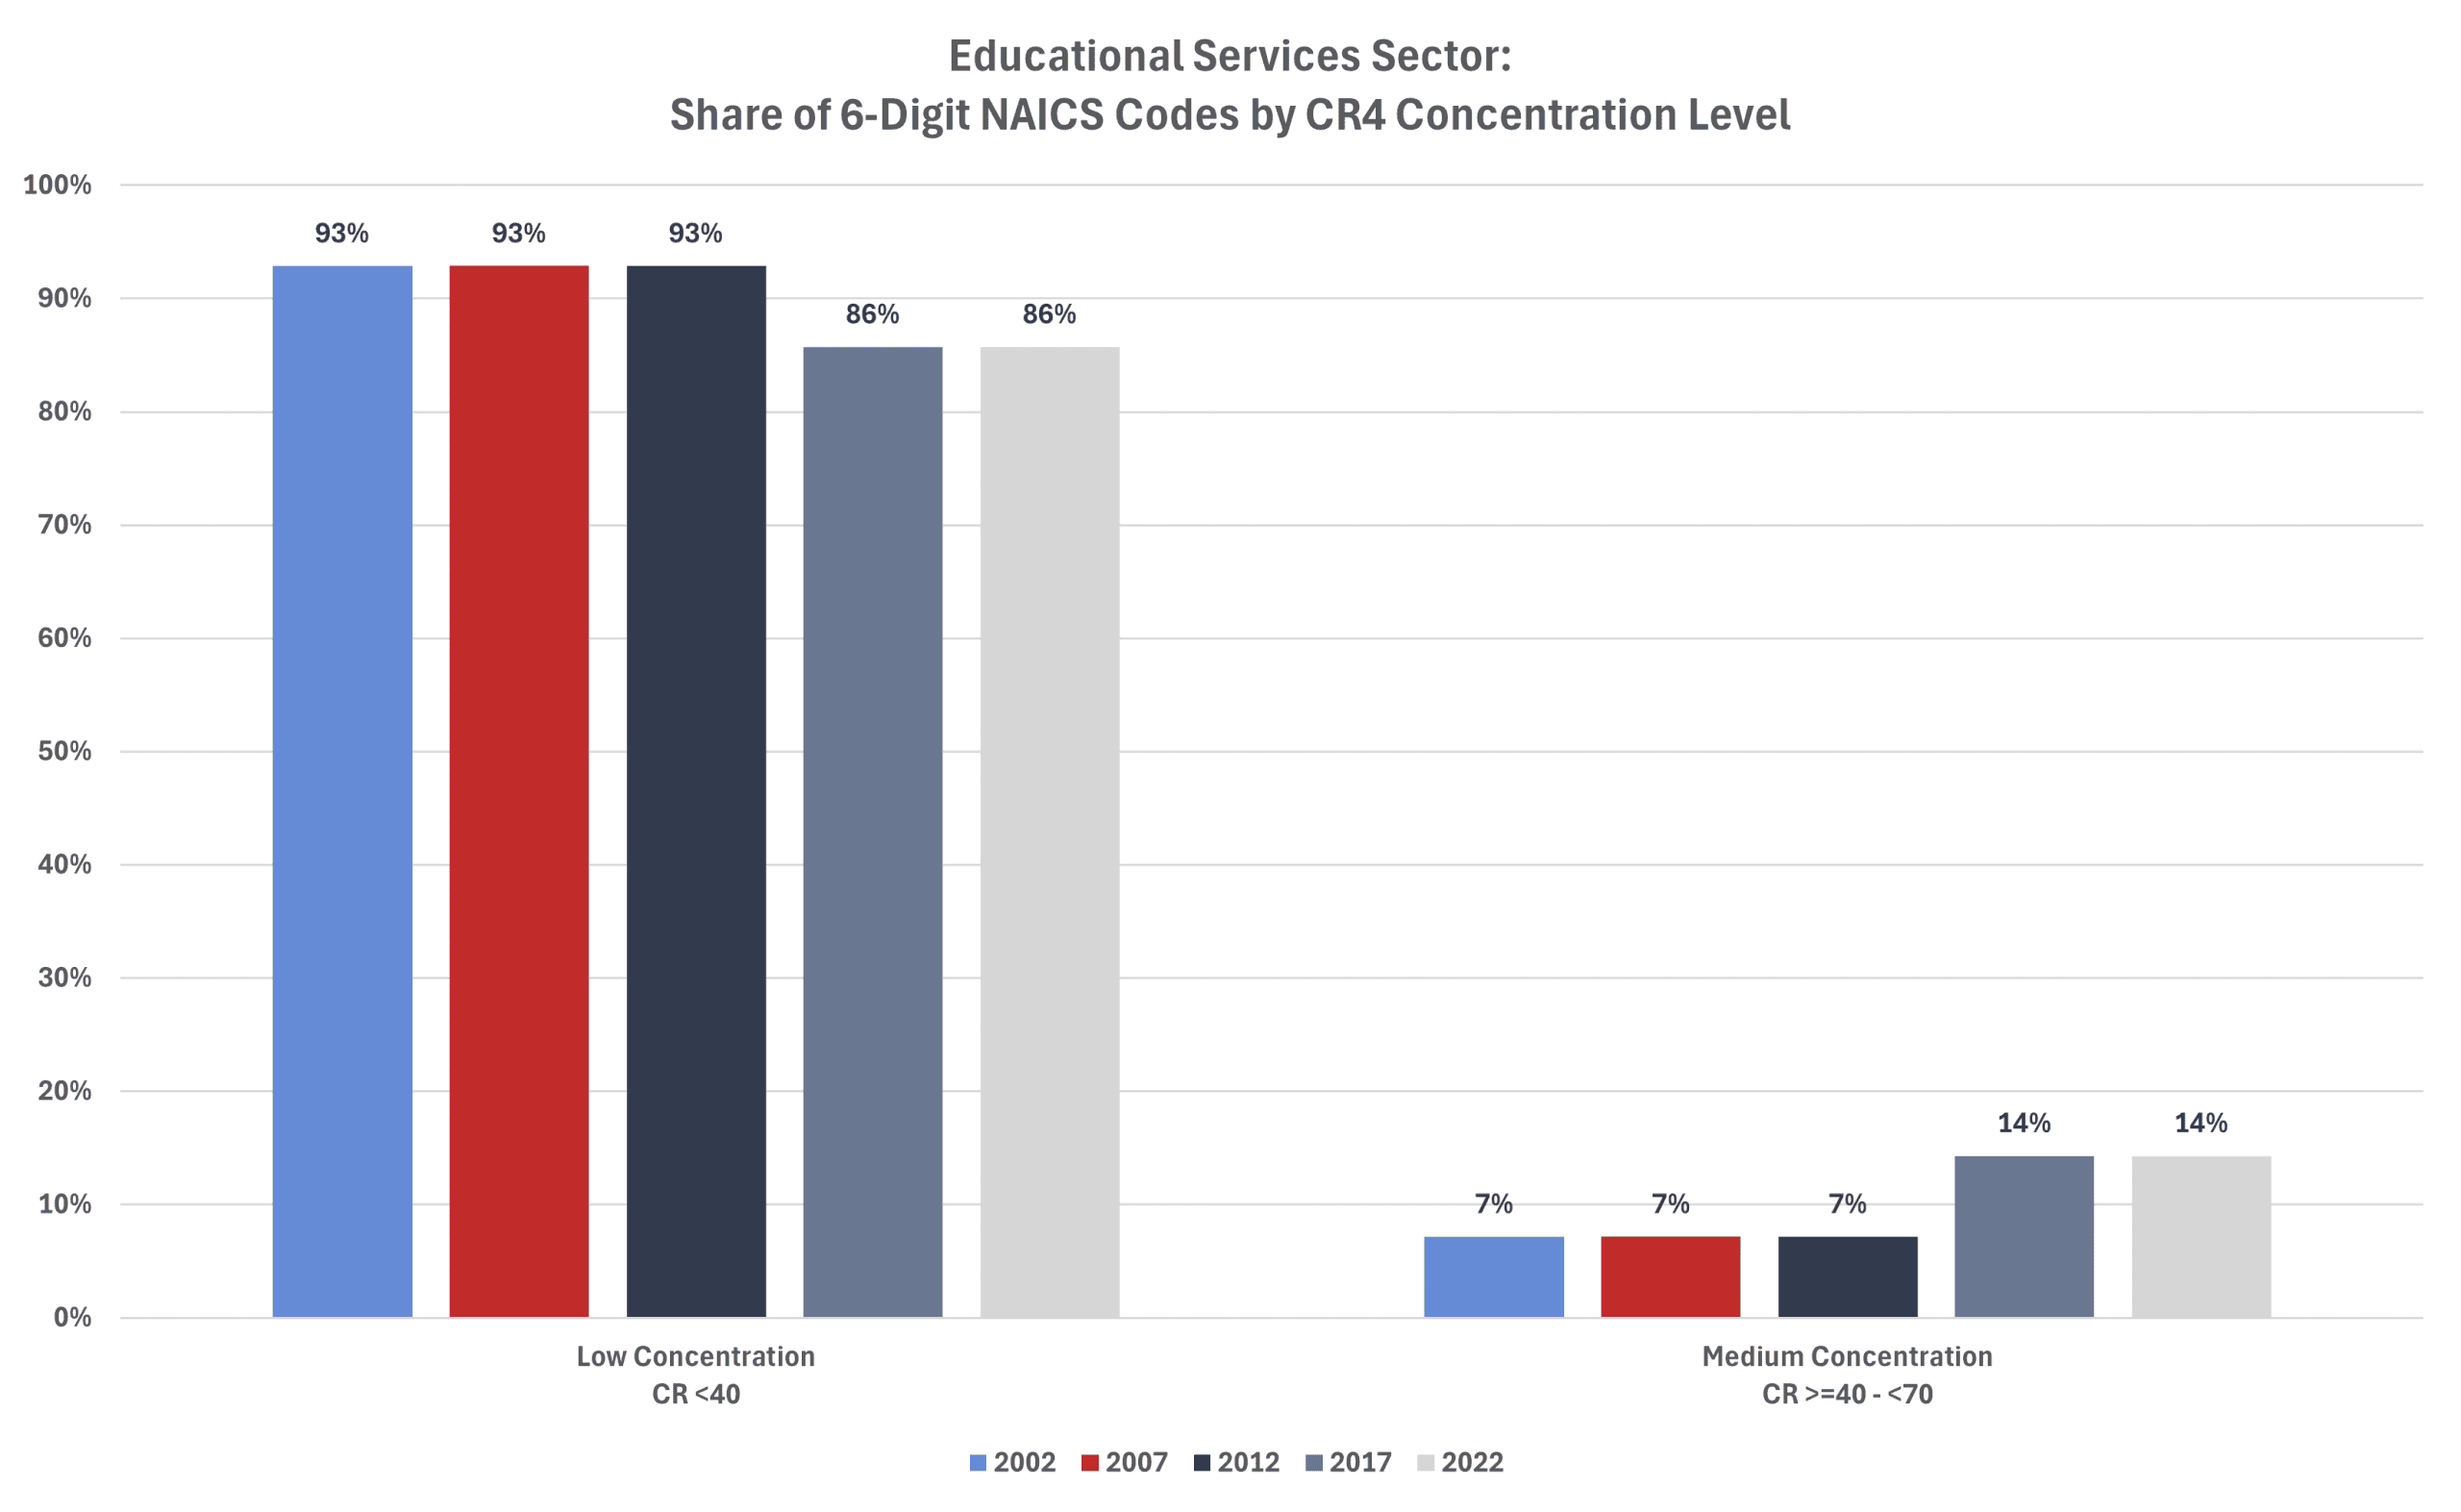
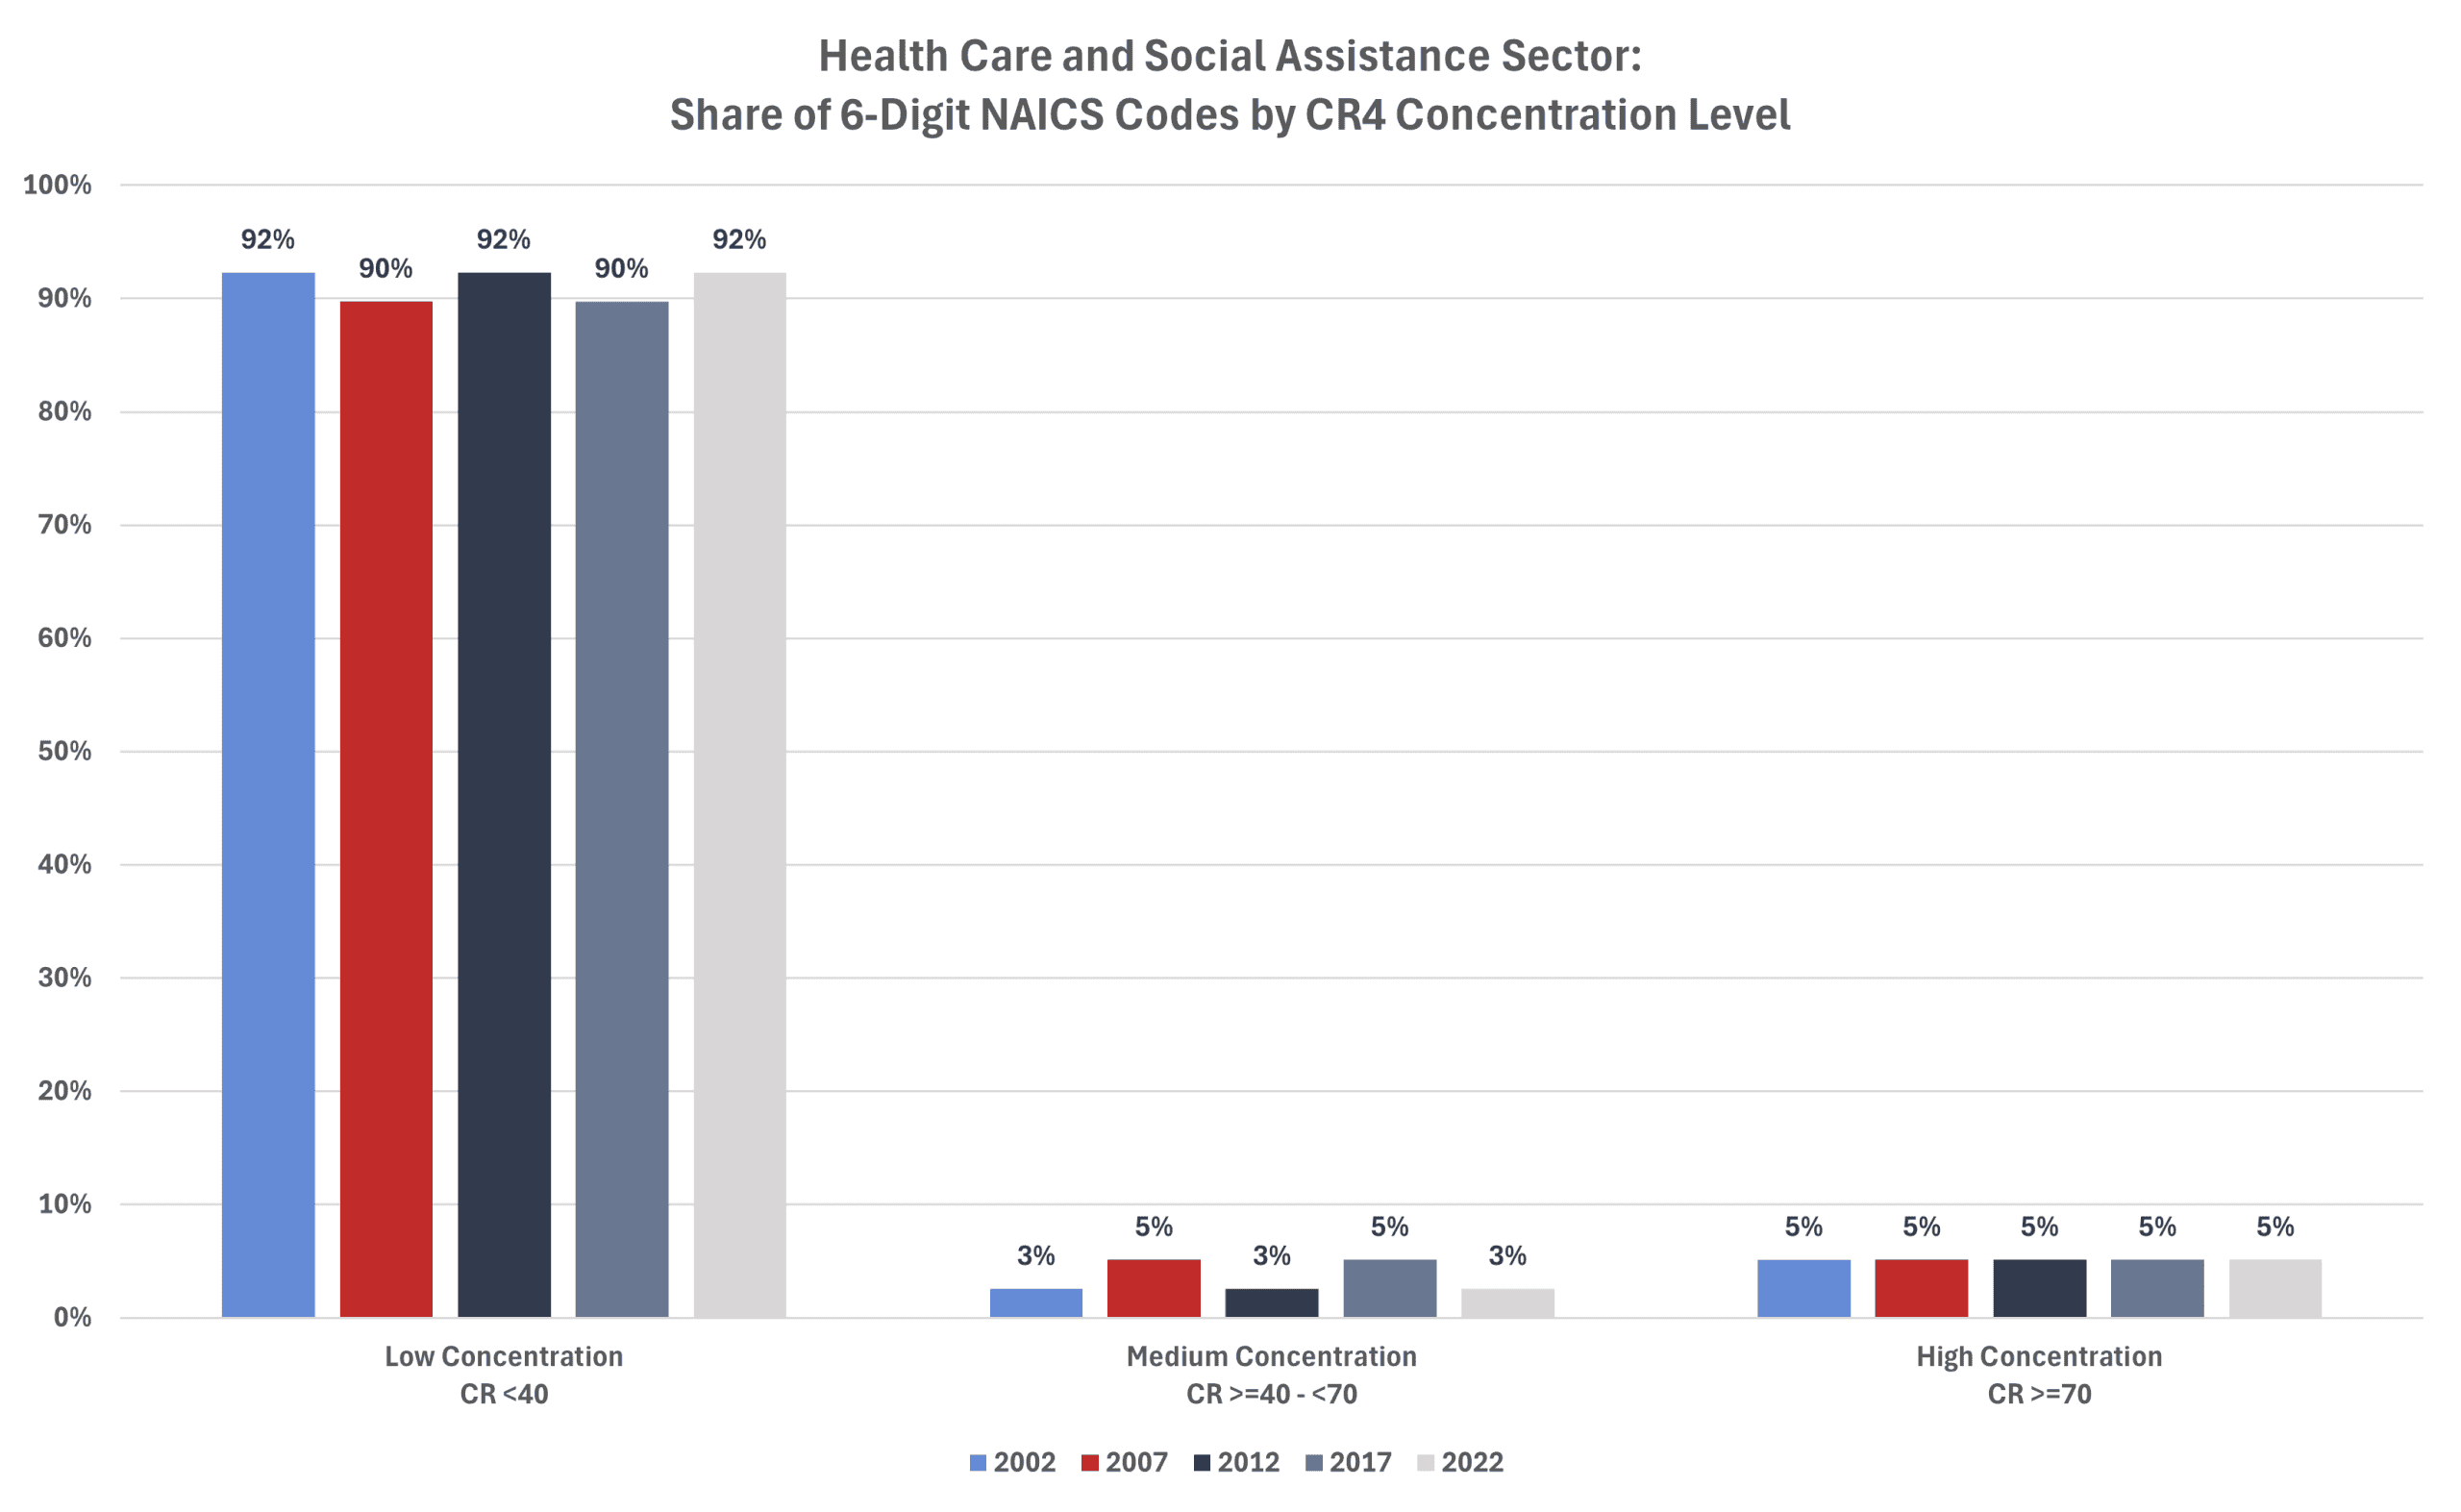
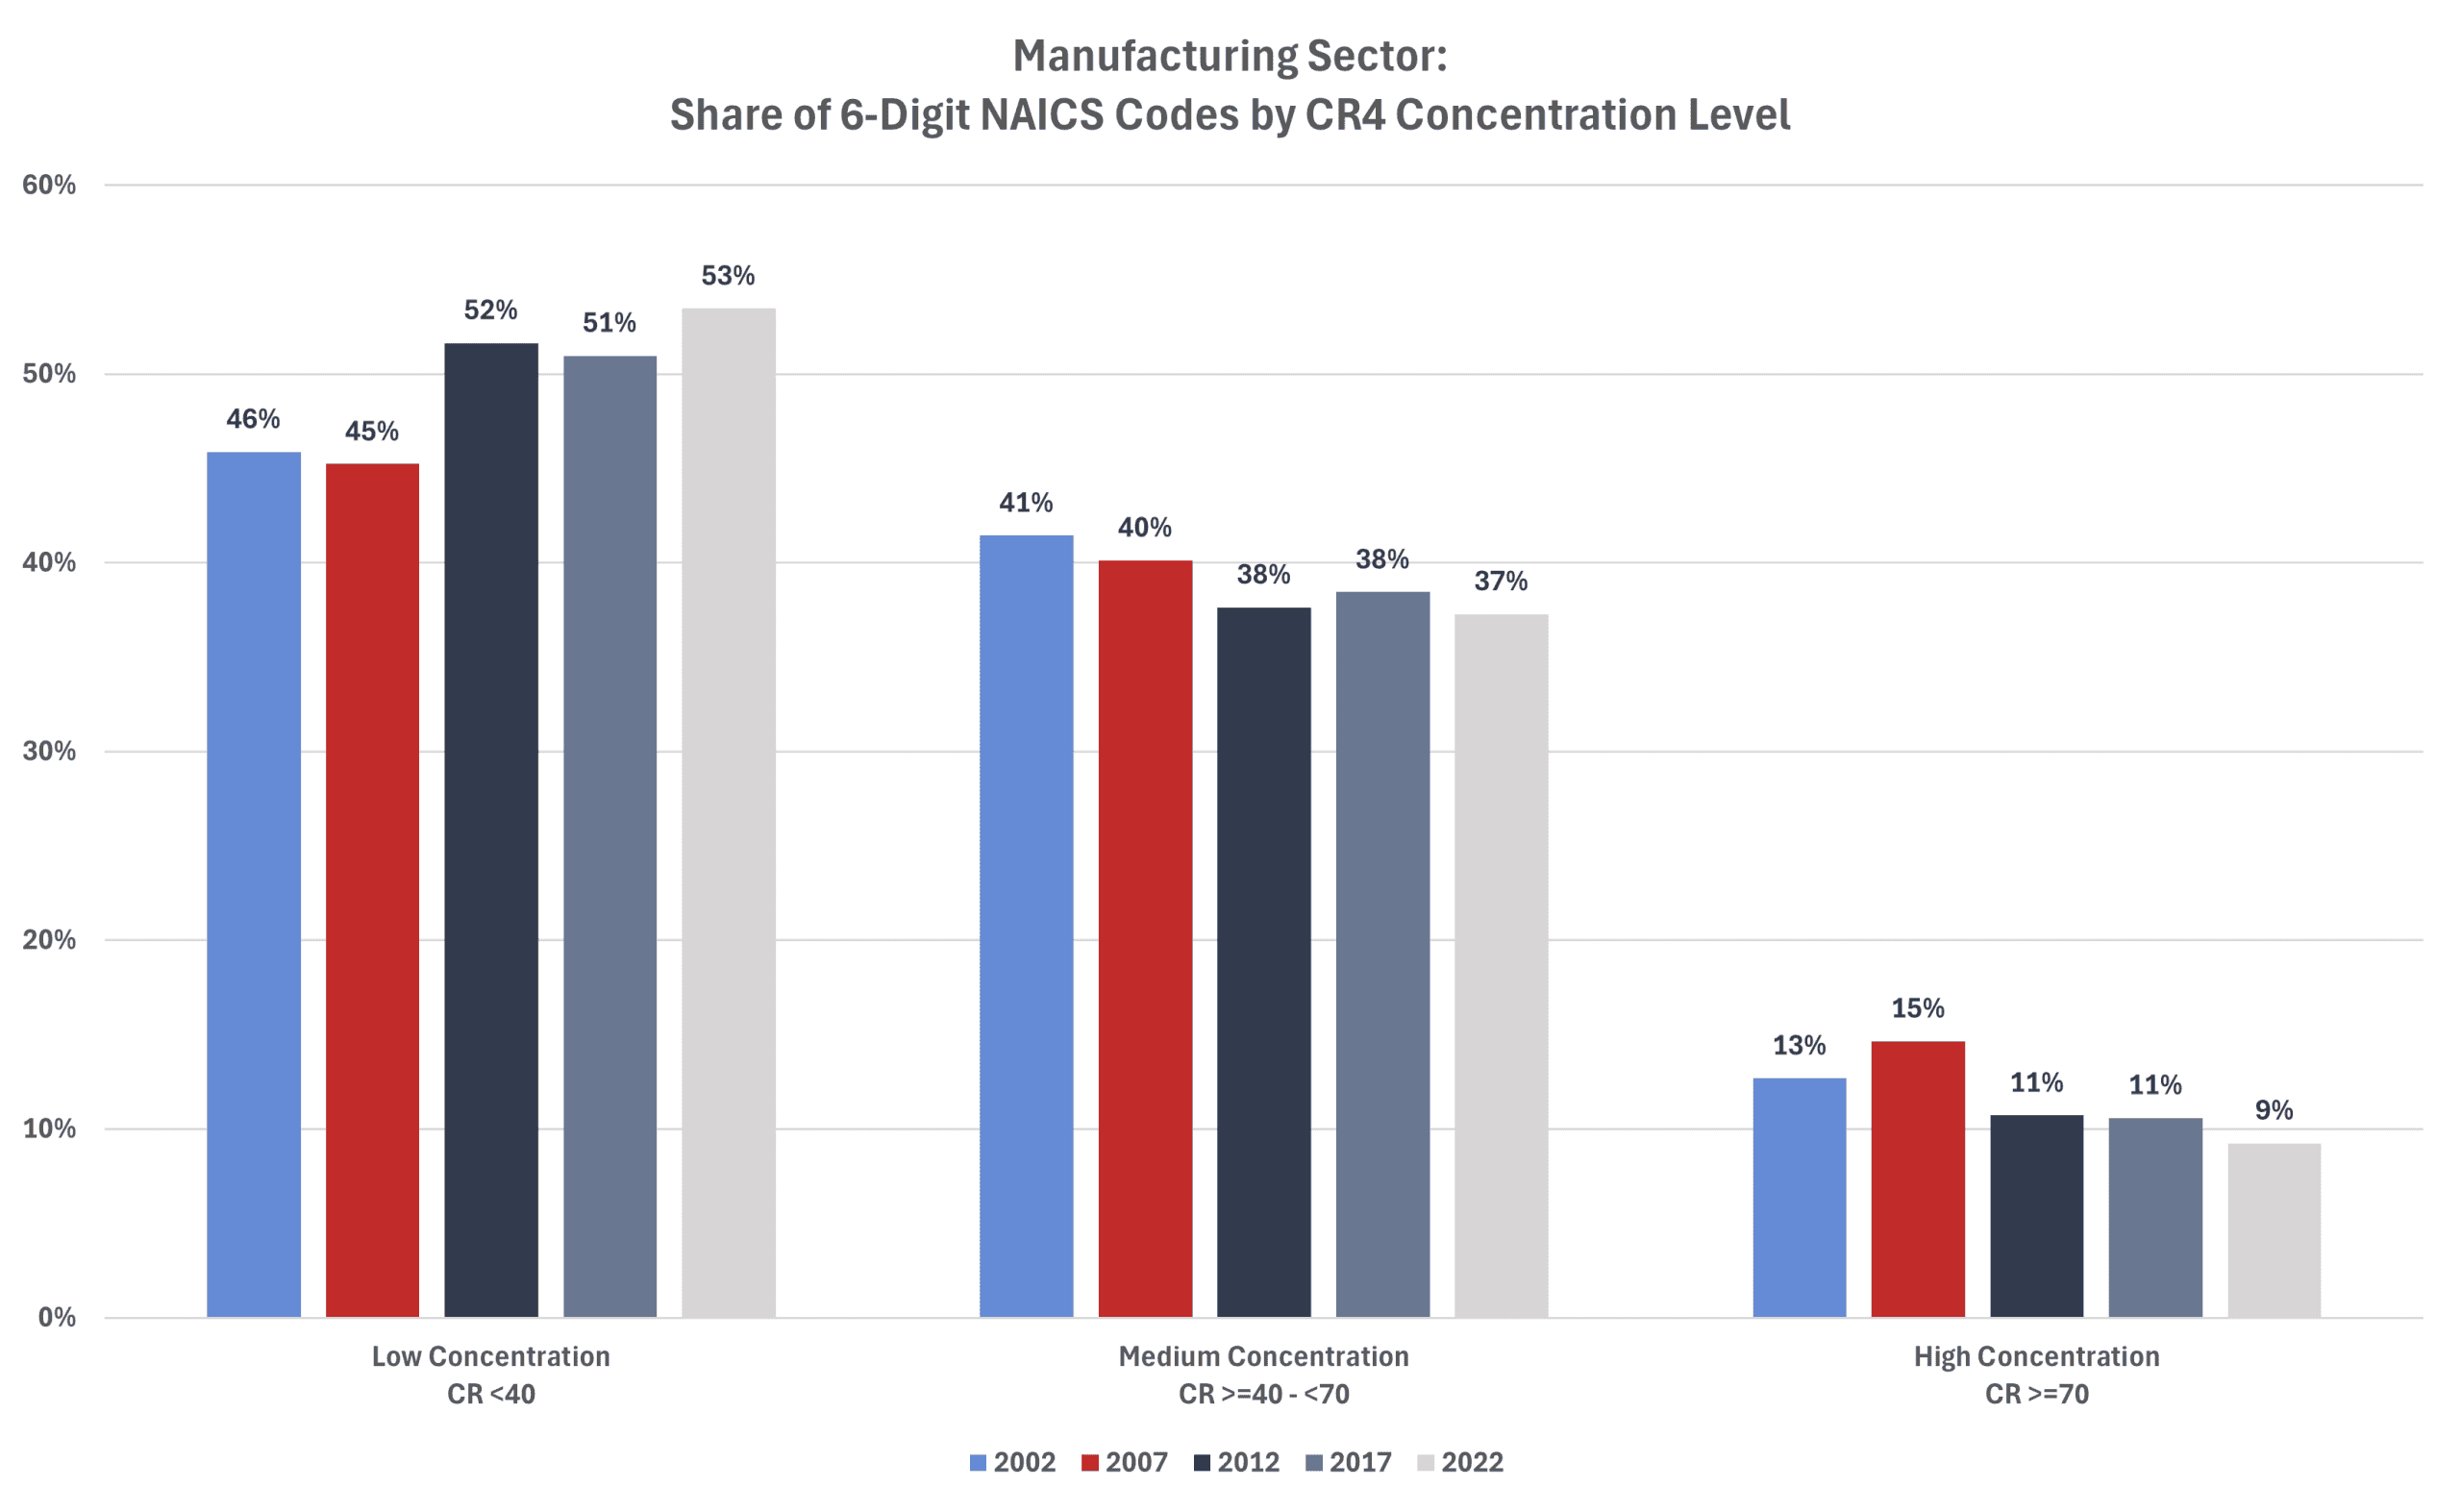
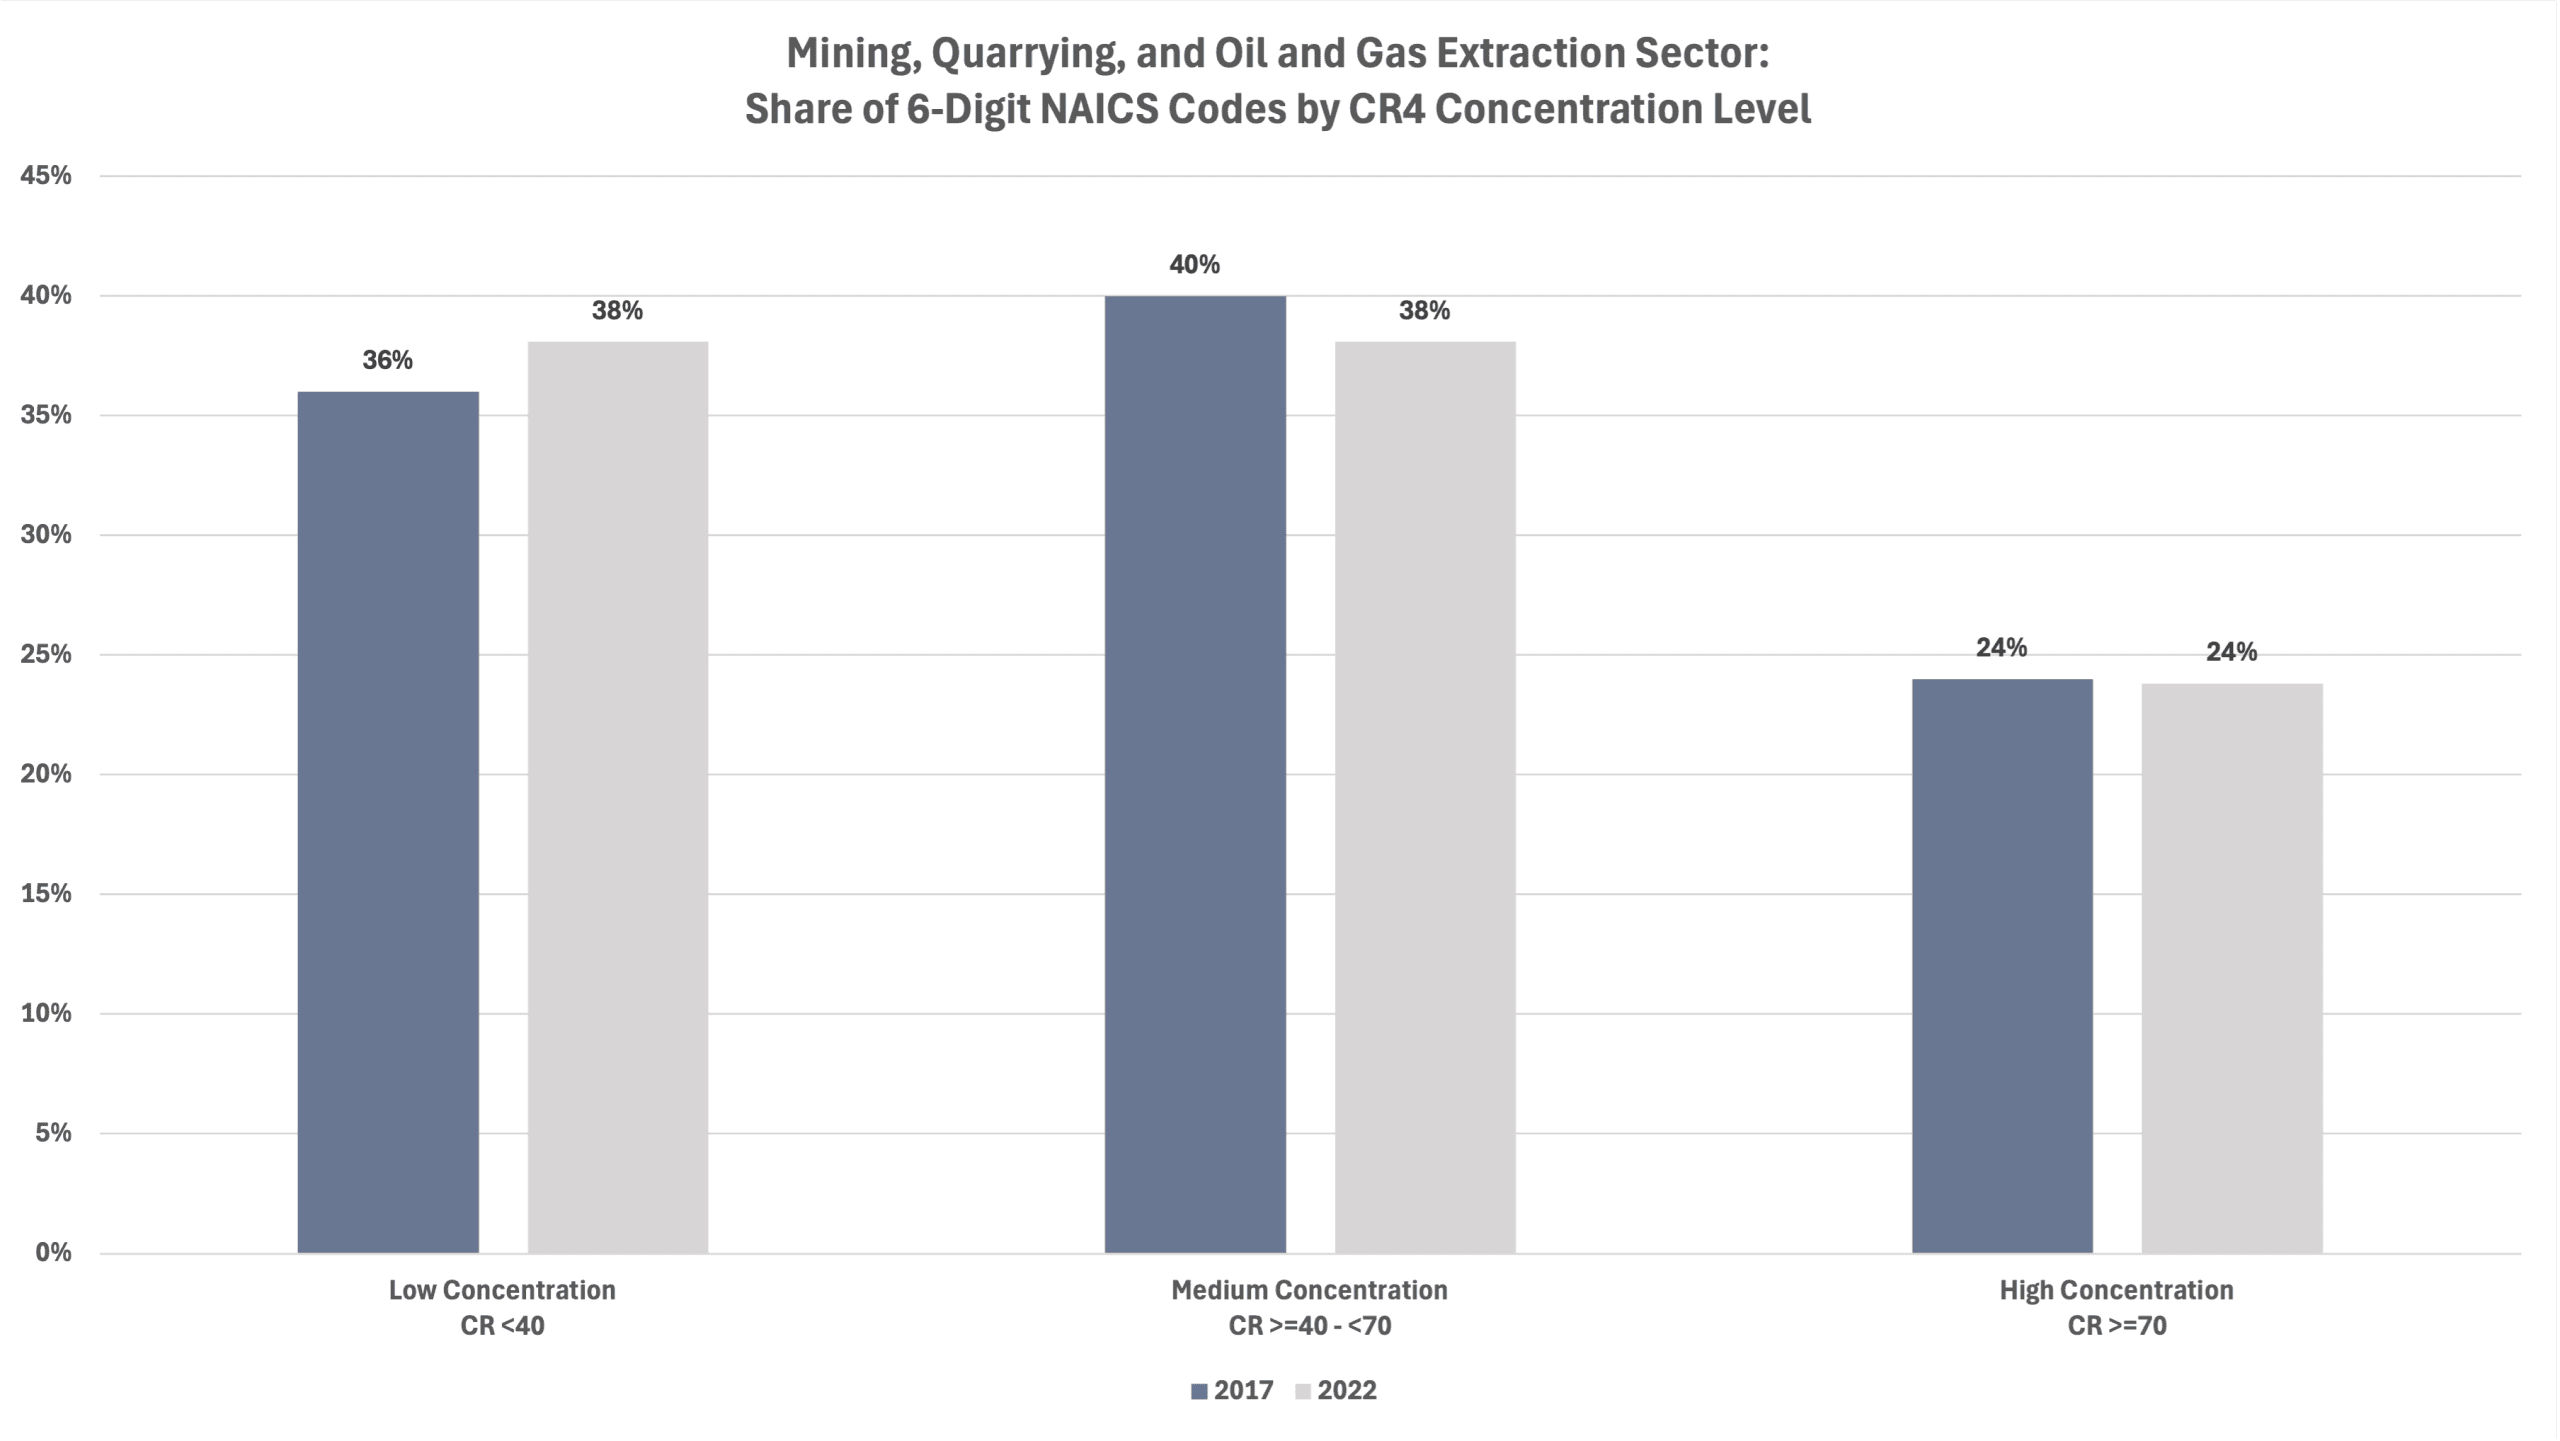
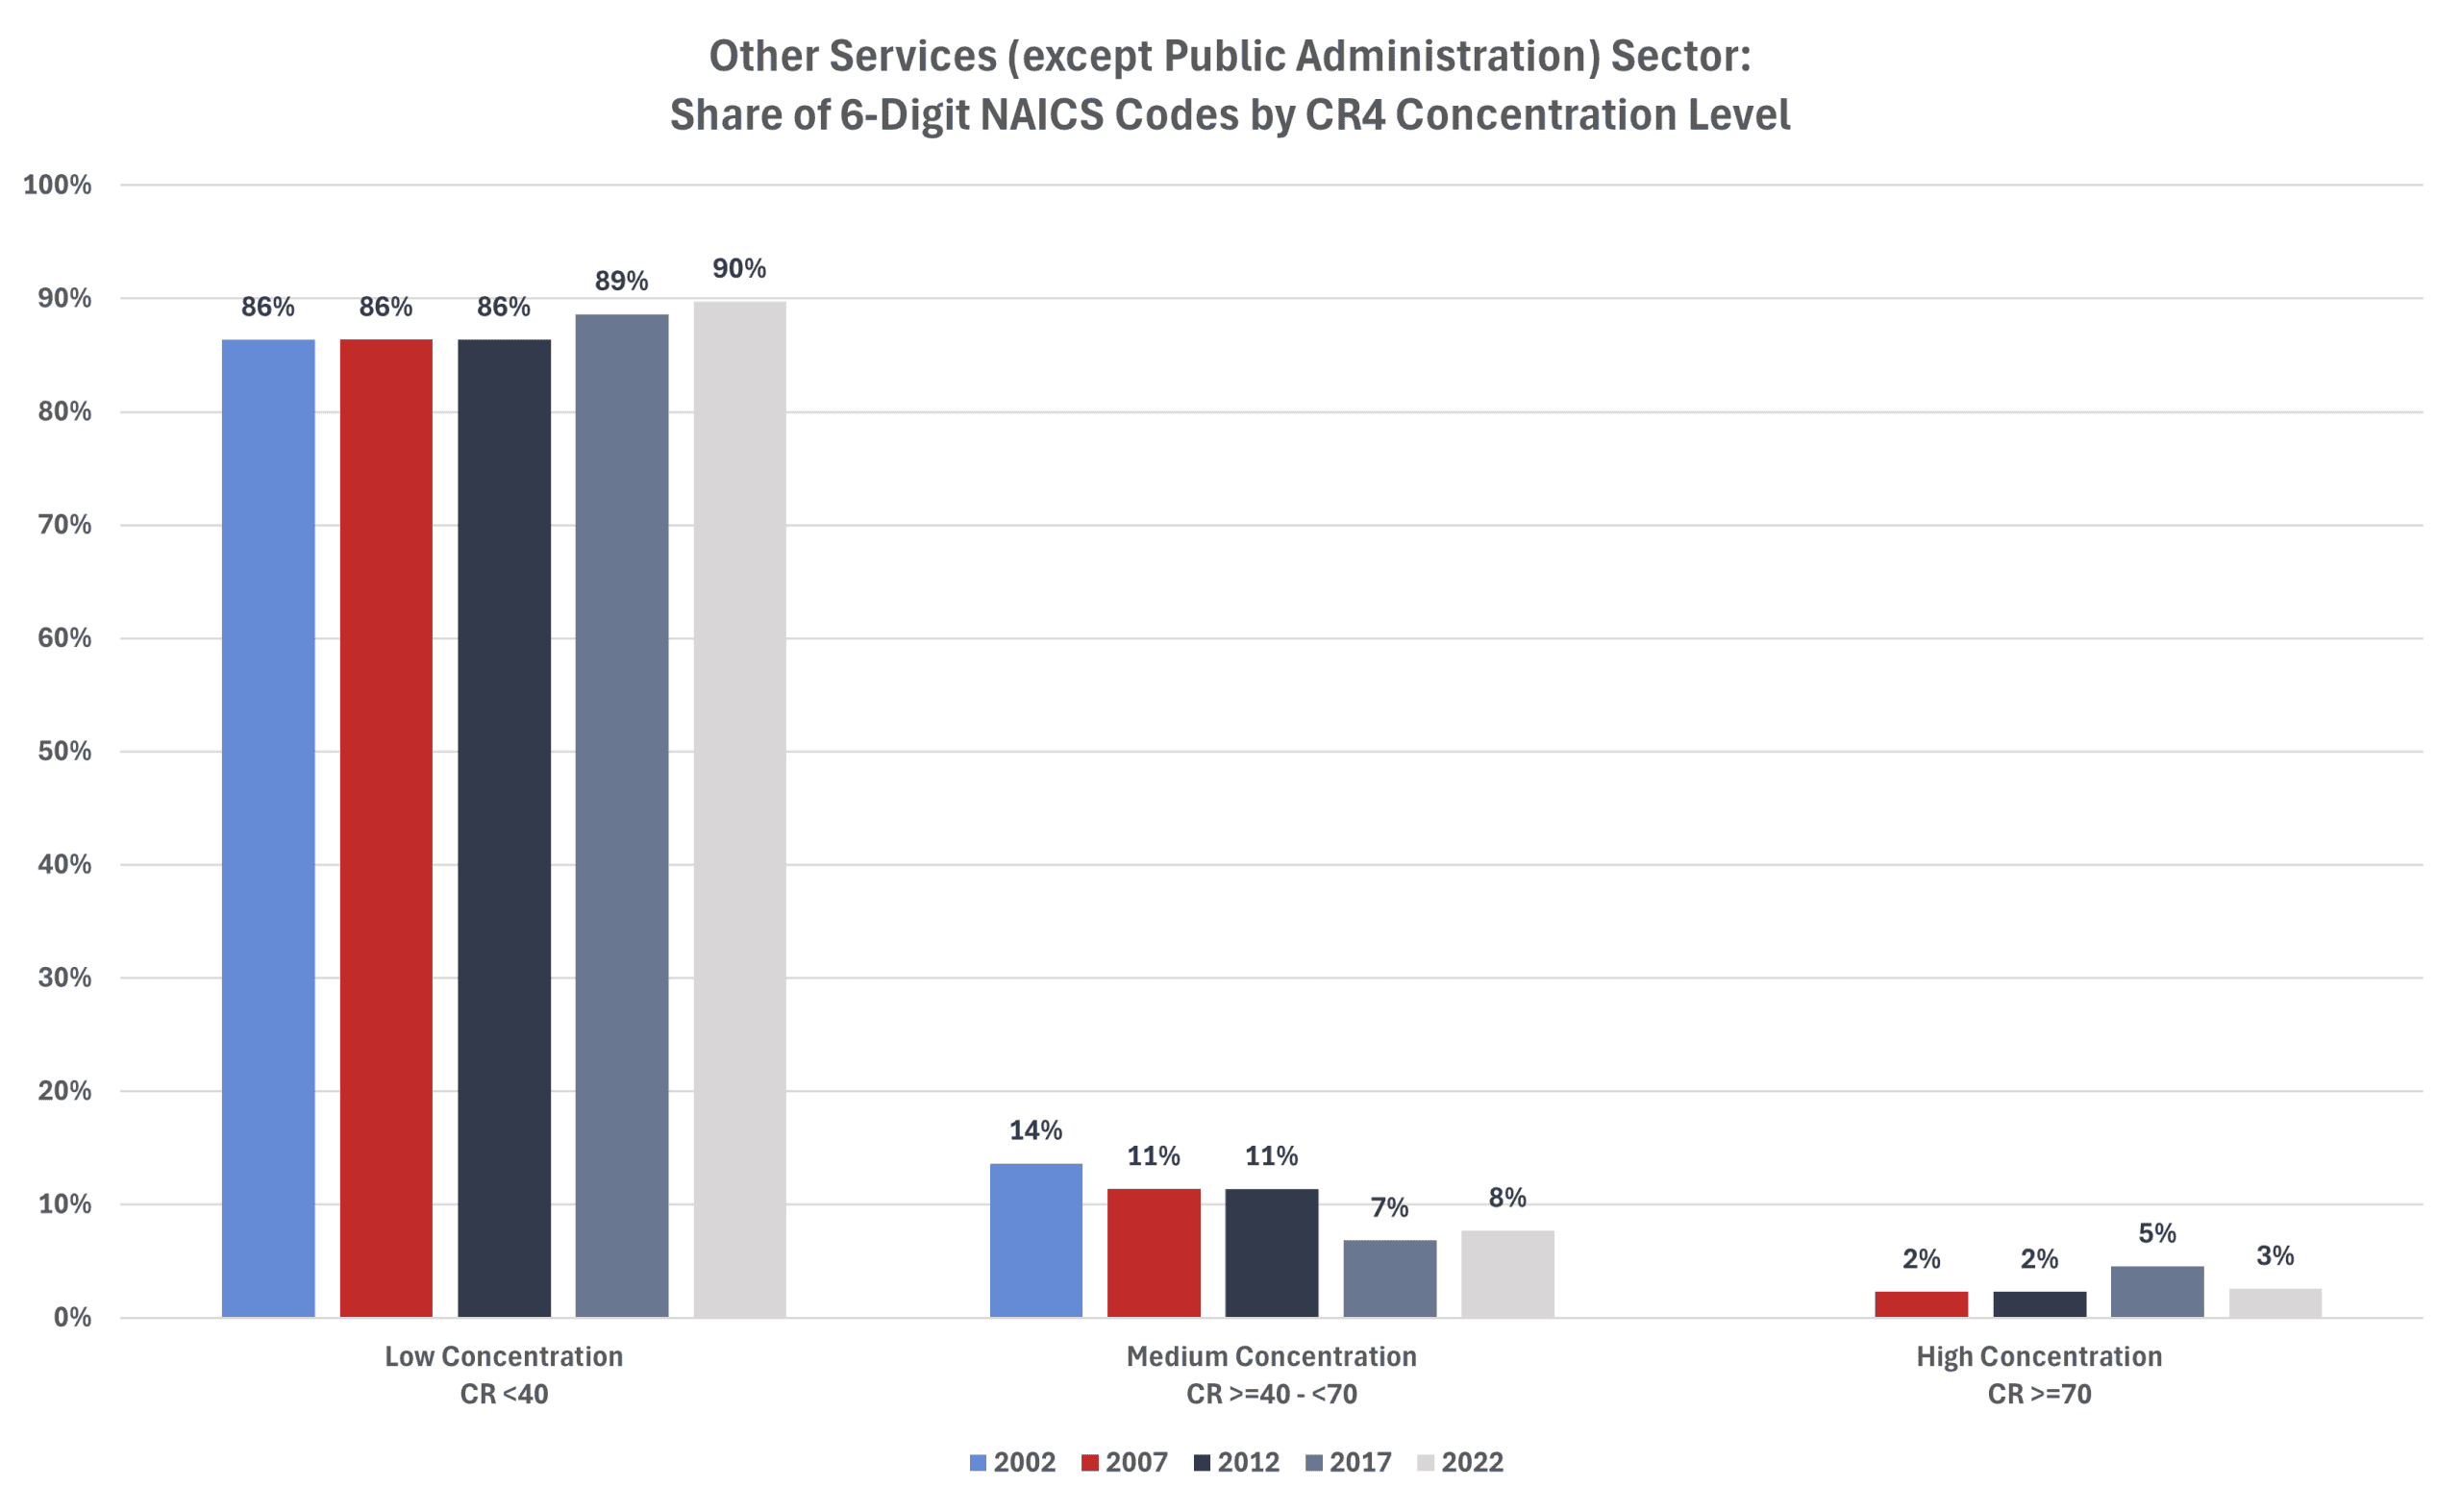
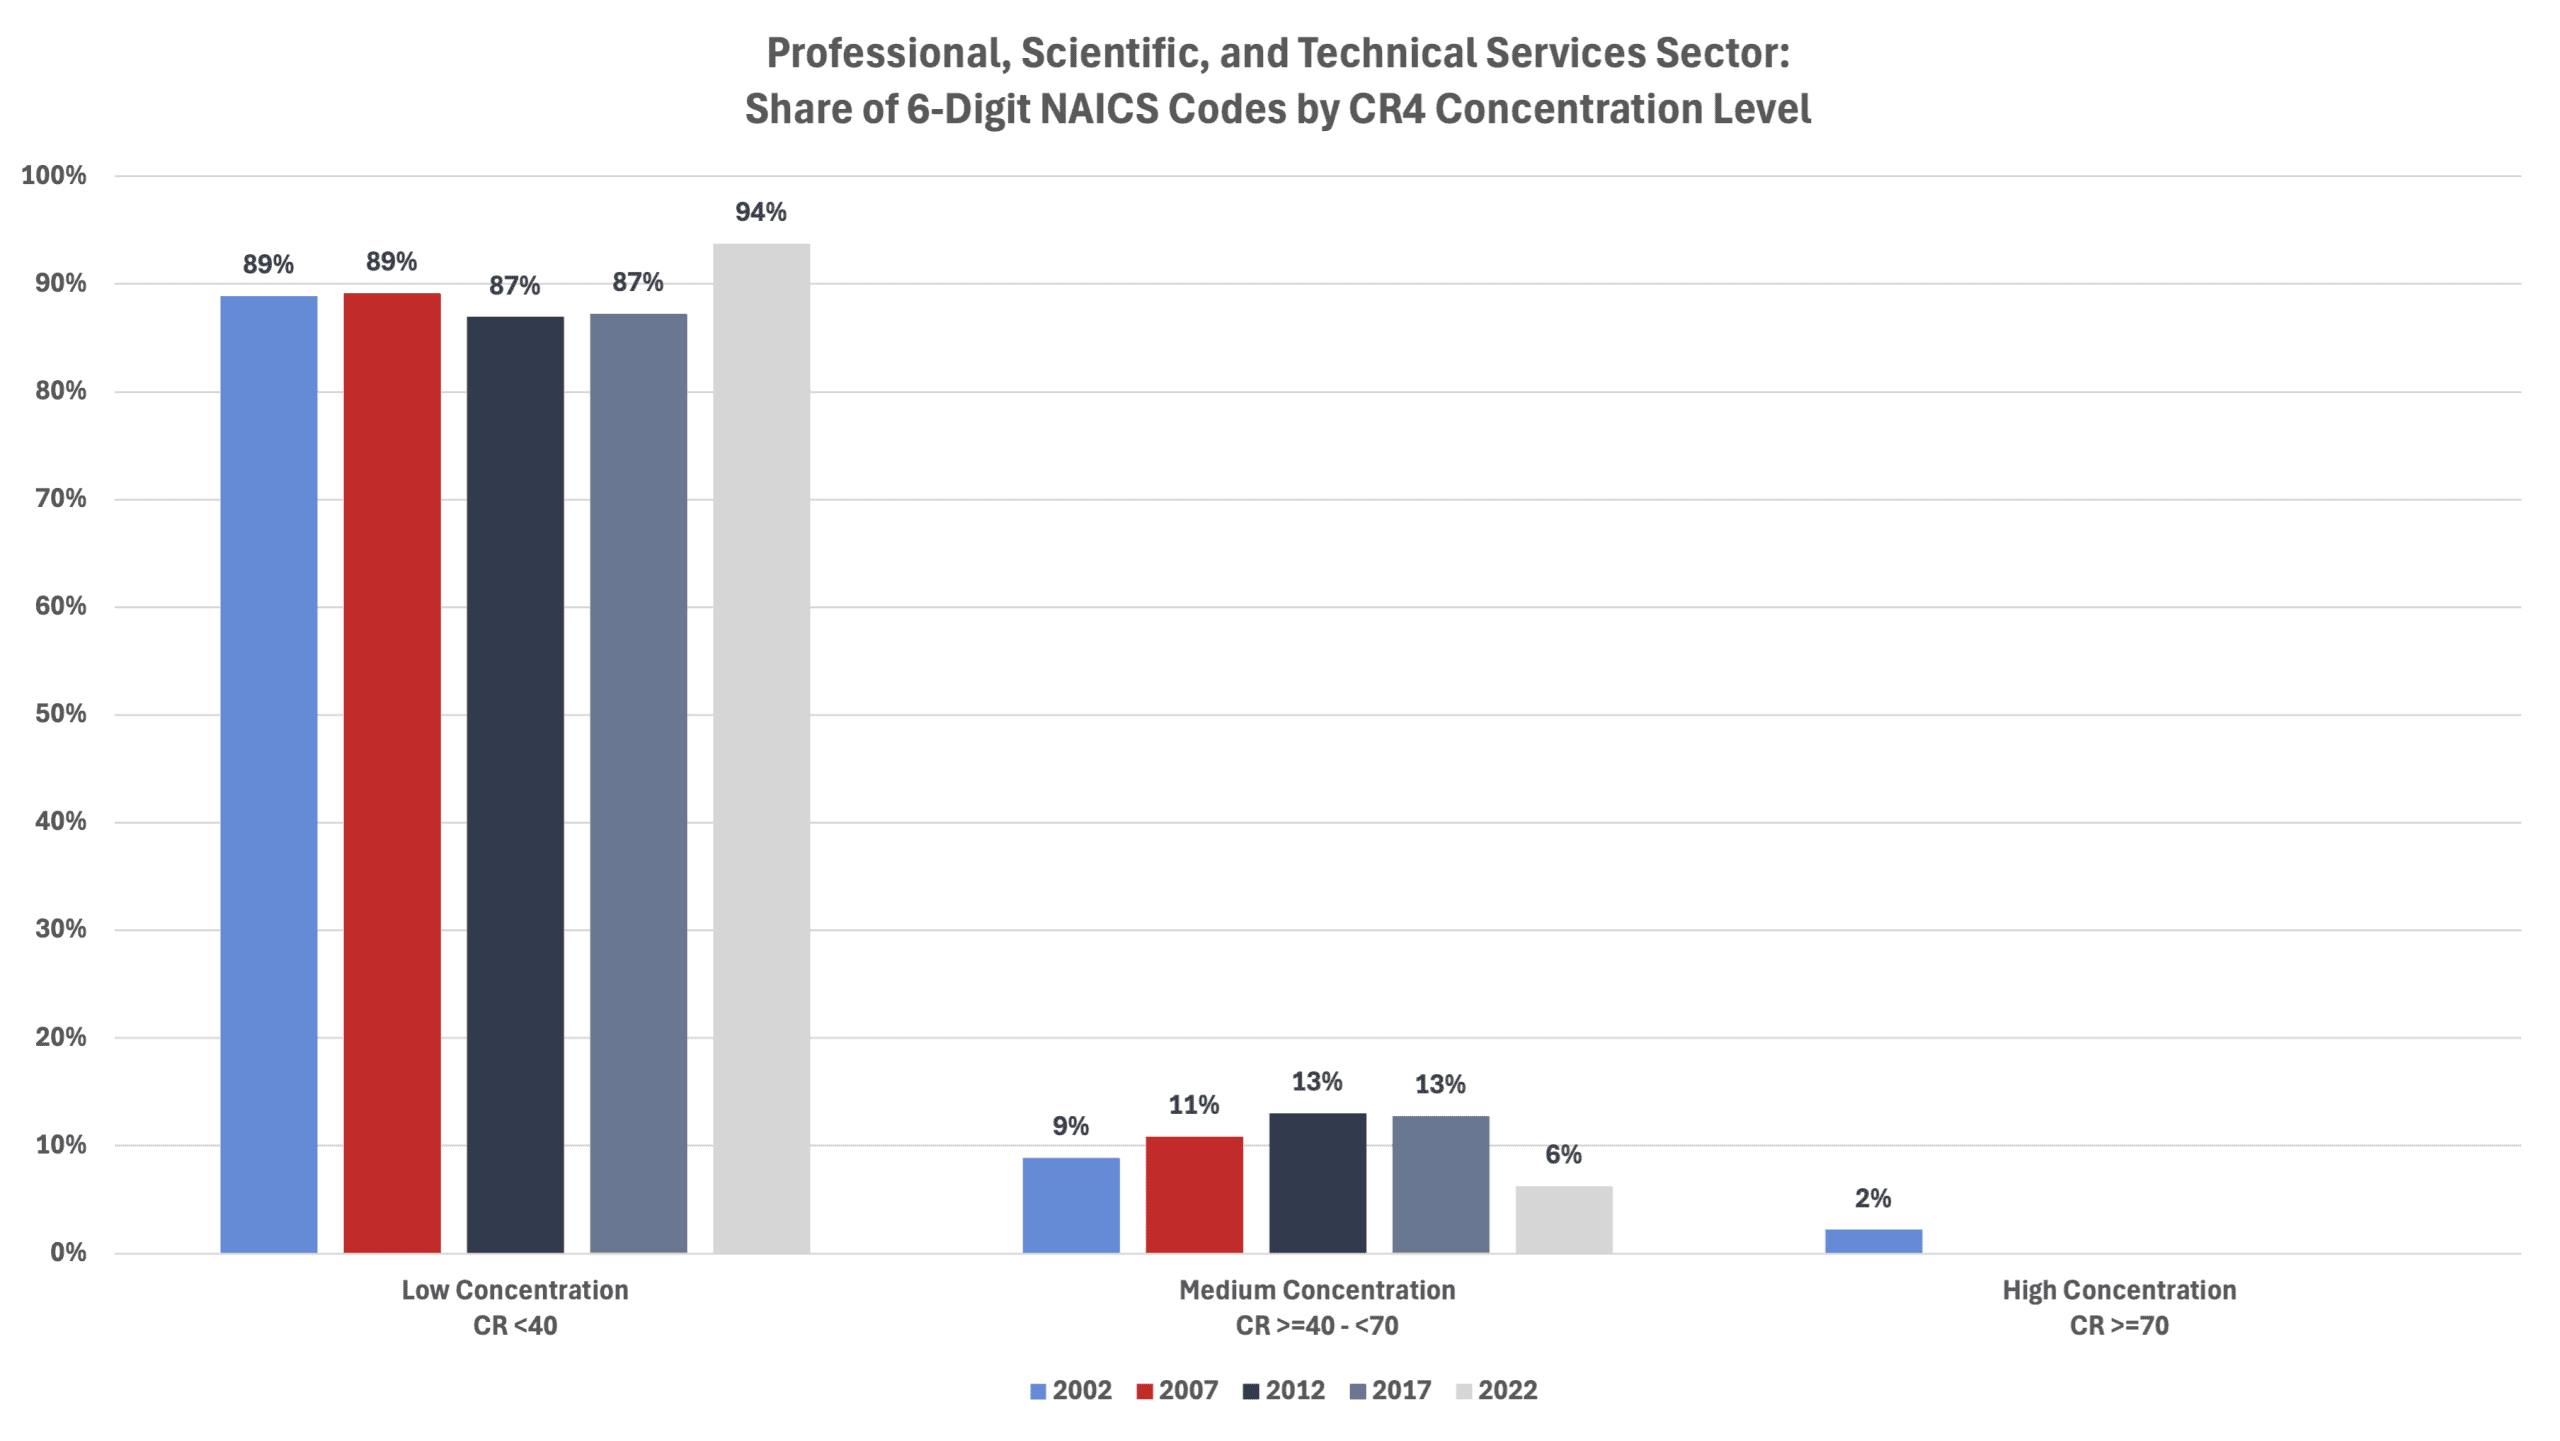
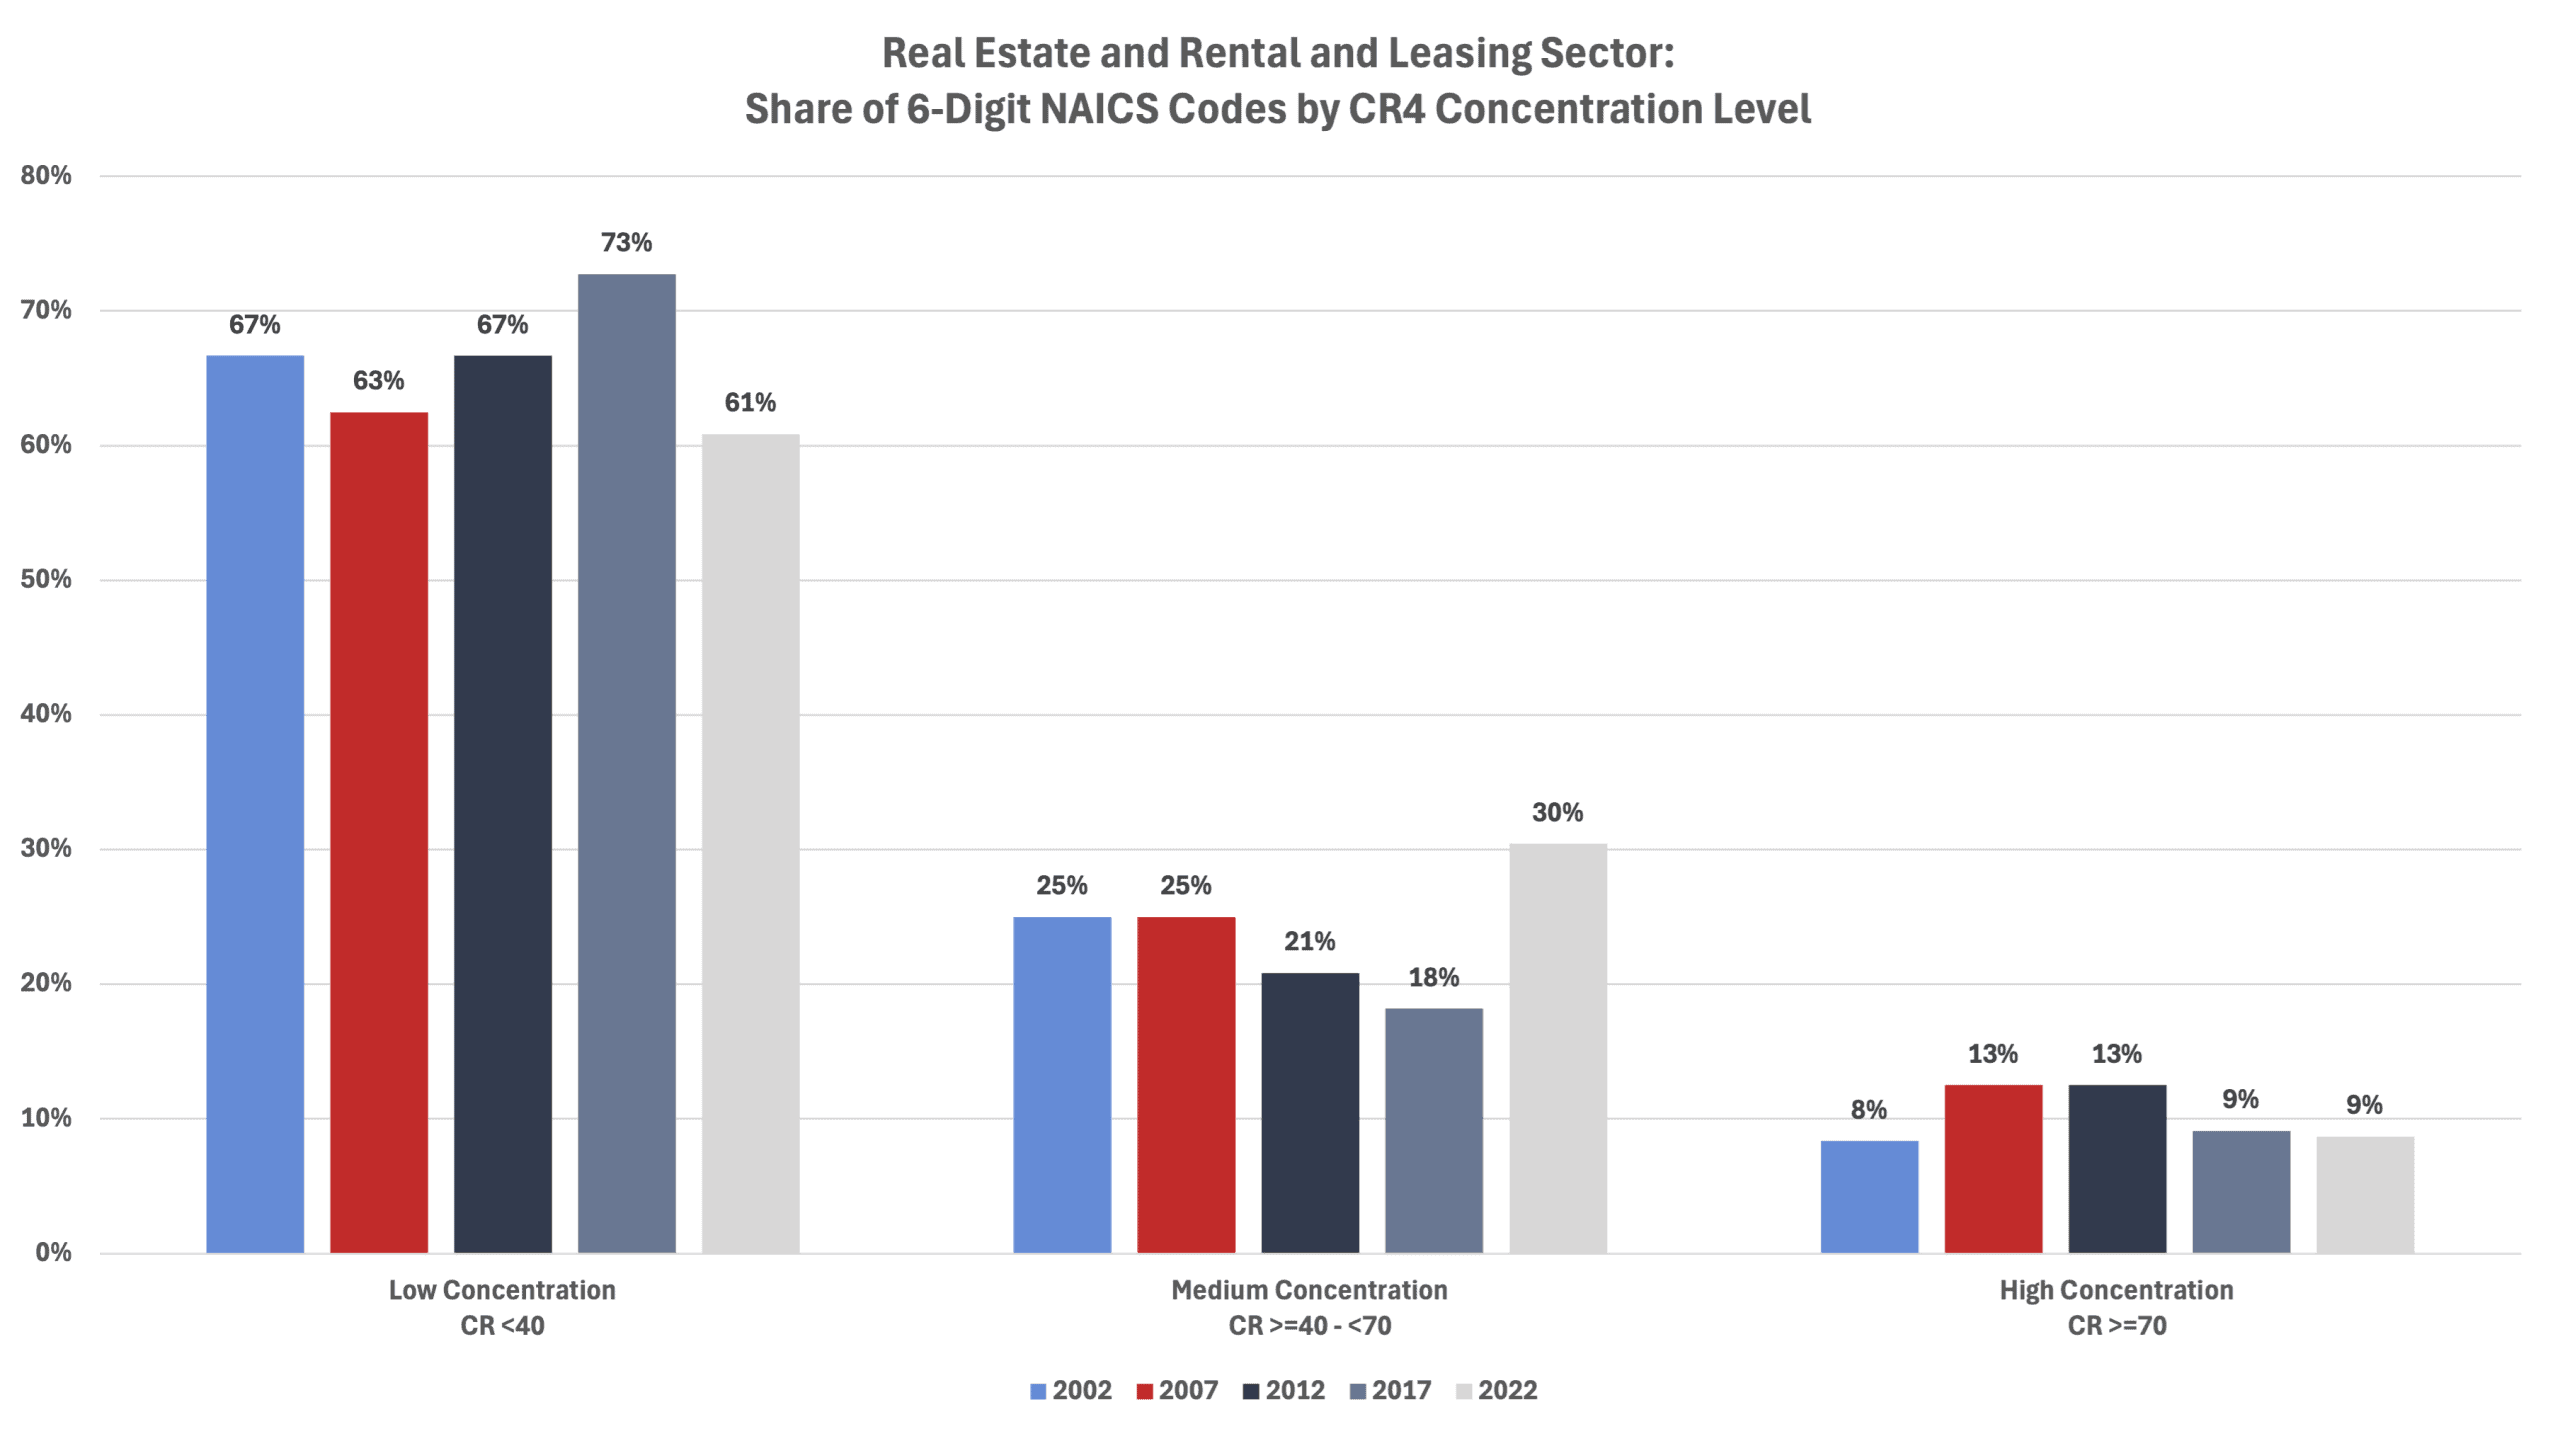
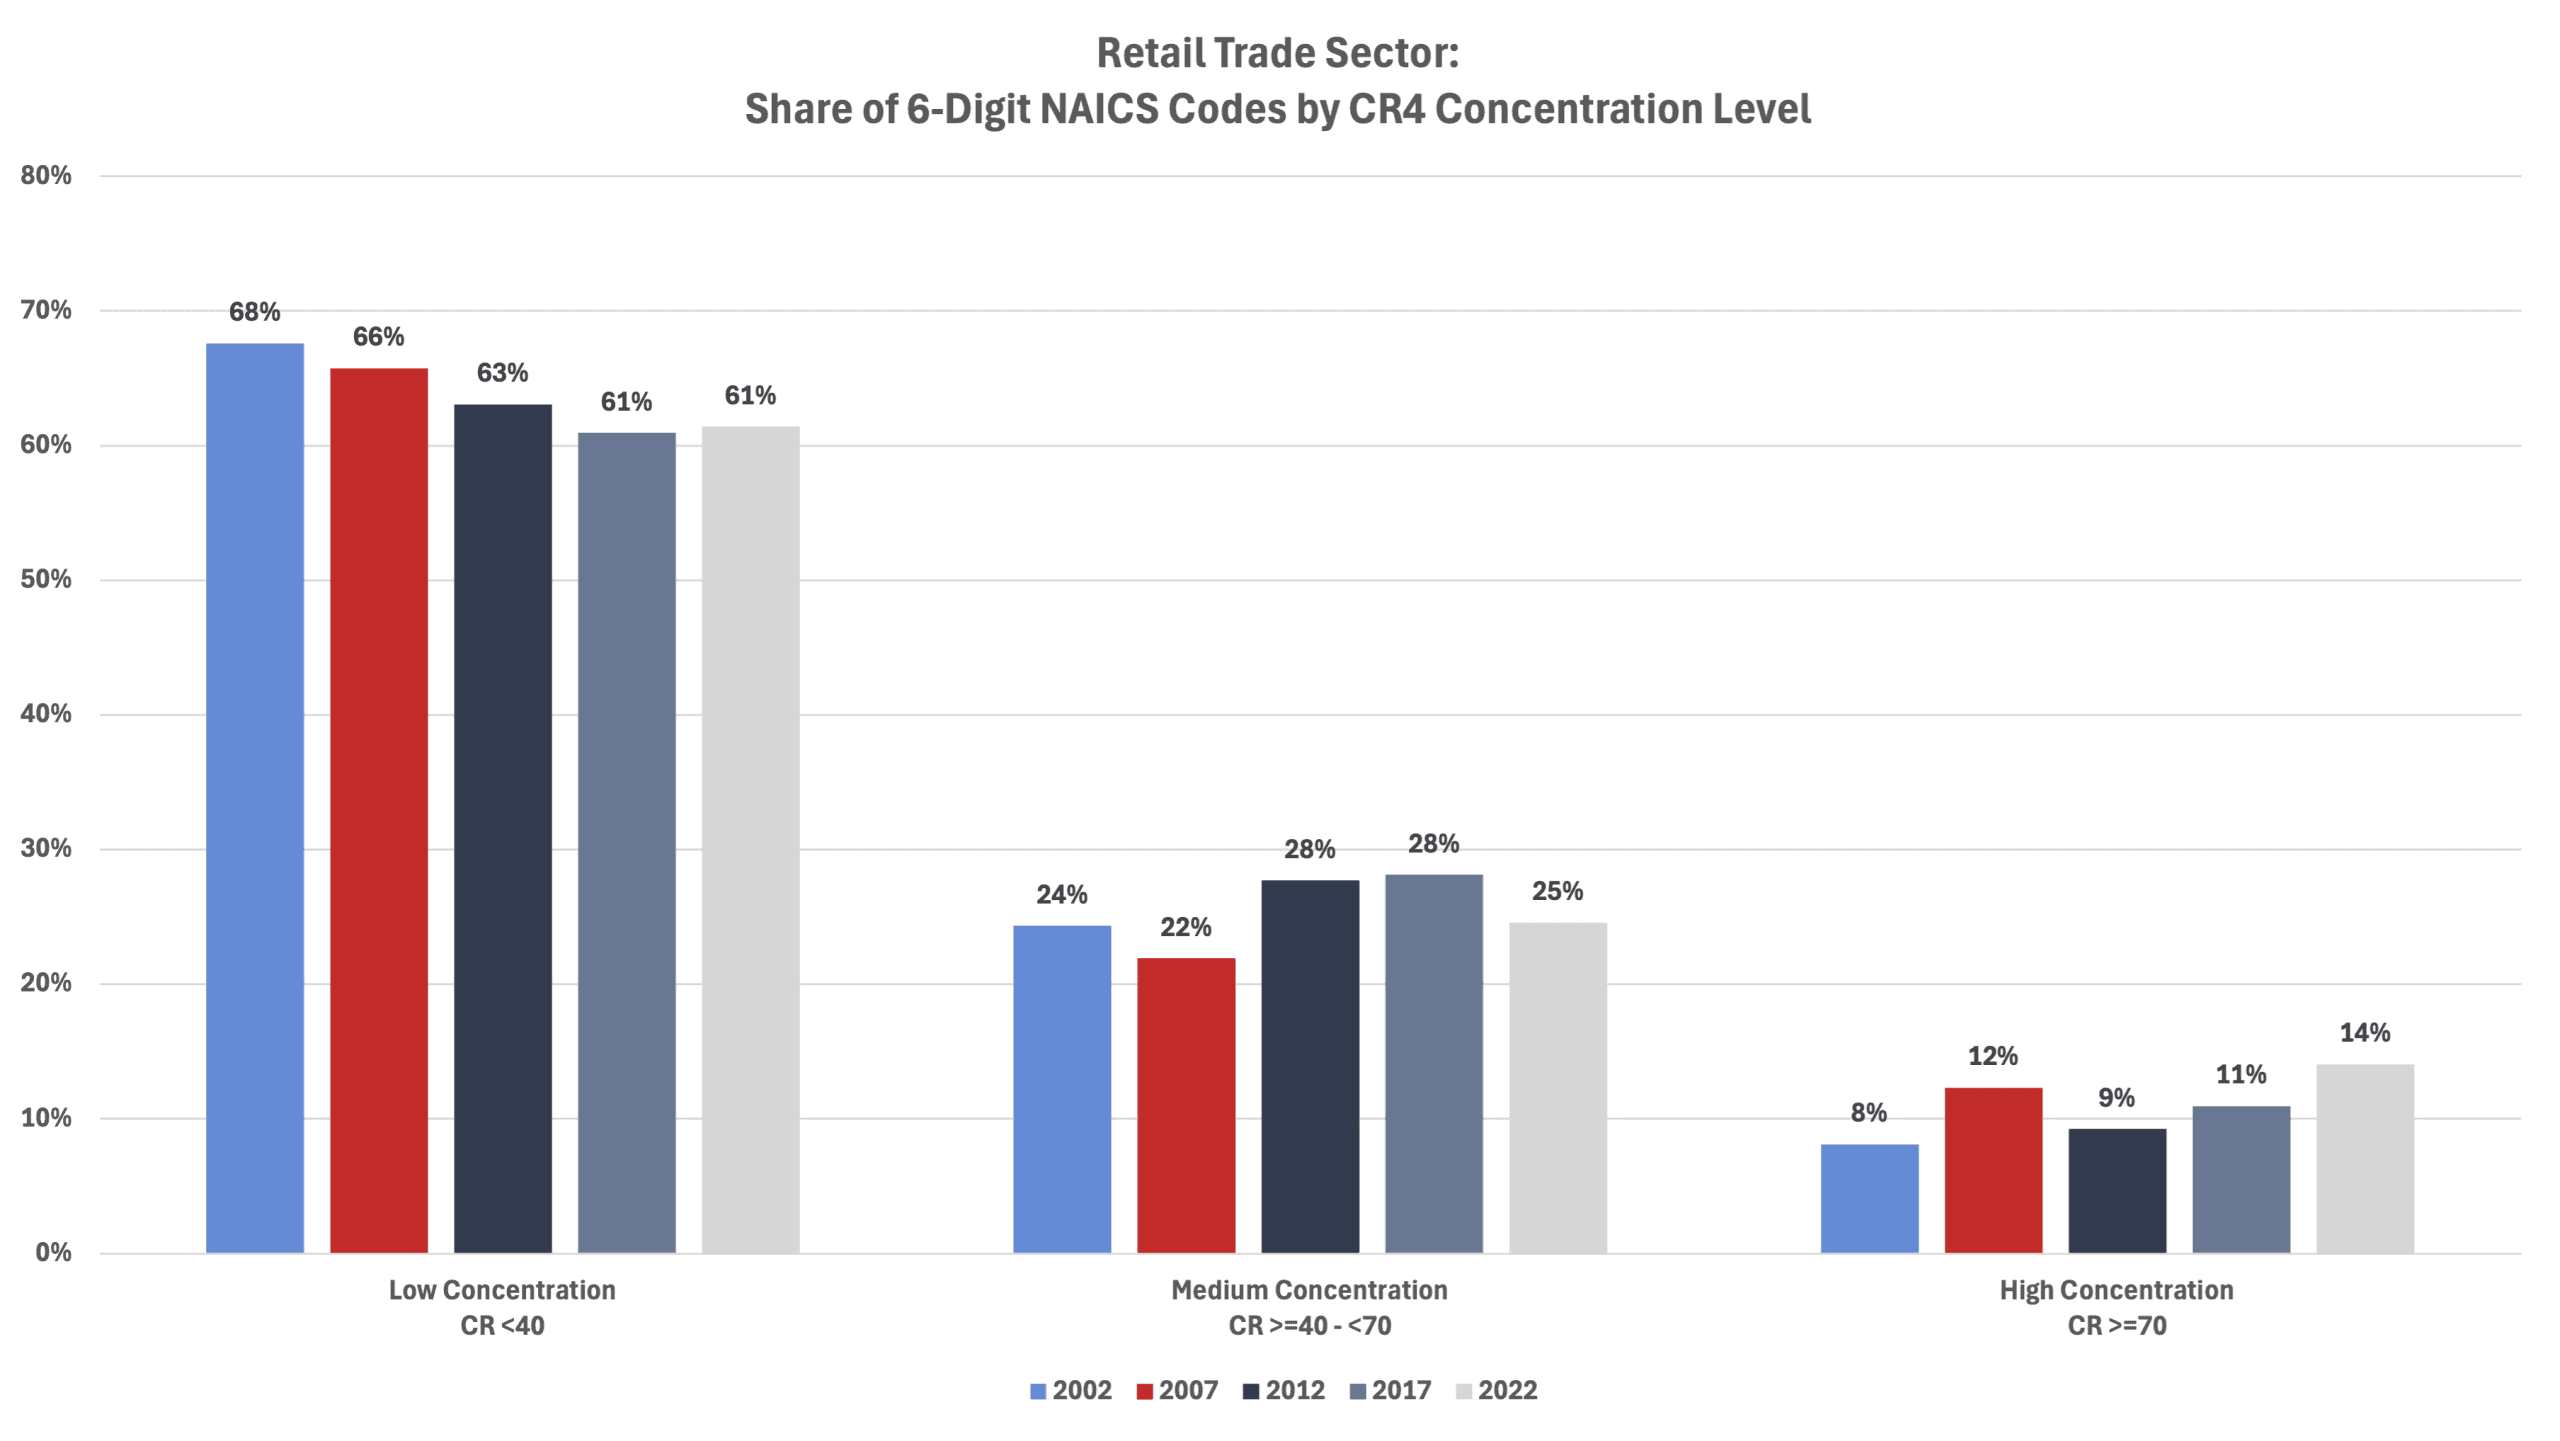
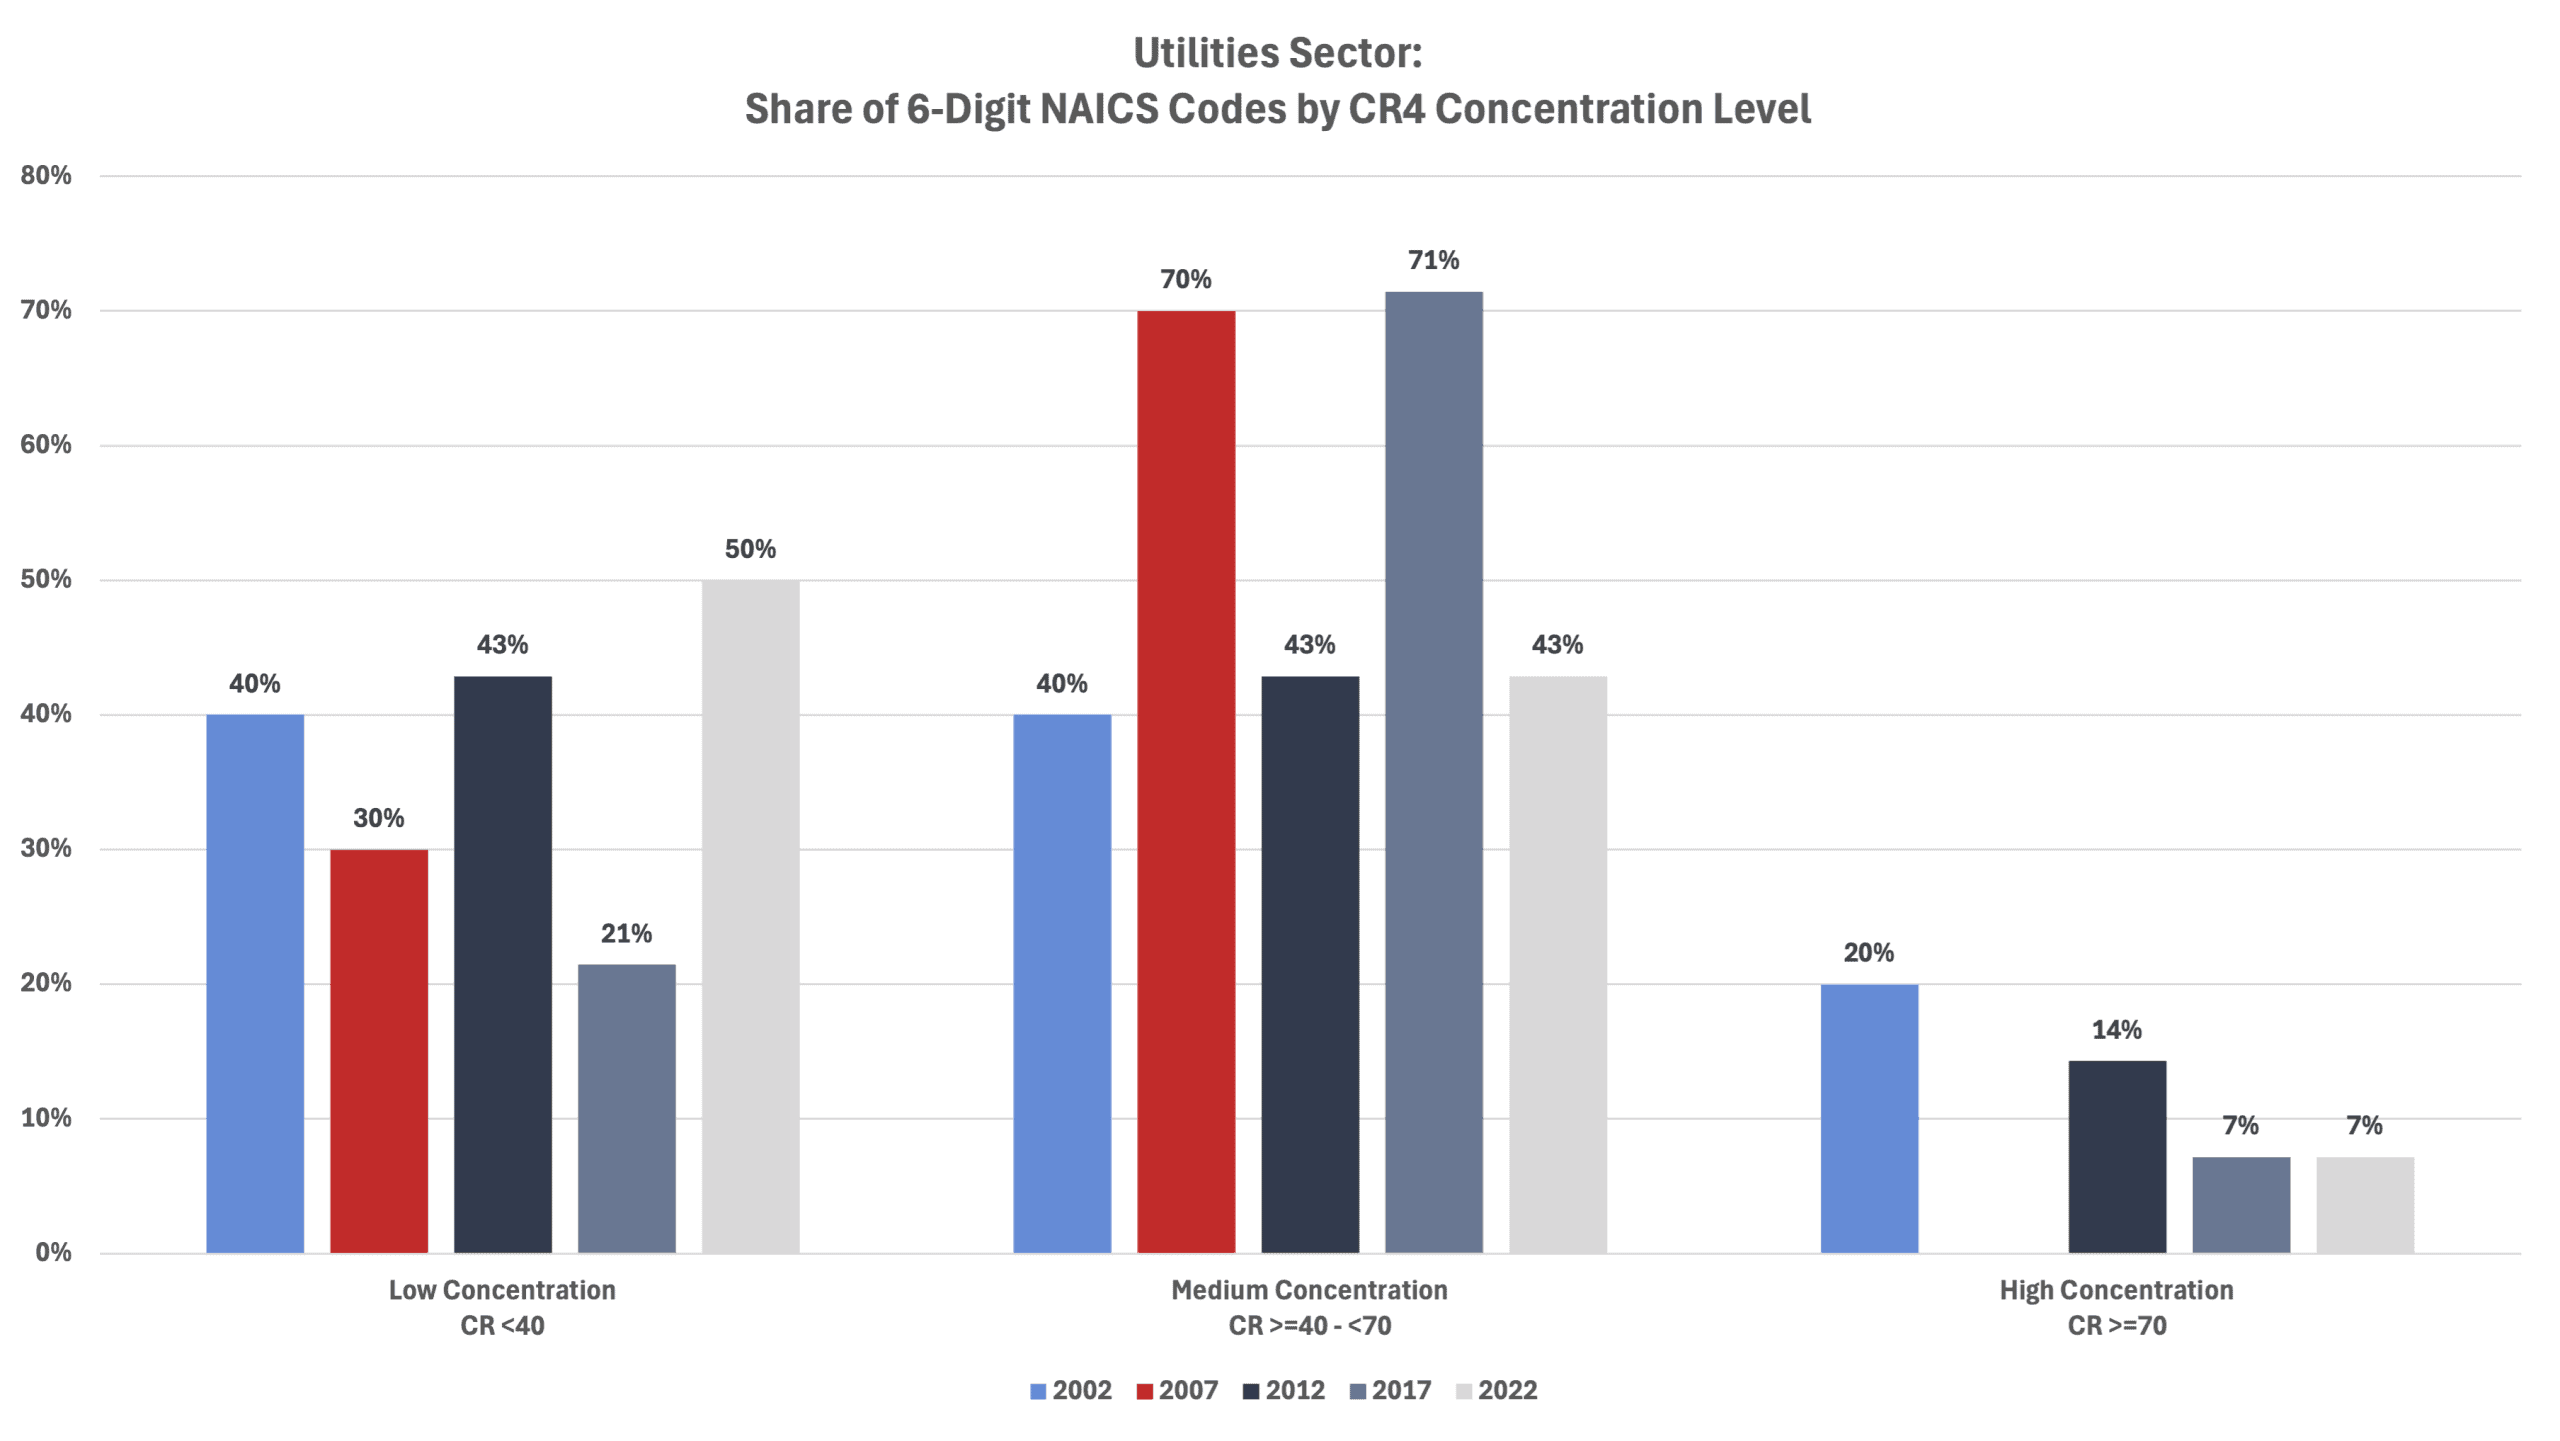
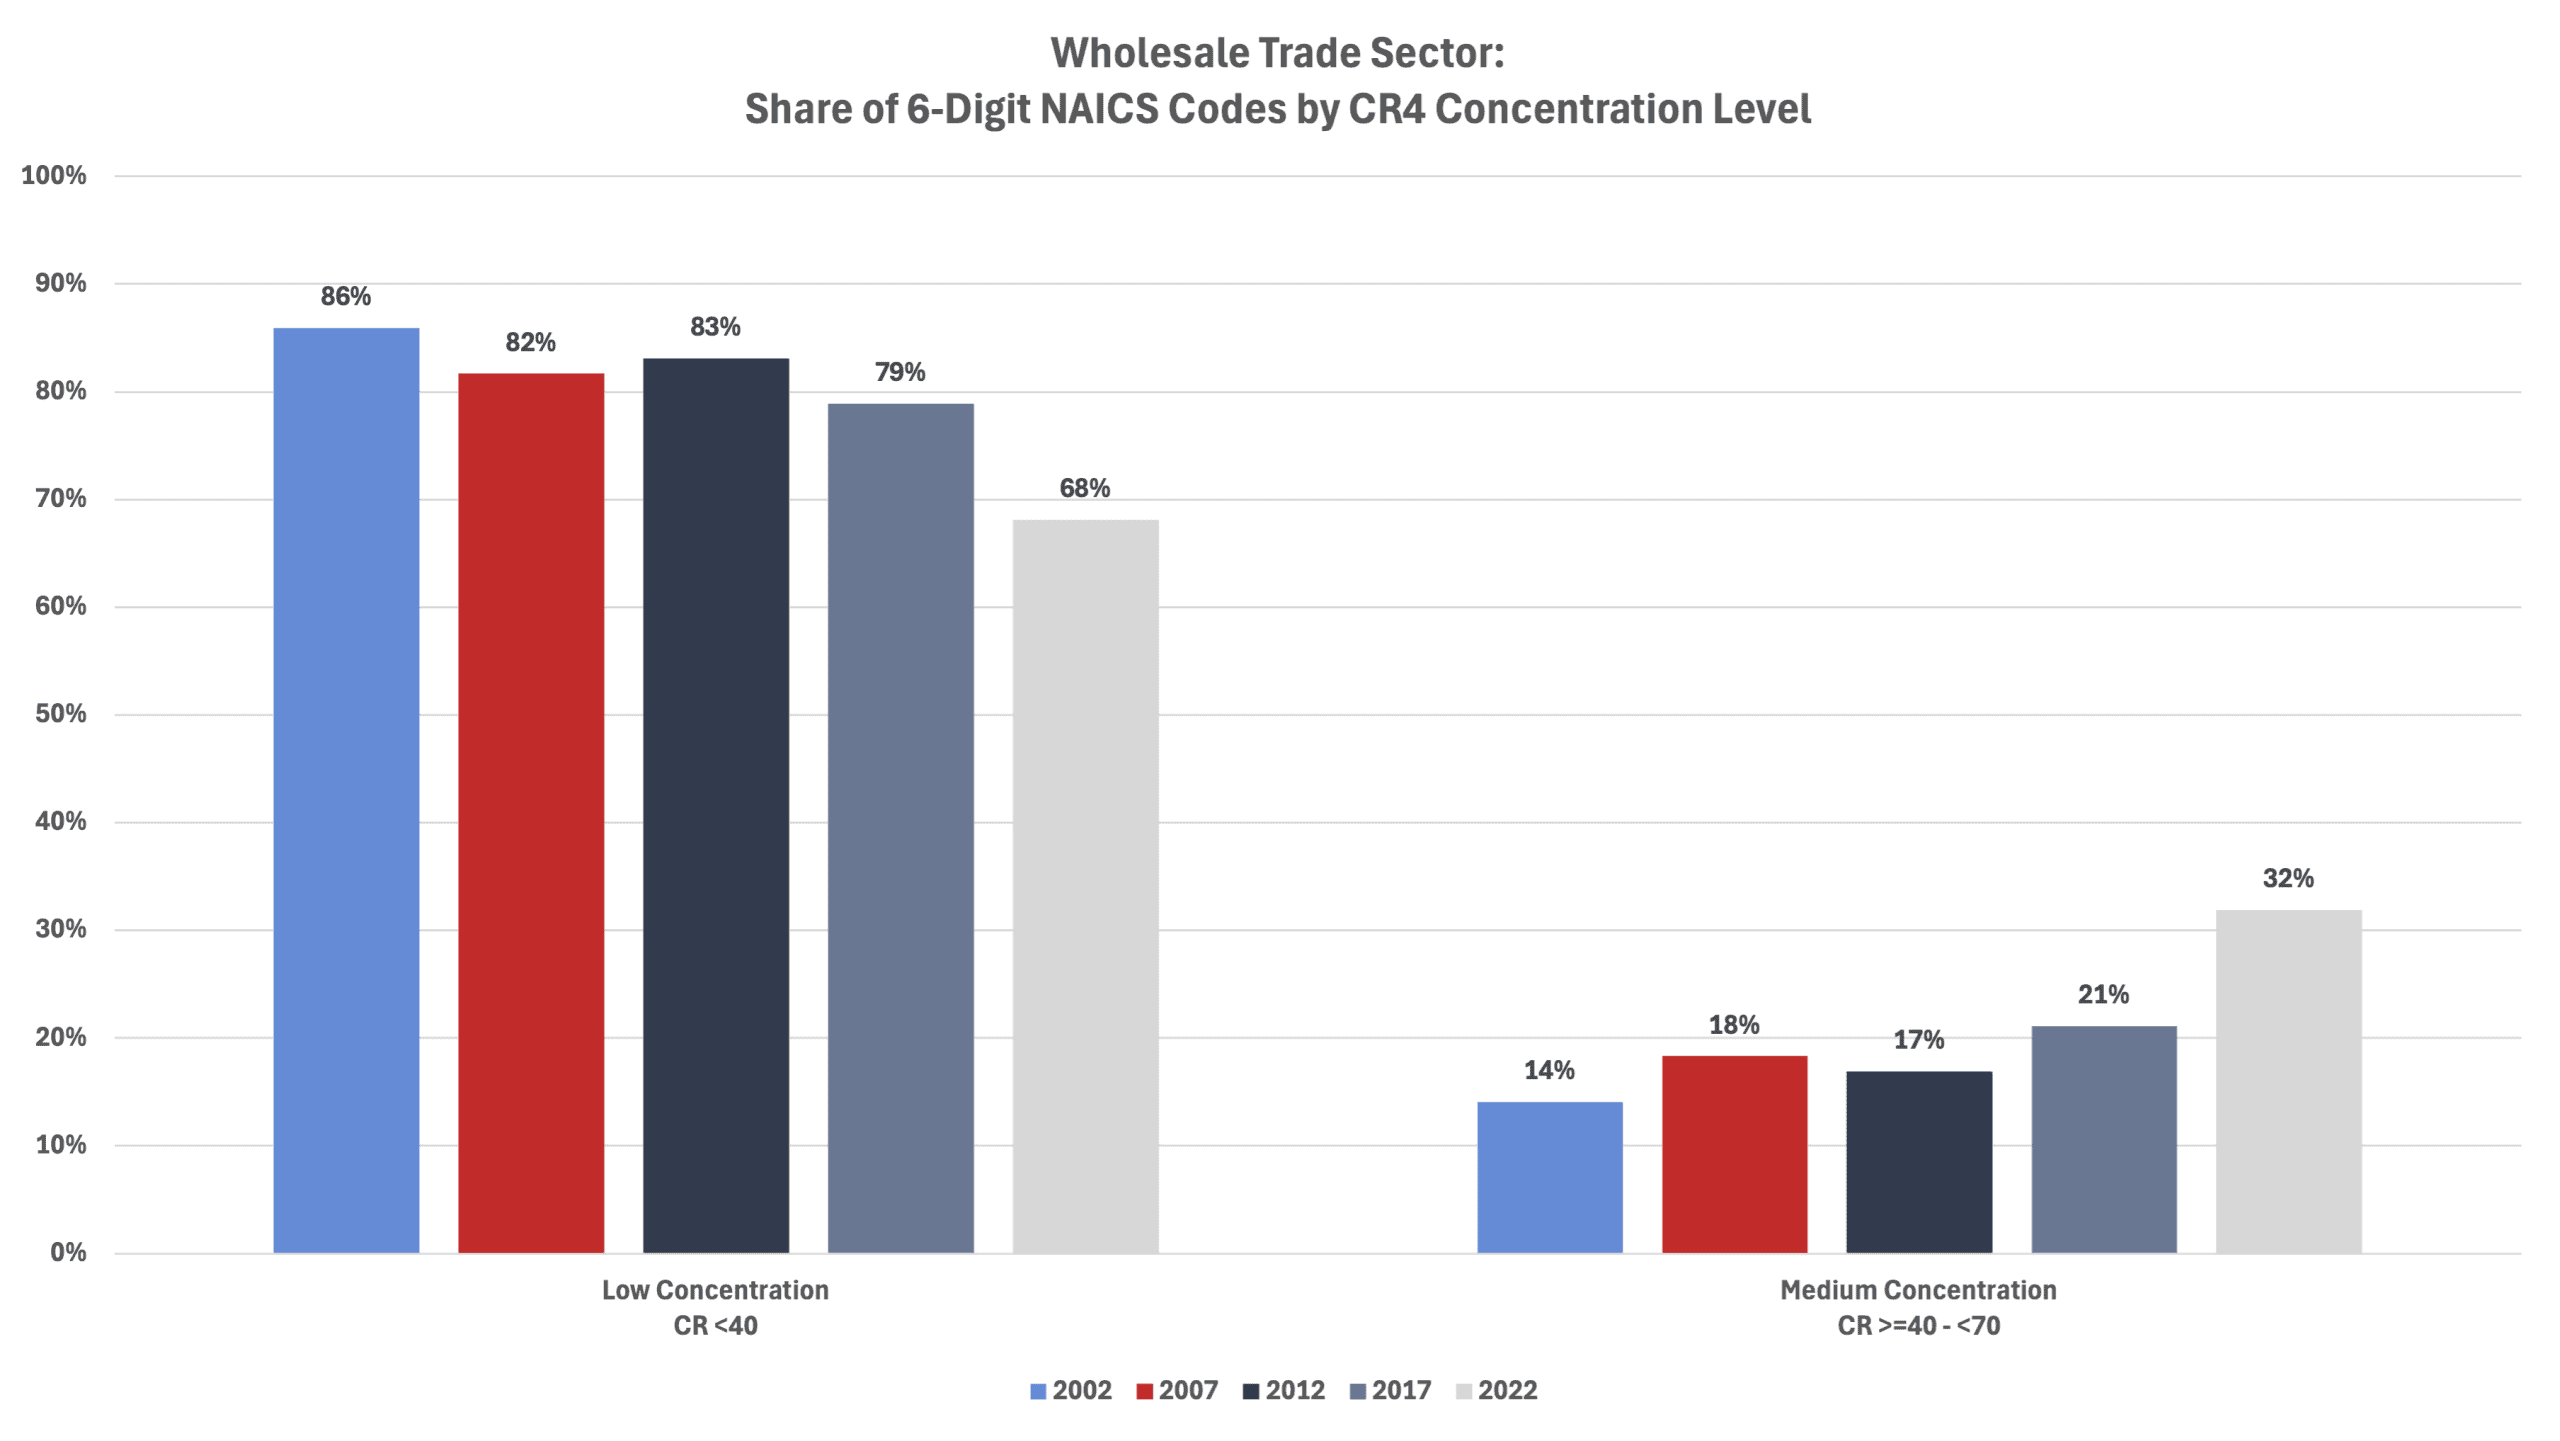
Market Concentration Levels by Sector
Is it possible that the use of broad averages across detailed industries masks increased concentration? To check this, this study shows that an analysis of each industry over time also fails to support the theory that markets have become more concentrated. The series of graphs below show the share of 6-digit NAICS code by concentration level for each overall industry (e.g., Information sector). The share of low, medium, and high levels of concentration remained relatively consistent over the 20-year span.


![]()
The table below shows the rank correlation coefficient between time periods. The calculation uses the subset of the data with six-digit NAICS industry groups and observations in both time periods. Each five-year gap had a rank correlation coefficient between 0.94 and 0.95, meaning there was little movement in the rank of a CR4 concentration level for an individual six-digit NAICS code. In other words, an industry that was more concentrated in one year tended to remain more concentrated in the following year. The ranked correlation coefficient between 2002 and 2022 dropped to 0.84, suggesting that this relationship is not as strong across a wider period.
![]()
Conclusion
There is a lack of evidence to support the claim that industries are becoming more concentrated and, if left unchecked, the largest firms will exert some level of monopolist power. Indeed, the data from the Economic Census show that average concentration ratios have remained largely unchanged over the past 20 years and the share of highly concentrated firms remained muted.
While the definition of a “market” is undoubtedly fluid and unlikely to be captured perfectly by the NAICS definitions, these data show that competitive markets (low concentration) are the predominant landscape for most industries.
Appendix: Information About Data from Economic Census
The Economic Census, published every five years by the U.S. Census Bureau, provides a comprehensive set of statistics to help understand the economy. Included in this publication are data measuring the share of industry sales for the four, eight, 20, and 50 largest firms in each industry. These shares are known as concentration ratios (denoted as CR4, CR8, CR20, and CR50).
The industries are categorized using the North American Industry Classification System (NAICS). NAICS groups businesses by their primary activity, aggregates them into various levels of detail, and assigns a numeric code. A 2-digit NAICS code is general sector (e.g., 22 – Utilities) while a 6-digit code is specific to an industry (e.g., 221115 – Wind Electric Power Generation). Data prior to 2002 used a different industry classification method (Standard Industrial Classification) making historical comparisons difficult.
While this set of data seems ideal for analyzing market concentration across industries, there are shortfalls that need to be considered.
CR data from the Economic Census are measured at the national level to ensure information about individual businesses is kept private. It is easy to imagine, however, that geographical information regarding sales would be useful in a market concentration analysis. For example, at a national level, health care and social assistance services have low market concentration using the CR4 methodology at the 6-digit NAICS level. But a rural area with just one hospital has a very concentrated market. Any sort of anticompetitive behavior by this hospital would almost certainly lead to lower levels of consumer welfare.
Another point to keep in mind is that the Economic Census measures domestic sales. Imports are excluded. While a concentration ratio may appear high, imports could be the main source of competition for a particular industry but are not considered when calculating concentration ratios.
To state these shortfalls plainly, these concentration ratios are not meant to represent antitrust markets. Antitrust markets identify relevant geographies and products where the competition takes place.
An additional shortfall of the data set is that NAICS codes are updated every five years. While some industry classifications have remained consistent, others (most notably in the manufacturing sector) have changed. These changes to the NAICS codes could be in the form of a consolidation of multiple industry codes into one code, part(s) of a NAICS code redistributed into another NAICS code(s), or in some cases, a combination of the two. This makes tracking individual 6-digit NAICS codes across time difficult. A good example of a change made to NAICS codes is in the Utility Sector between 2007 and 2012. In 2012, the 2007 6-digit NAICS code 221119 – “Other Electric Power Generation” was separated into five different NAICS codes to capture solar, wind, geothermal, biomass, and other electric power generation individually.
The analysis above uses the concentration level of the four largest firms at the 6-digit NAICS level and does not attempt to regroup NAICS codes to be consistent across time.
Choosing to analyze the four largest firms rather than eight, 20, or 50 helps better answer the question of whether there is oligopoly or even monopoly power in a specific industry. Widening the net makes answering that question more difficult.
The use of 6-digit NAICS codes provides the best, most specific measure of an industry. Trying to analyze market share using a less specific 4-digit NAICS code runs the risk of grouping firms serving different end markets. To use the utilities sector as an example, NAICS code 2211 – “Electric Power Generation, Transmission, and Distribution” is a very broad category. NAICS code 22115 – “Wind Electric Power Generation” and 221121 – “Electric Bulk Power Transmission and Control,” while related and falling under the same 4-digit NAICS code, serve different markets.
Notes on the changes made to the 2022 Economic Census can be found here. Changes to NAICS codes can be found here.
This is an update to previous AAF research that can be found here.