Research
May 26, 2022
Are Monopolies Really a Growing Feature of the U.S. Economy?
Executive Summary
- The Biden Administration has signaled that it is taking a tougher approach to antitrust law and regulations[1] via the president’s Executive Order on “Promoting Competition in the American Economy”[2] and his appointment of Lina Khan as chair of the Federal Trade Commission.
- Yet newly released data from the 2017 Economic Census shows almost no evidence that oligopolies and monopolies are the predominant market structure in the U.S. economy; most industries operate in a low-concentration, highly competitive environment.
- Based on the report’s data, this study finds that the distribution of industries with low, medium, and high levels of concentration remained largely stable between 2002 and 2017.
- Using the data, the study also finds that the aggregated average concentration ratio – the share of sales by the four largest firms – across all industries increased just 0.2 percentage points from 2002 to 2012; between 2012 and 2017, that ratio remained unchanged.
- Two recent studies from NERA Economic Consulting in partnership with the U.S. Chamber of Commerce[3] and the Information Technology & Innovation Foundation[4] draw the similar conclusion that markets have not become more concentrated.
Introduction
It has become commonplace for policy wonks, politicians, and even heads of antitrust enforcement agencies to sound the alarm over the notion that the level of market concentration is on the rise and that increased market power among a few large firms poses a threat to consumers and smaller competitors. Consequently, the call for expanded antitrust enforcement and even a rewrite of the merger guideline rules has grown louder. As CNBC reported, the Federal Trade Commission and the Department of Justice Antitrust Division announced that they are “seeking public comment on how to ‘modernize enforcement of the antitrust laws regarding mergers.’” The article also notes that the nation’s two federal antitrust enforcers said they are “particularly interested in learning about where the earlier guidelines ‘may underemphasize or neglect’ important aspects of competition. [The agencies] list labor market effects and elements of competition that aren’t tied to prices, like innovation and quality, as examples of such aspects.”[5]
Have markets really become more concentrated? Based on newly released data from the U.S. Census Bureau’s 2017 Economic Census[6] (published in December 2021), this study finds that, in fact, the distribution of industries with low, medium, and high levels of concentration remained largely unchanged between 2002 and 2017, with most industries operating in a low-concentration environment.
Market Concentration Levels
To measure concentration, this study focuses on the share of sales by the largest four firms (CR4) in an industry and identifies industries using the North American Industry Classification System (NAICS). There are degrees of specificity ranging from a 2-digit NAICS code (a general sector, e.g., 22 – Utilities) to a 6-digit code (a specific industry, e.g., 221115 – Wind Electric Power Generation).
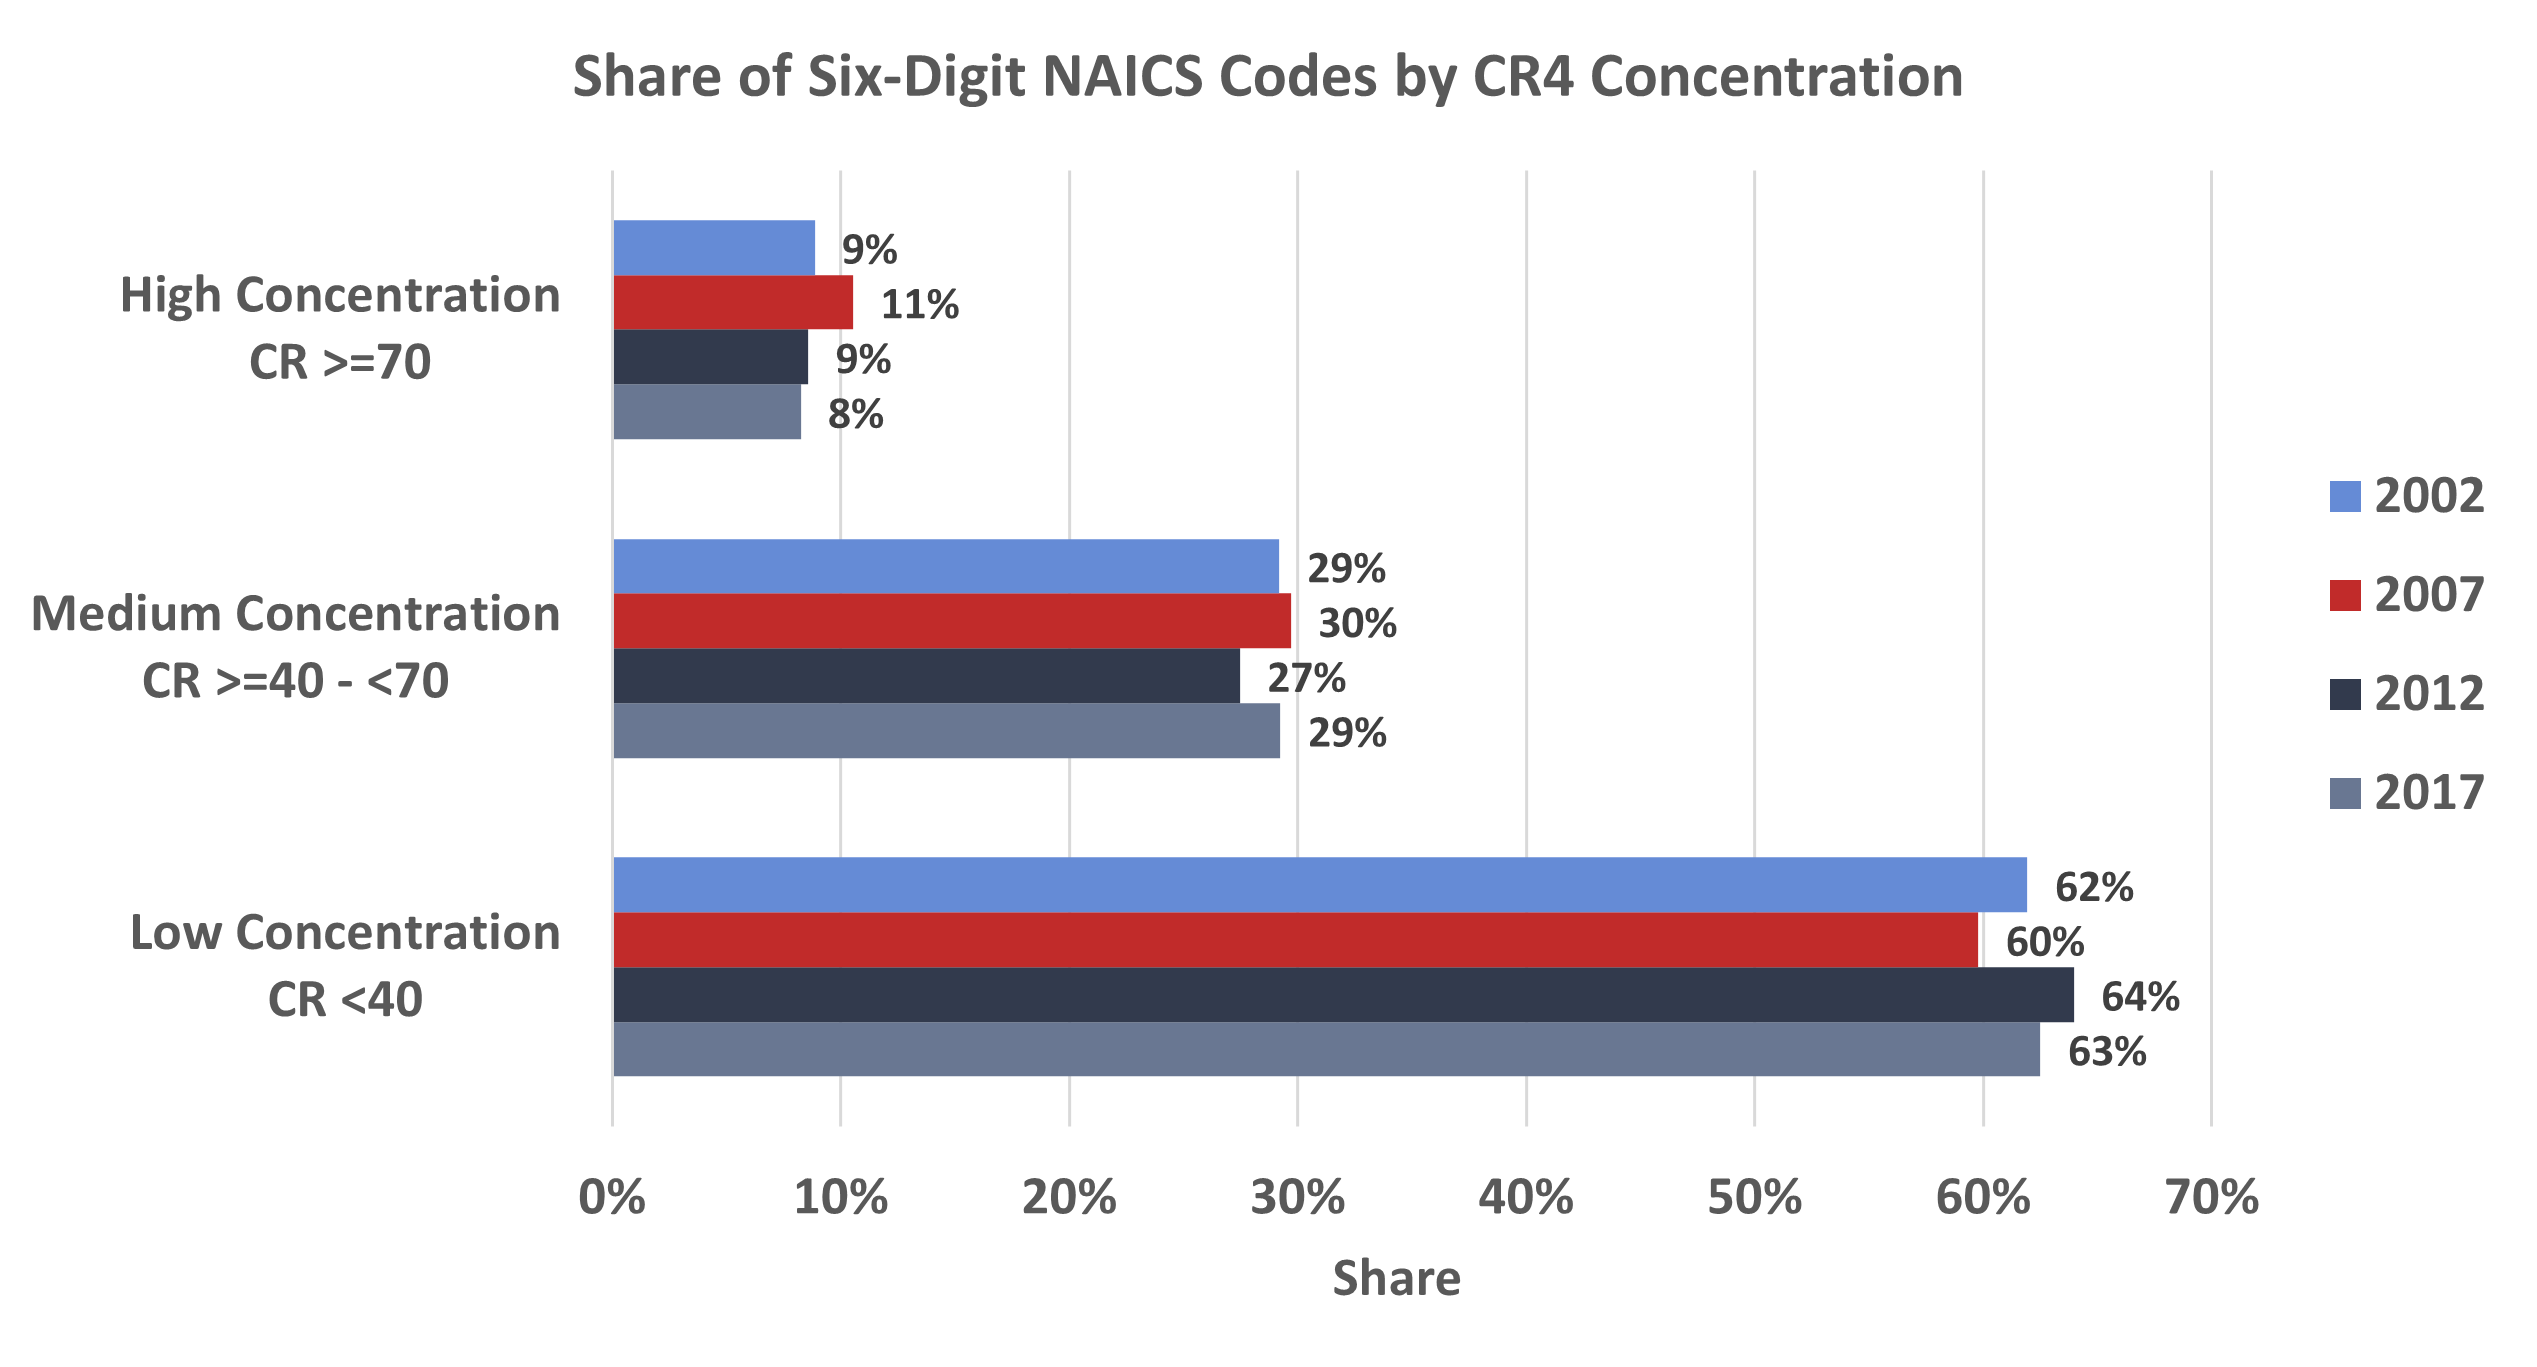
The main finding is displayed in Figure 1. It shows that the level of market concentration, give or take a few percentage points, has largely remained unchanged between 2002 and 2017. In 2002, 88 industries (9 percent of all 6-digit NAICS industries) were classified as highly concentrated with a CR4 of 70 percent or greater.[7] Fast forward to 2017 and the share of highly concentrated industries was slightly lower at 8 percent.
The average CR4 for all 6-digit NAICS industries in 2002 was 35.0 percent. That level increased to 36.8 percent in 2007 before falling to 35.2 percent in both 2012 and 2017.
Comparing 6-digit NAICS codes with data for both 2002 and 2017, the average change in CR4 was 2.3 percentage points. Thirty-eight percent of firms saw a decrease in the CR4, while just 19 percent saw an increase of 10 percentage points or more.
For industries with data for both 2012 and 2017, nearly half saw a decrease in the CR4, meaning a lower share of sales among the four largest firms. The average change in the CR4 was an increase of 0.4 percentage points, while the median change was up 0.2 percentage points. Of the industries that saw an increase in concentration ratios, only 13 percent increased by at least 10 percentage points.
The stability of the distribution among low, medium, and high concentration levels and the small share of the sample with an increase of the CR4 of greater than 10 percentage points makes it difficult to argue that industries have become more concentrated over time.
Figure 1
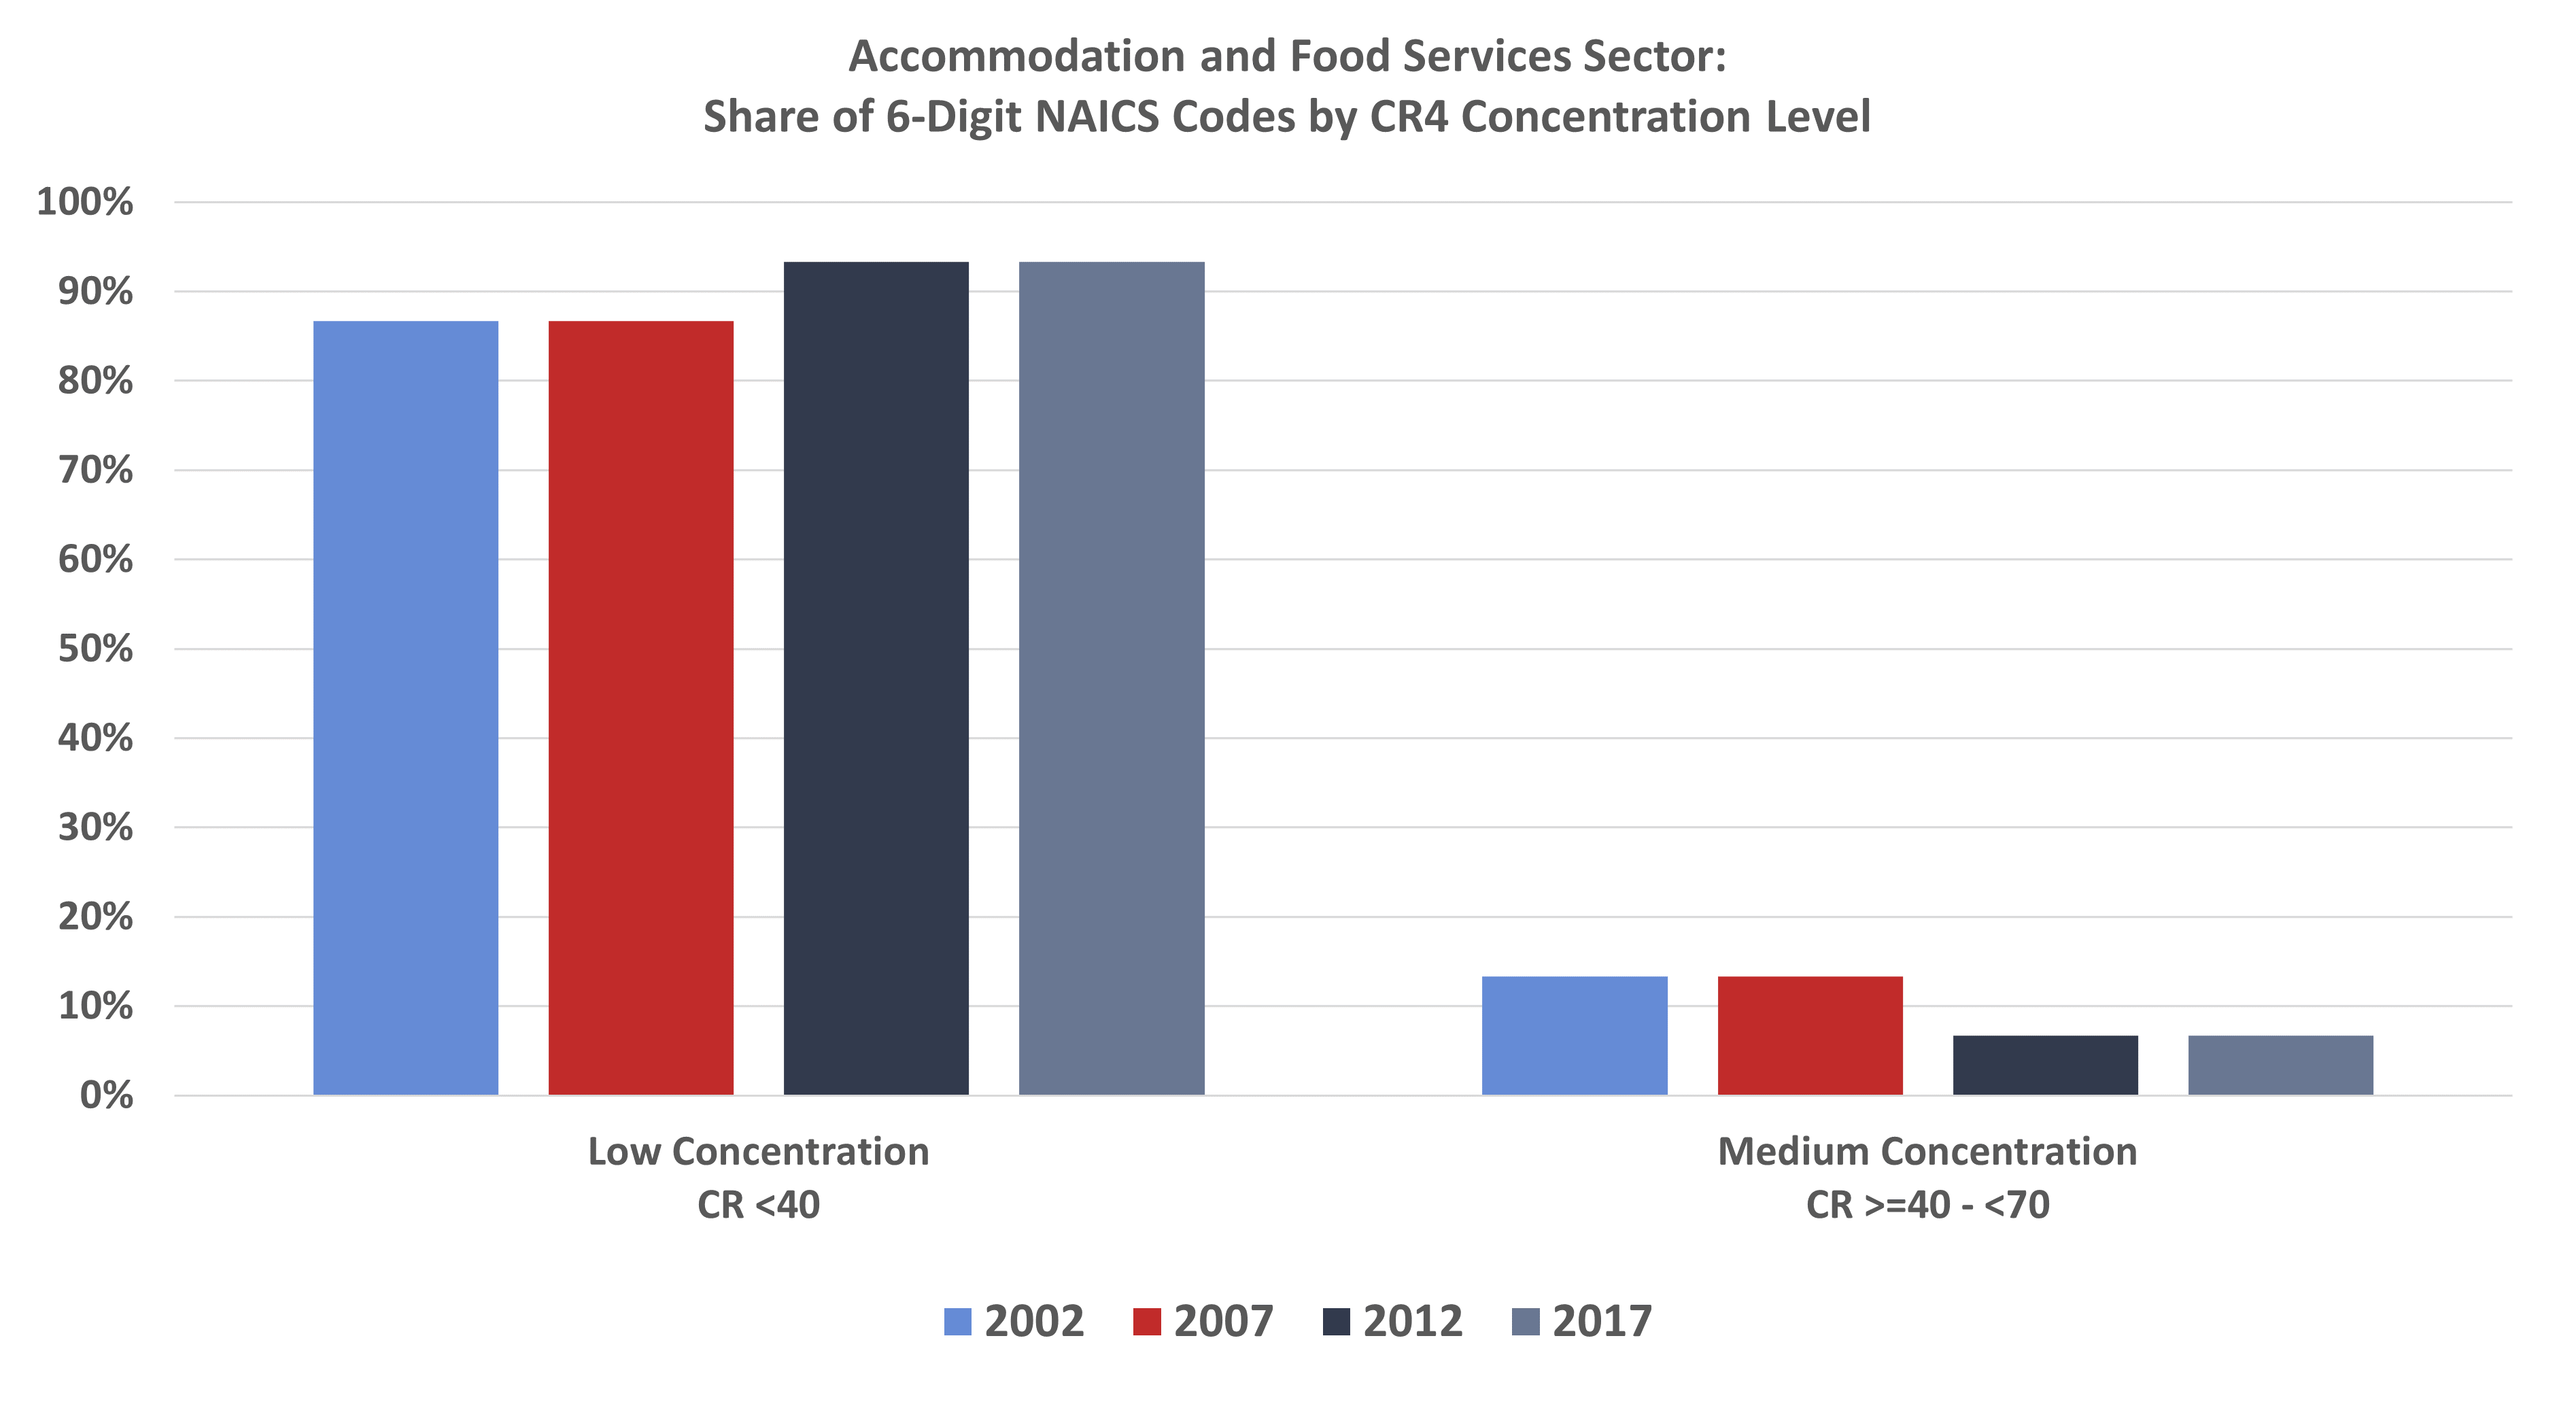
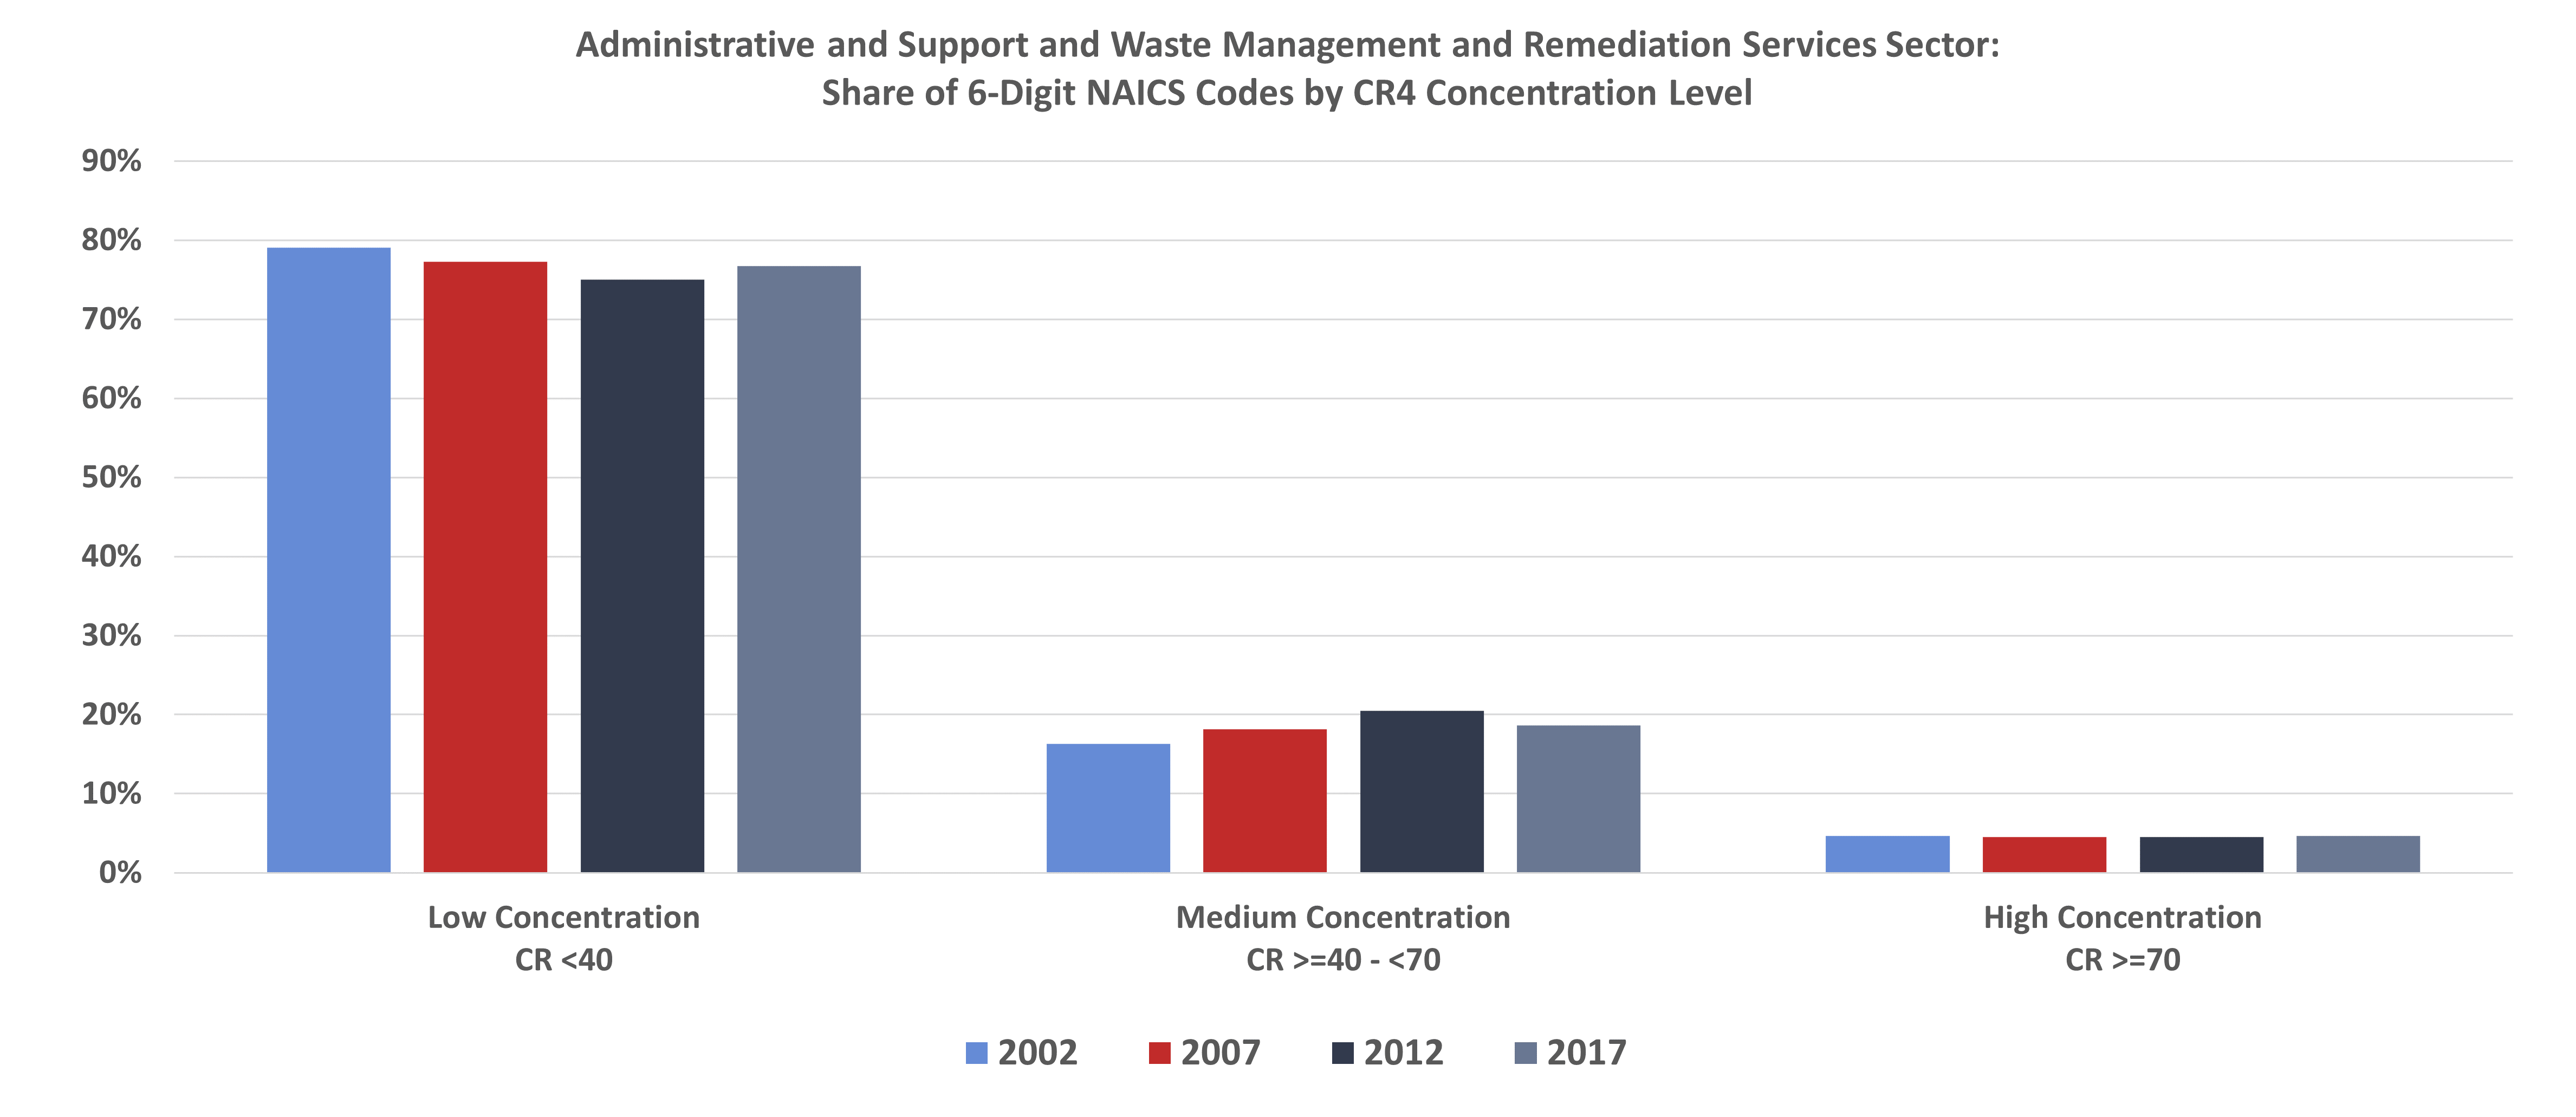
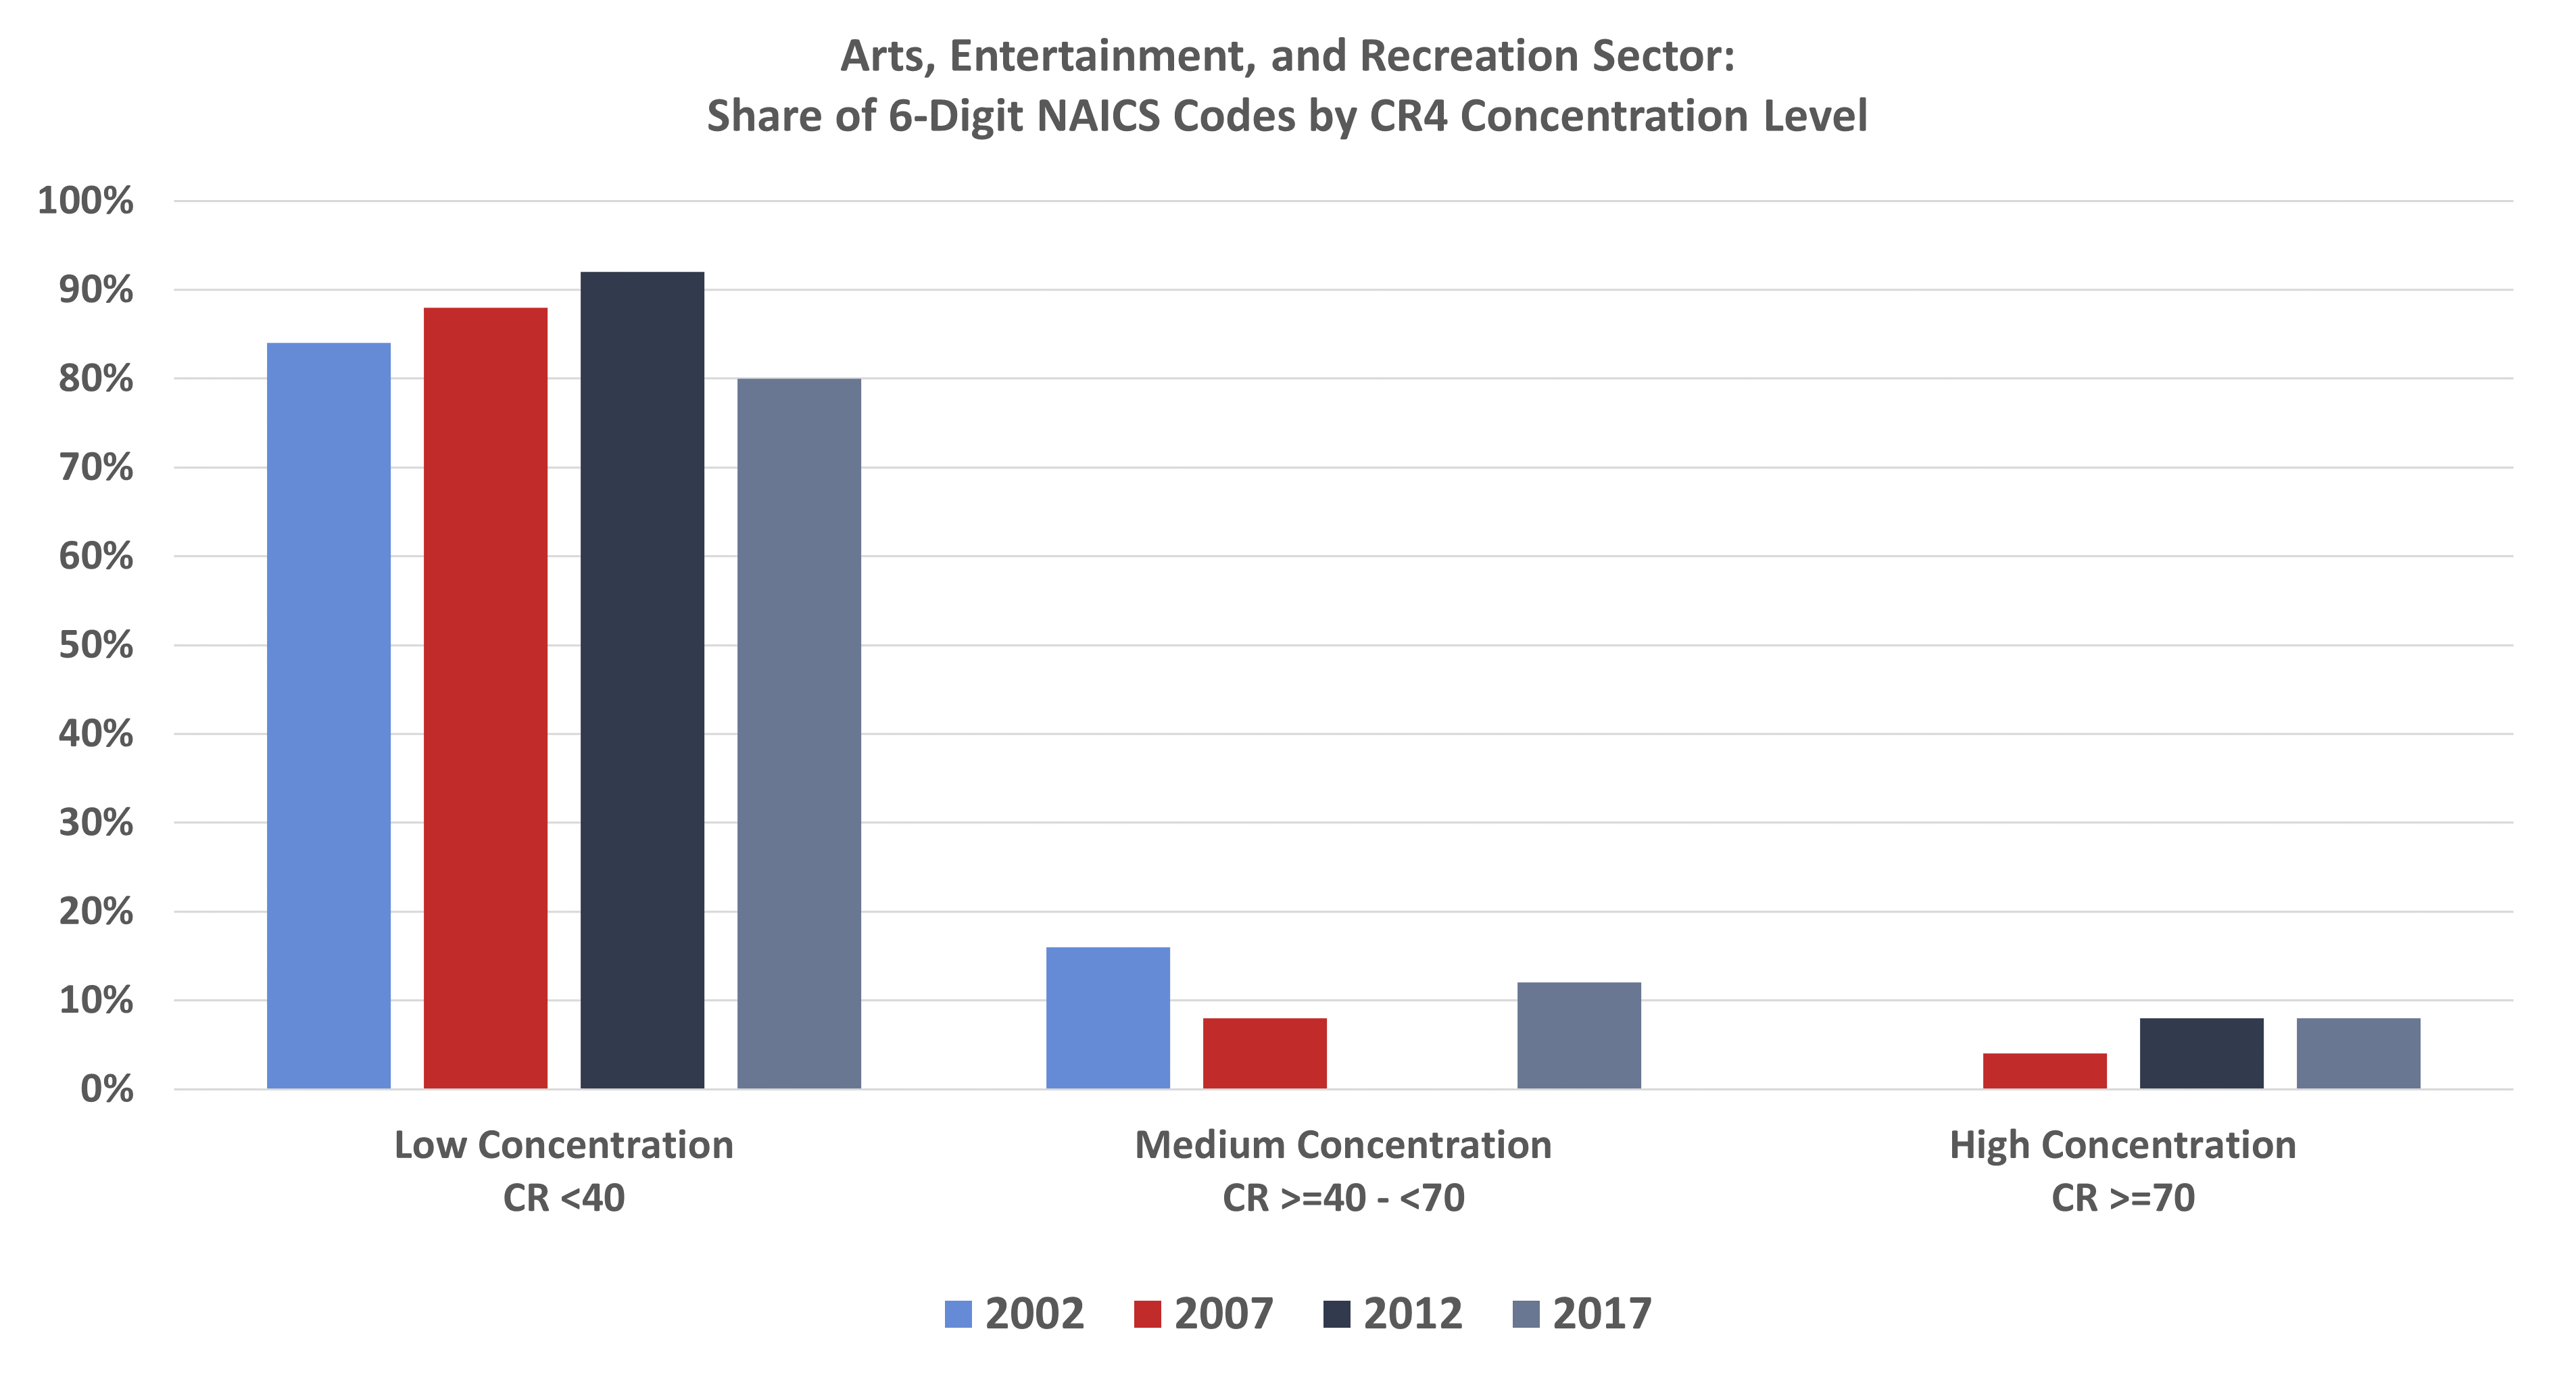
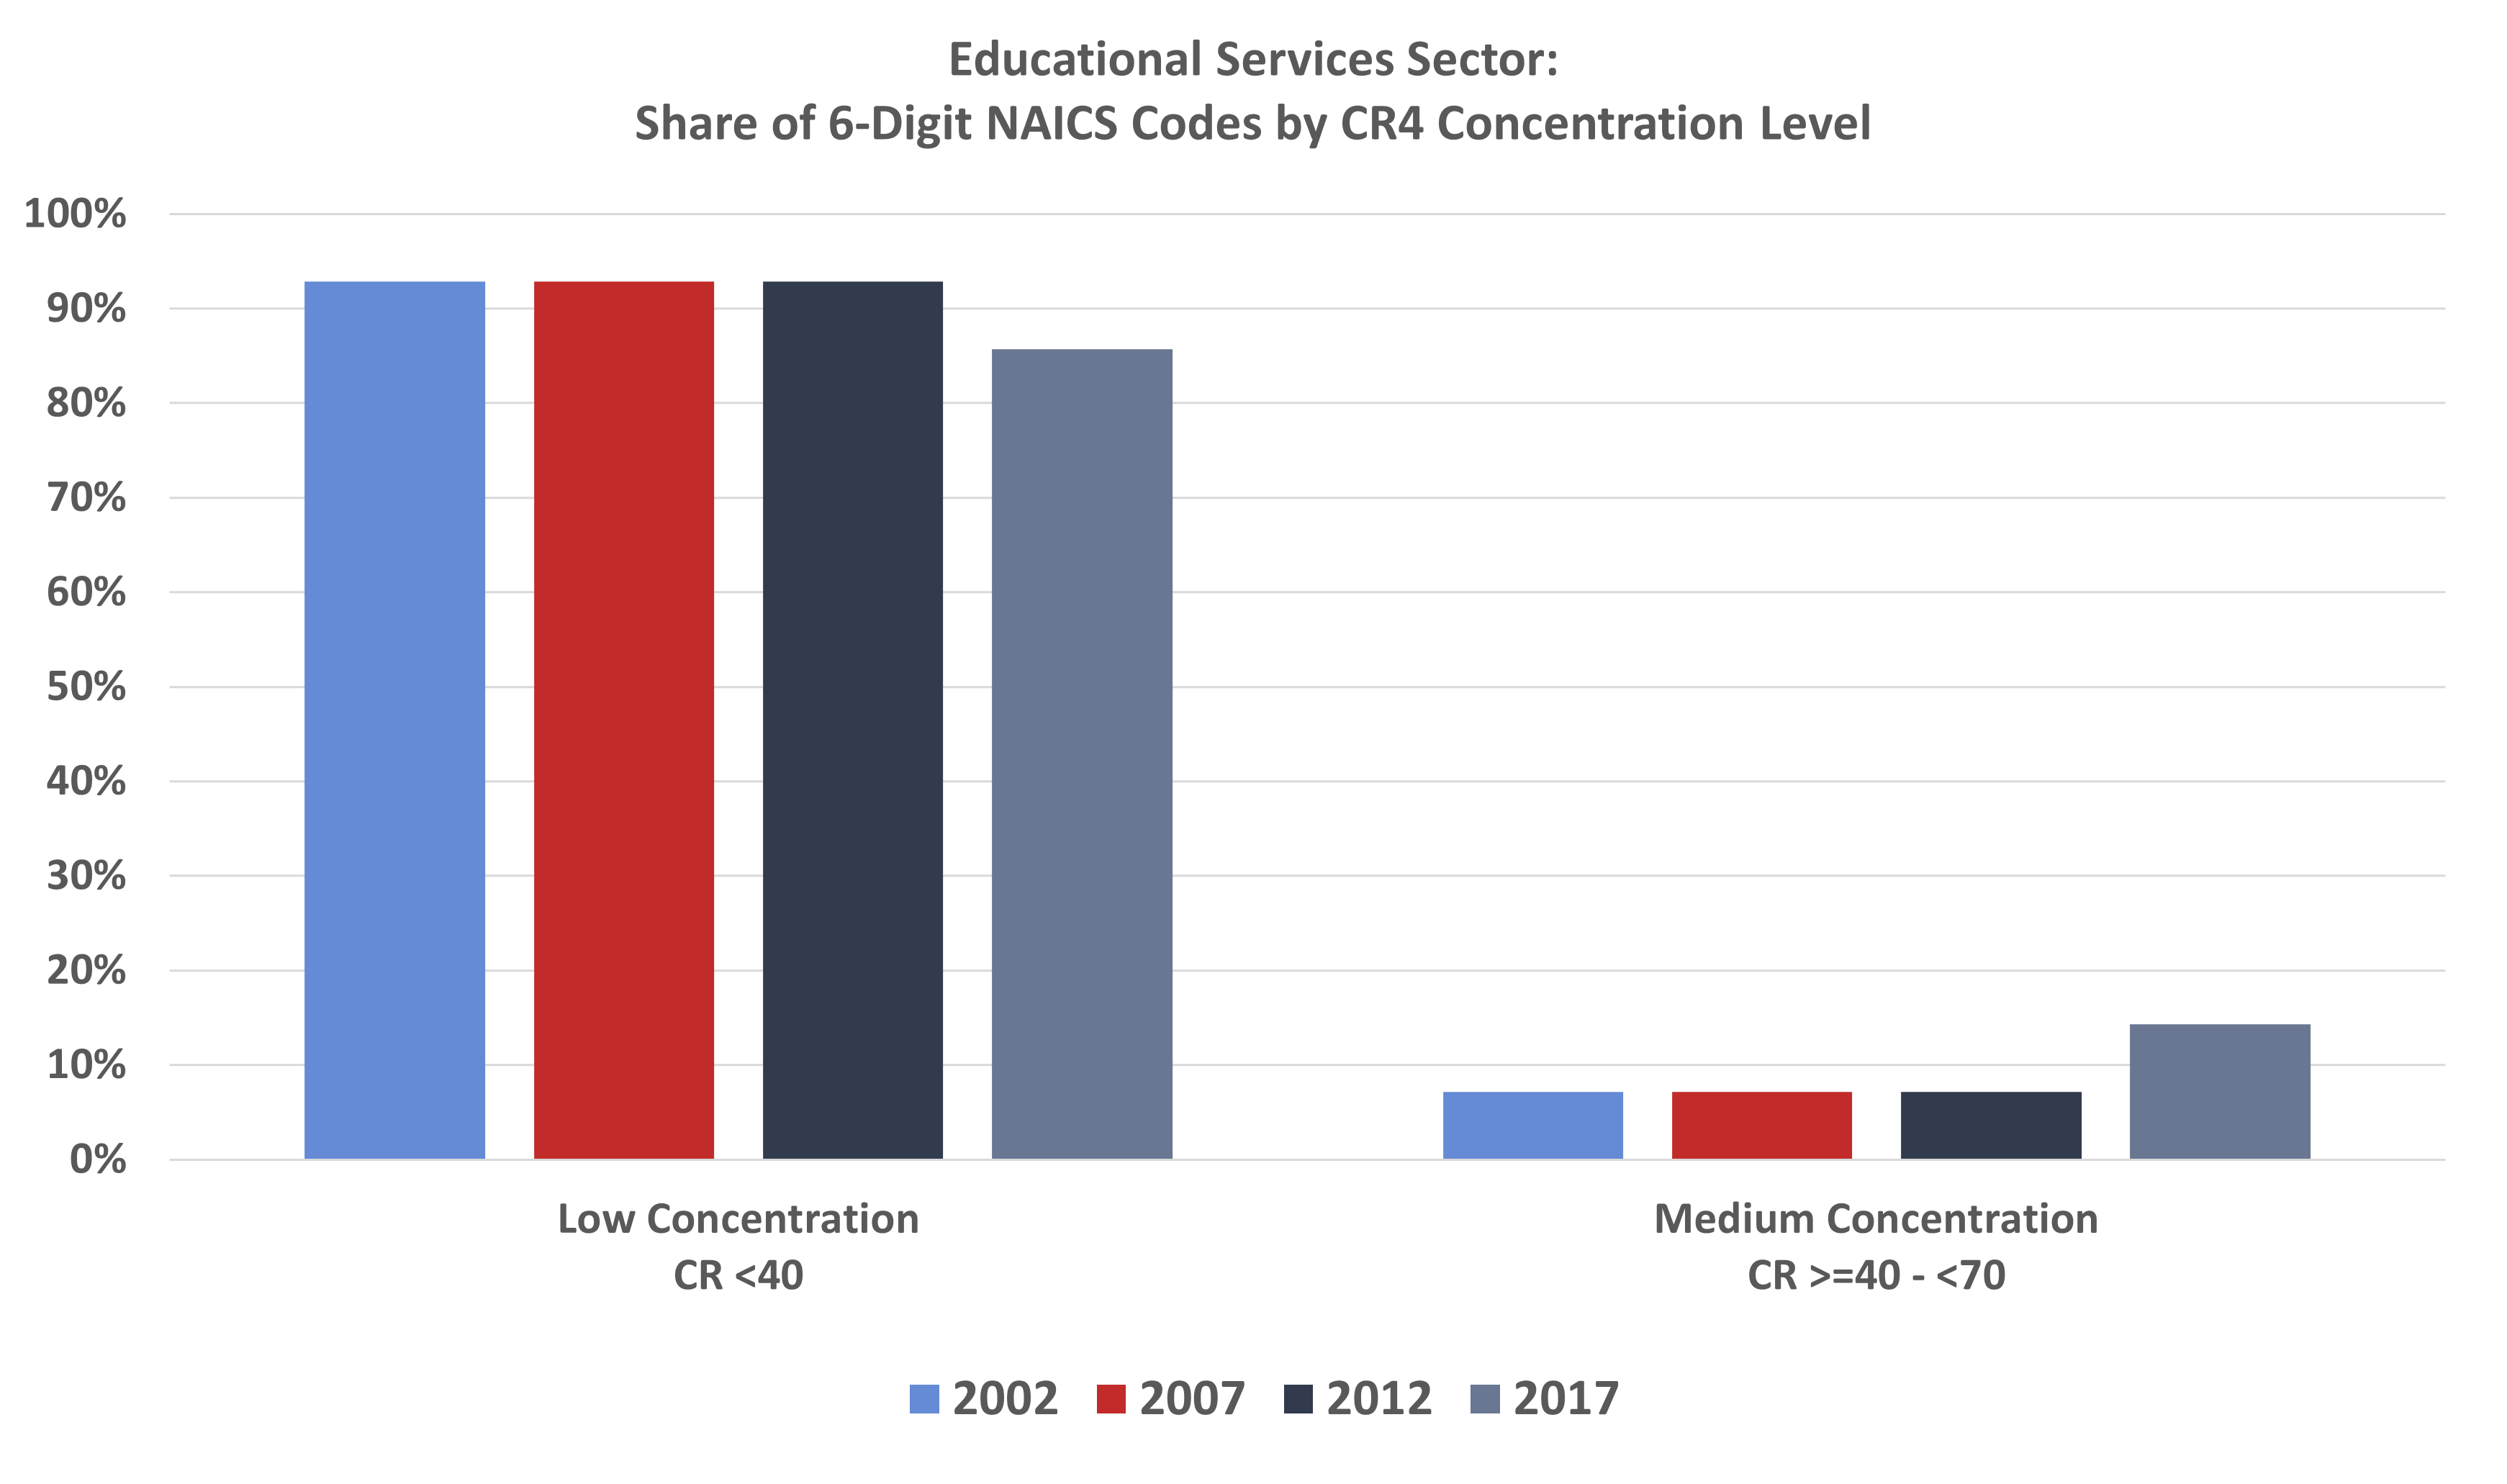
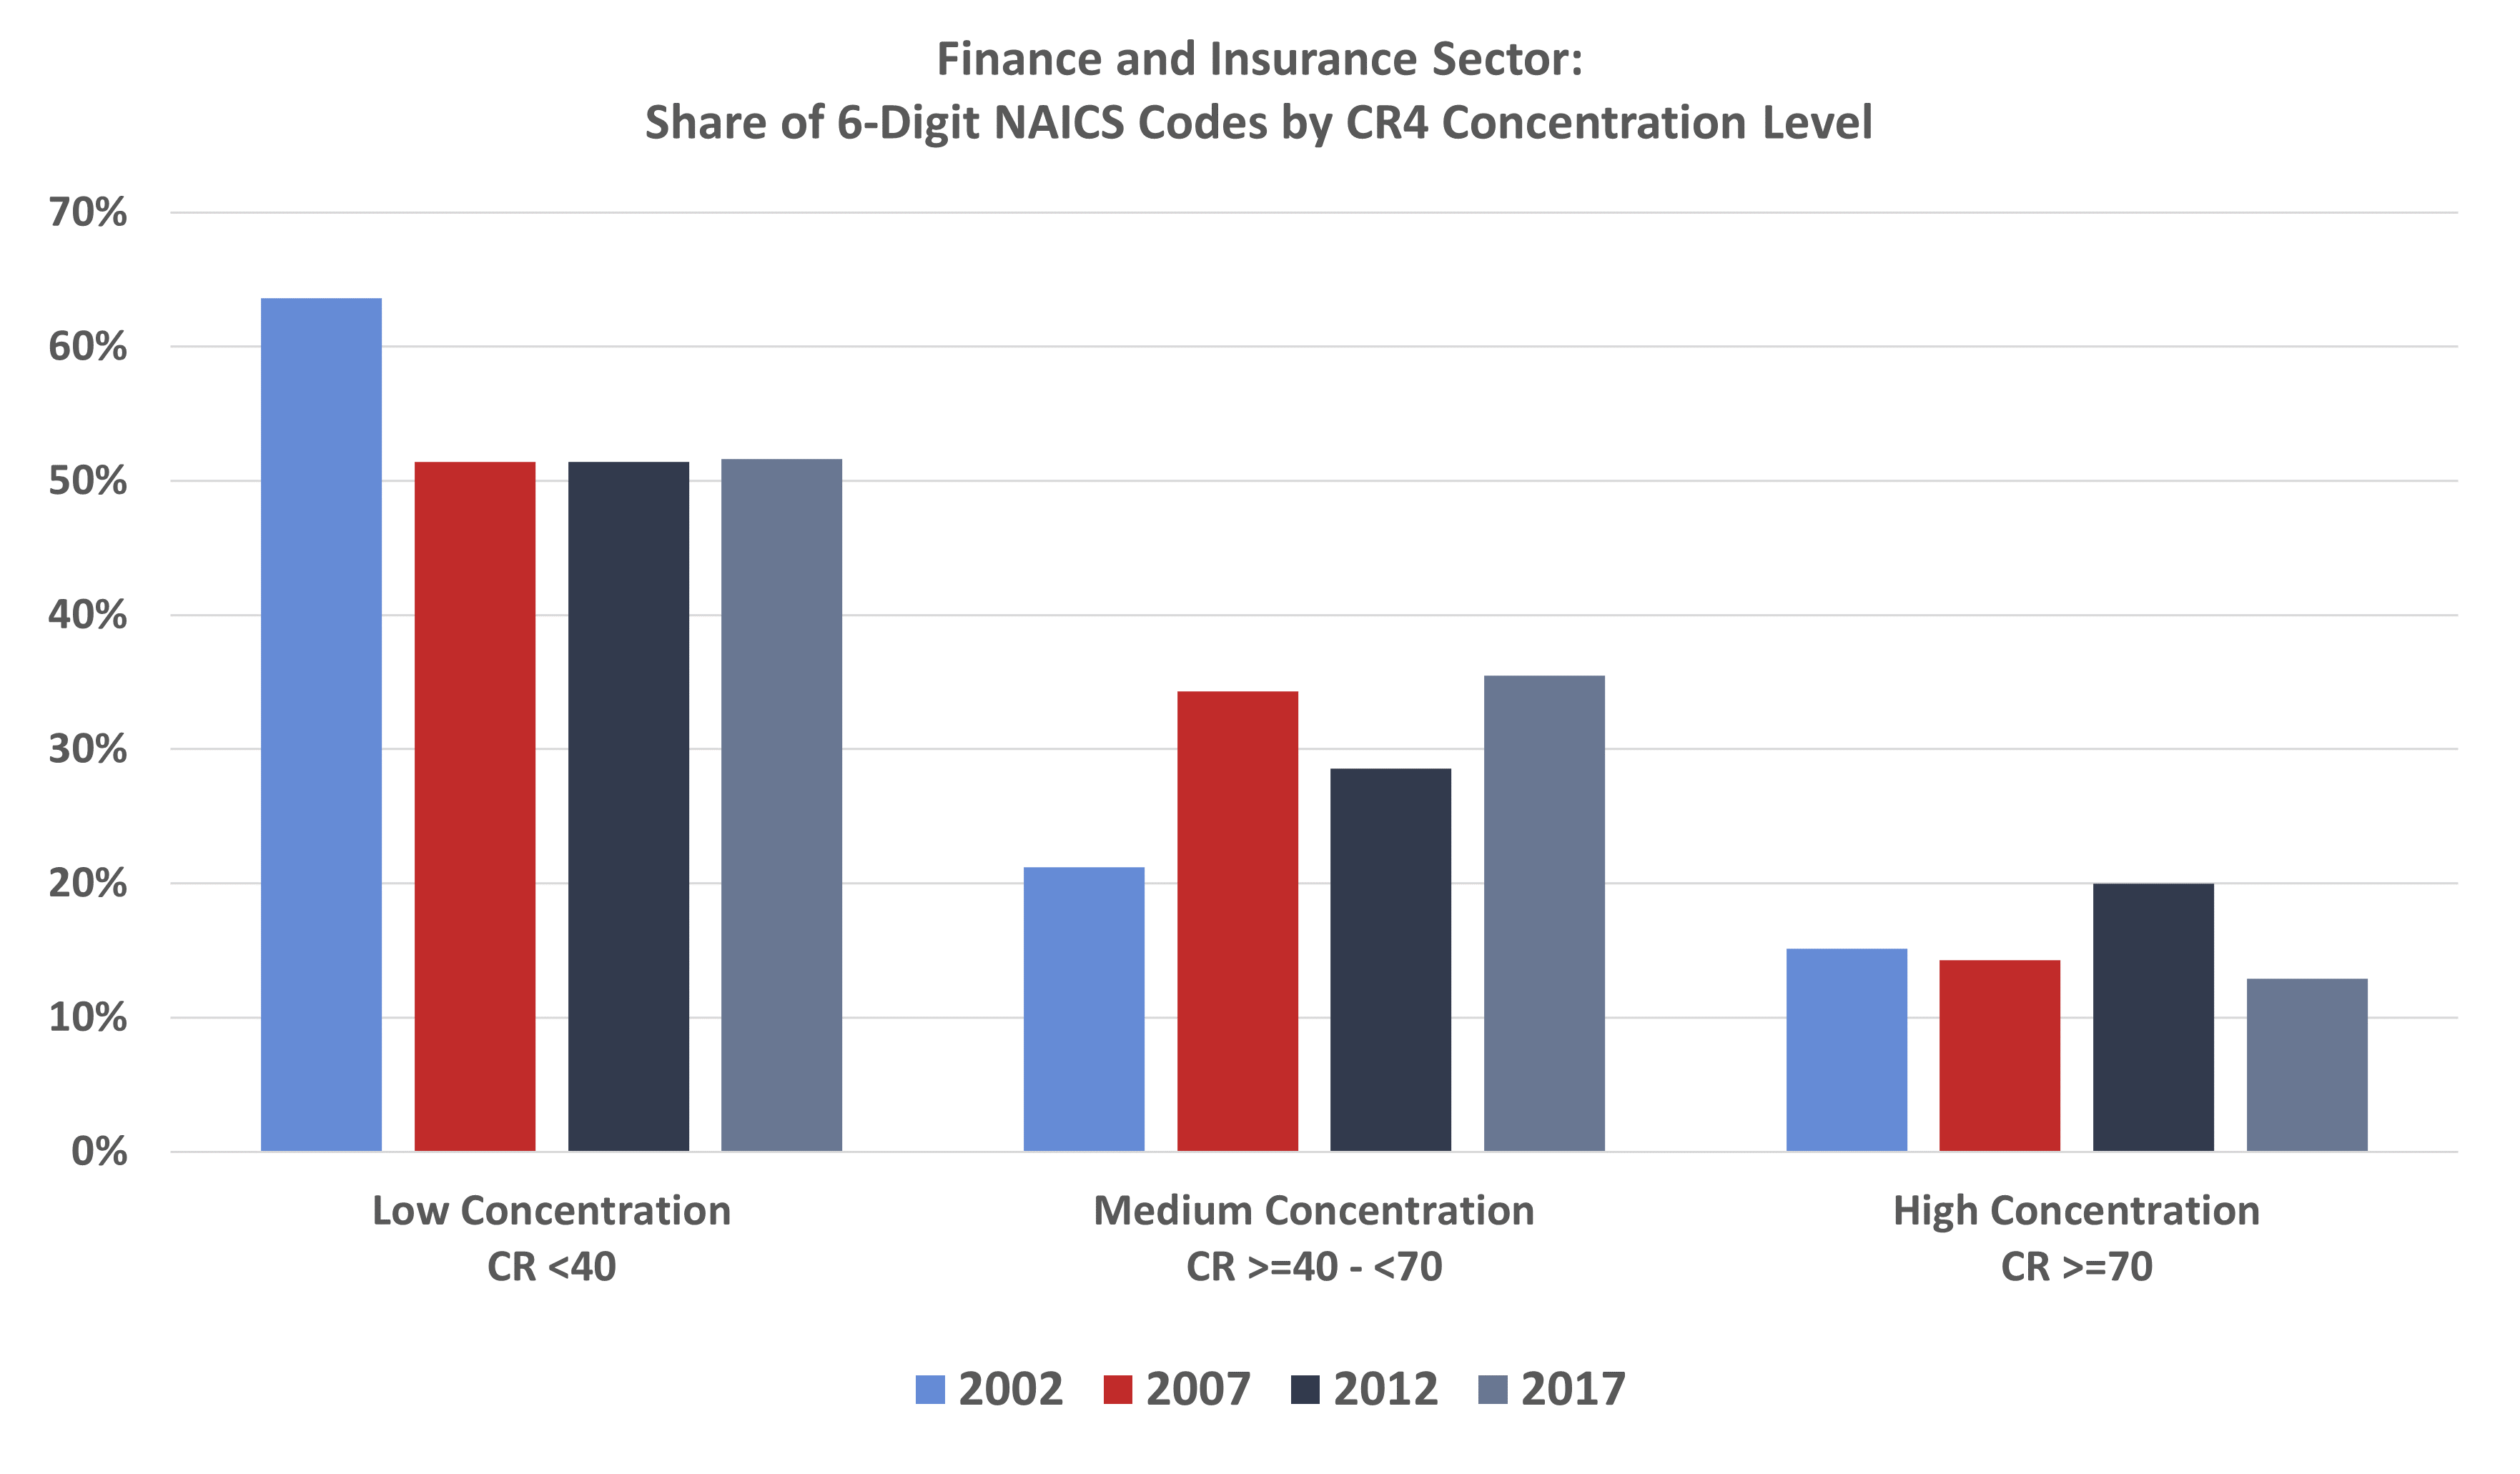
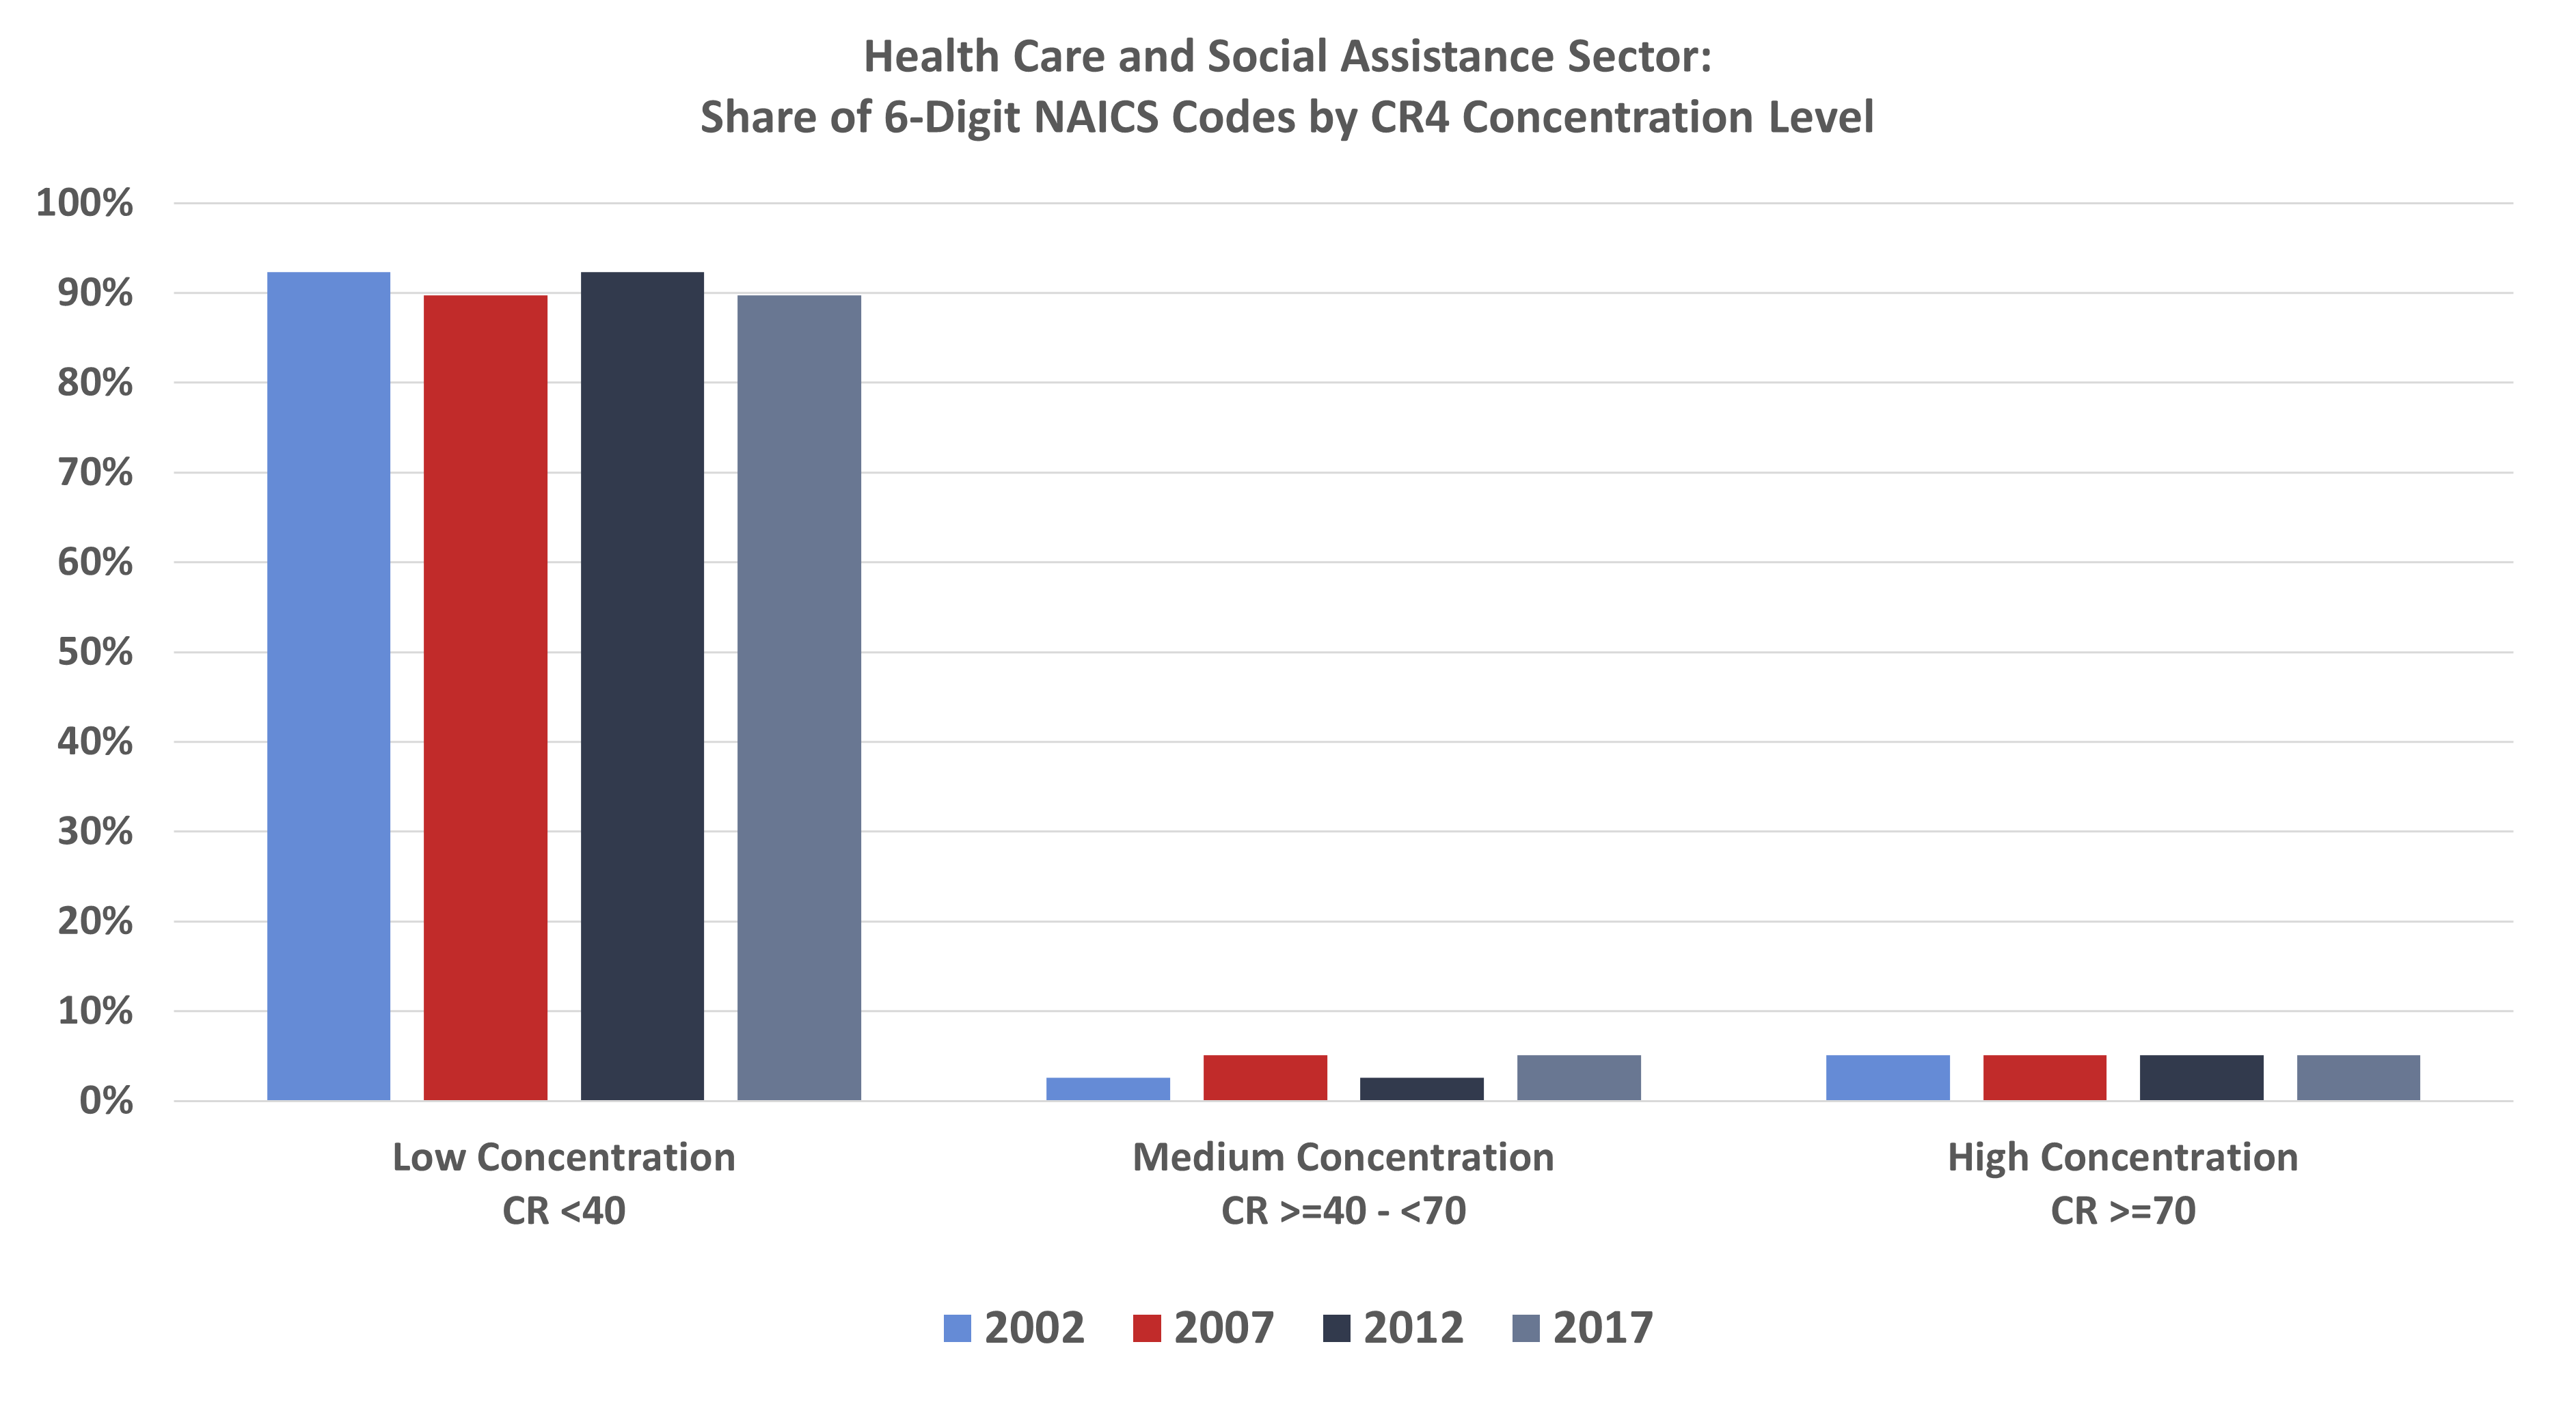
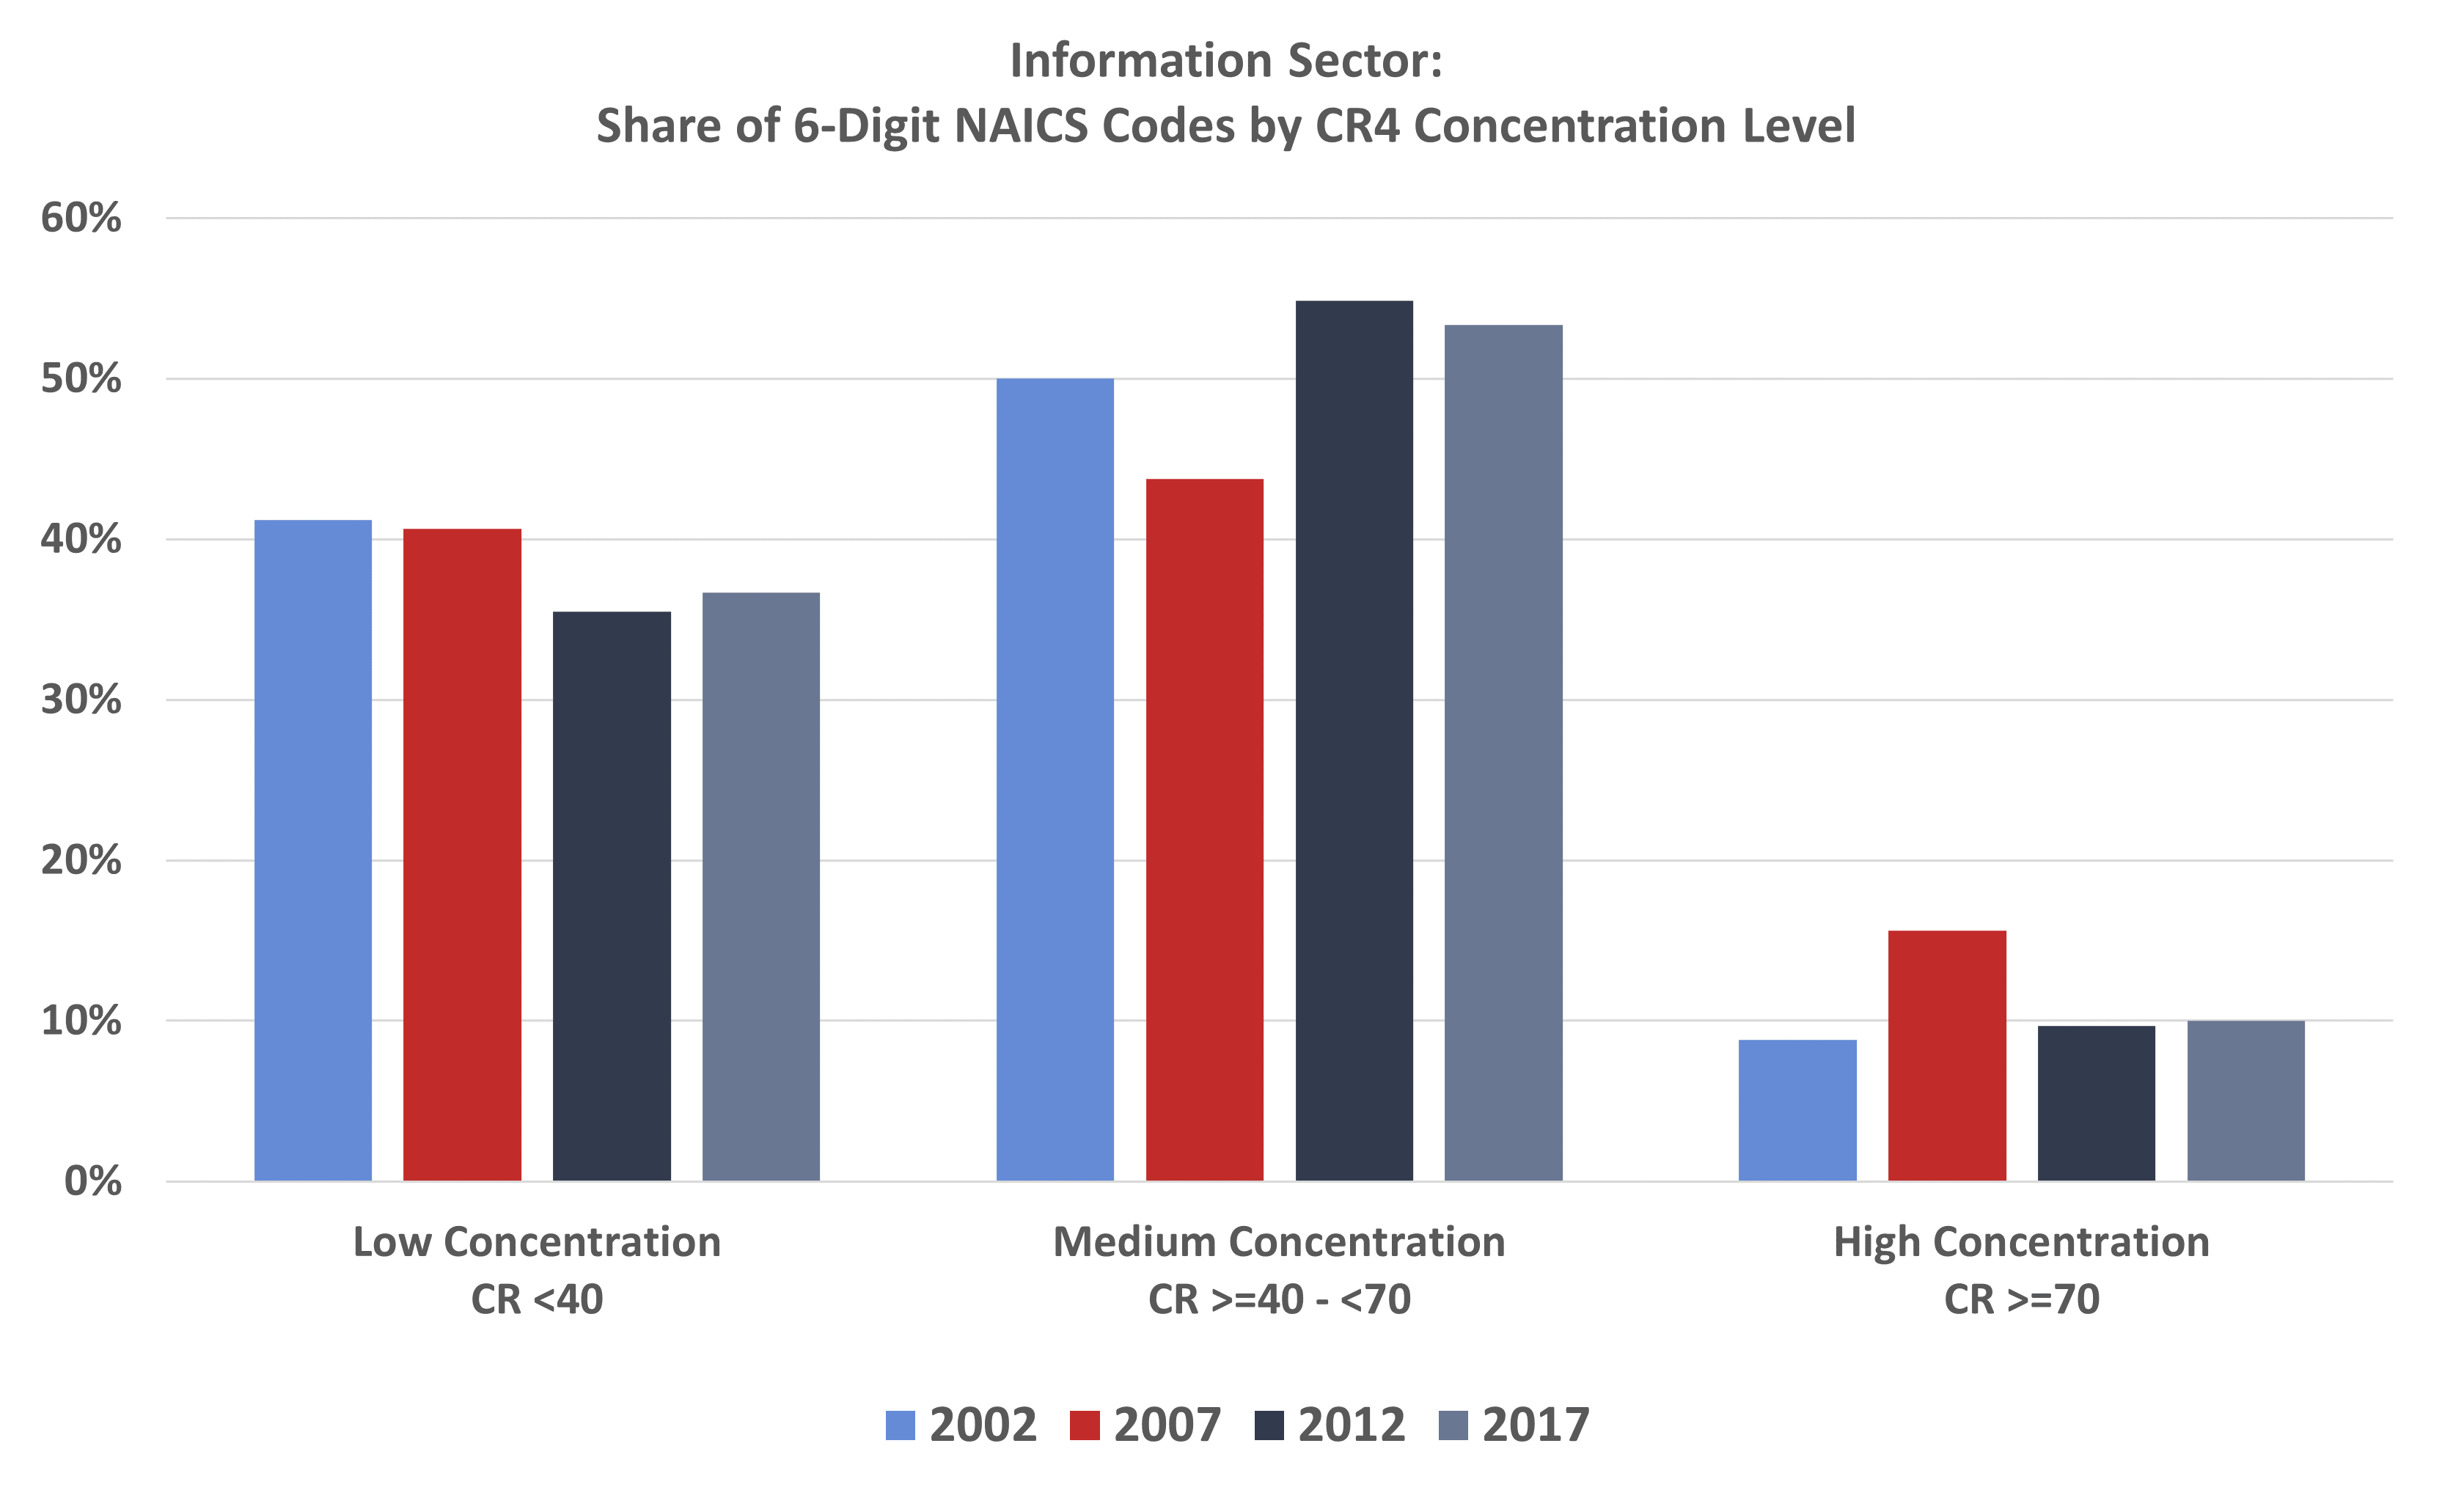
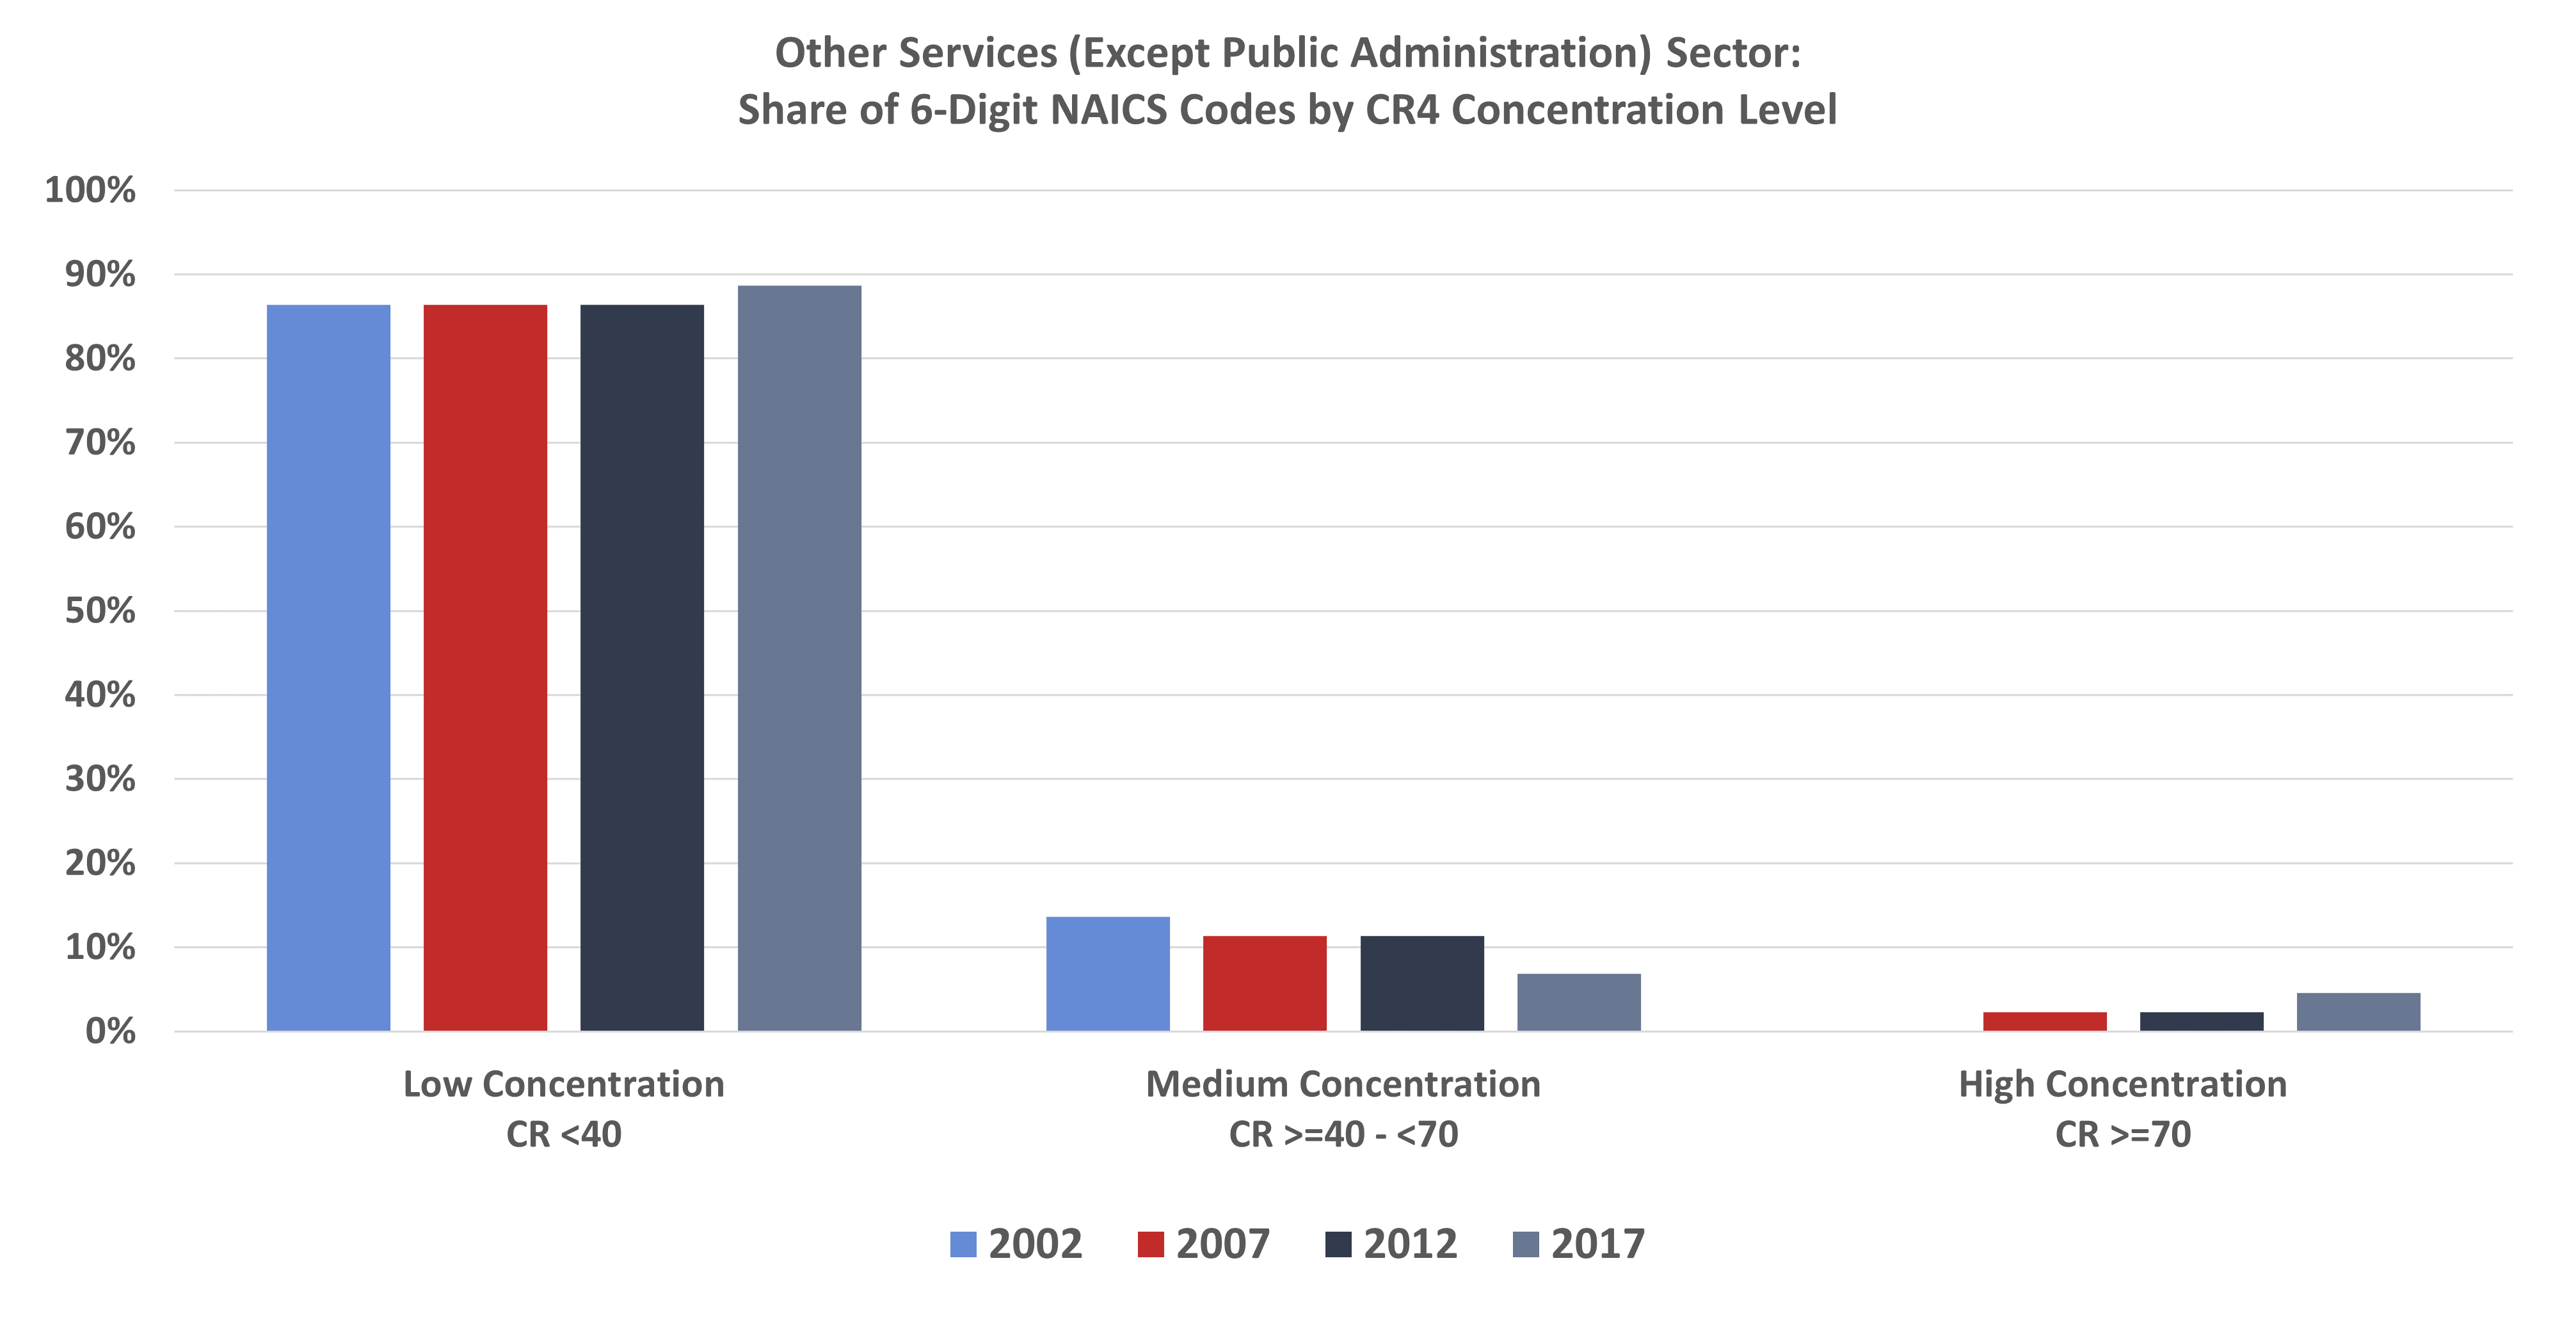
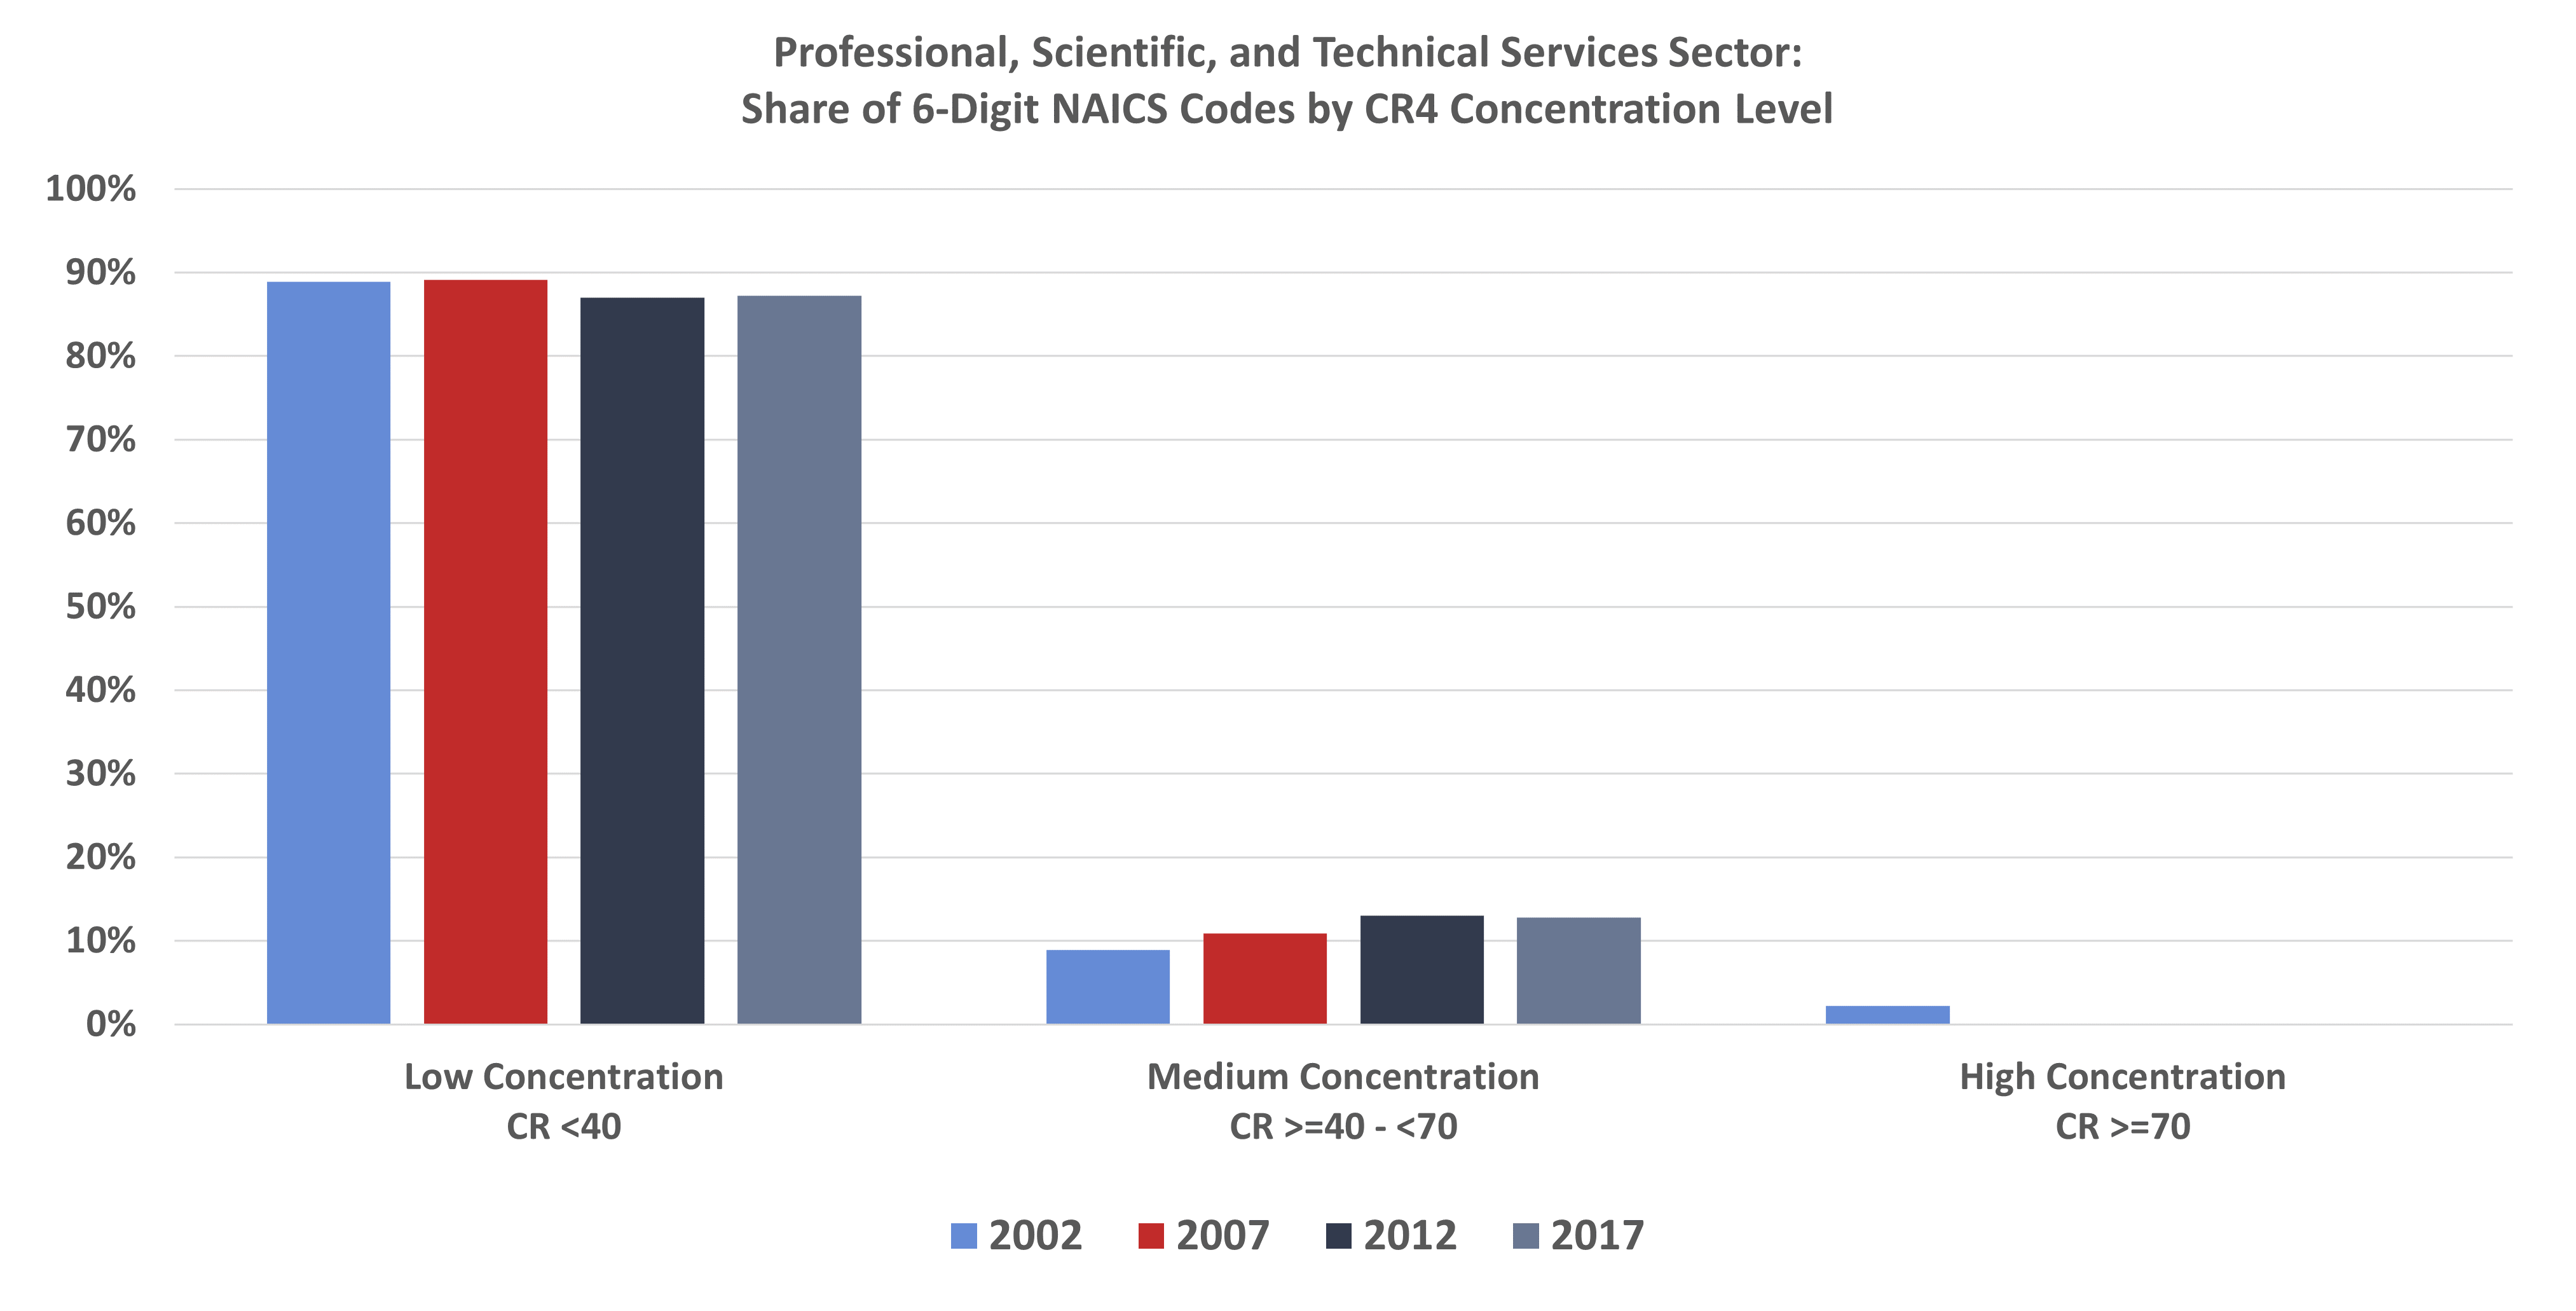
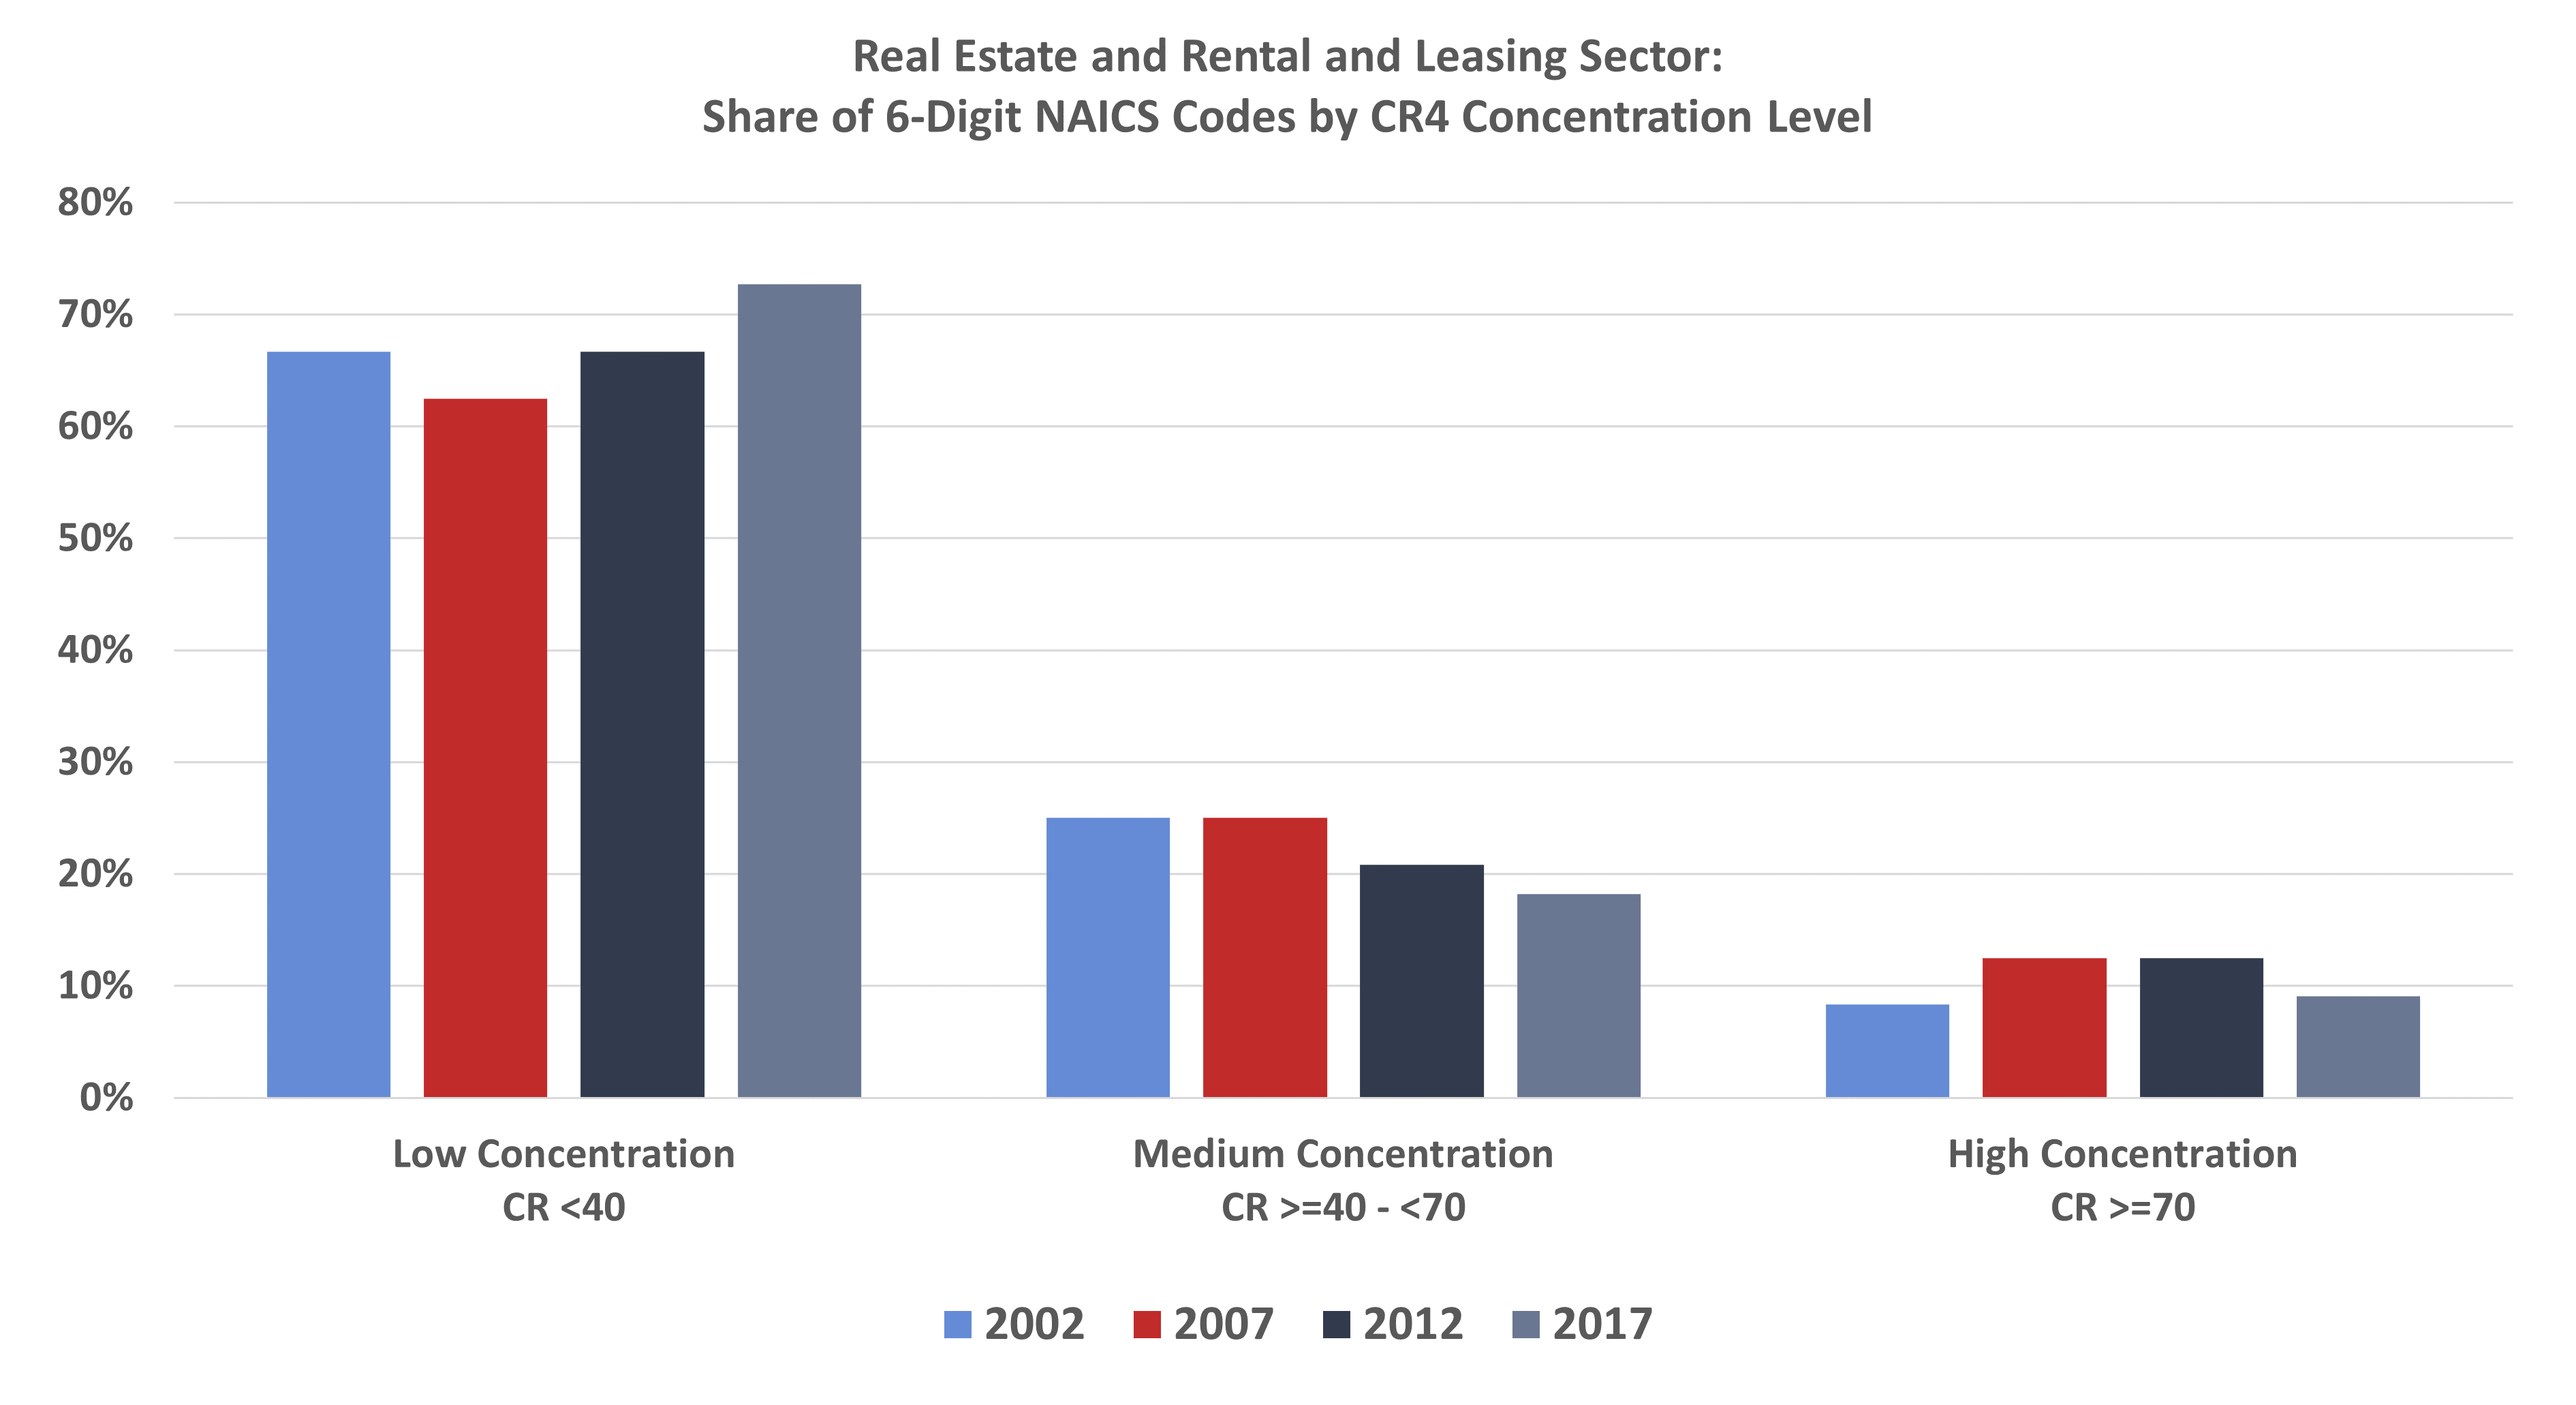
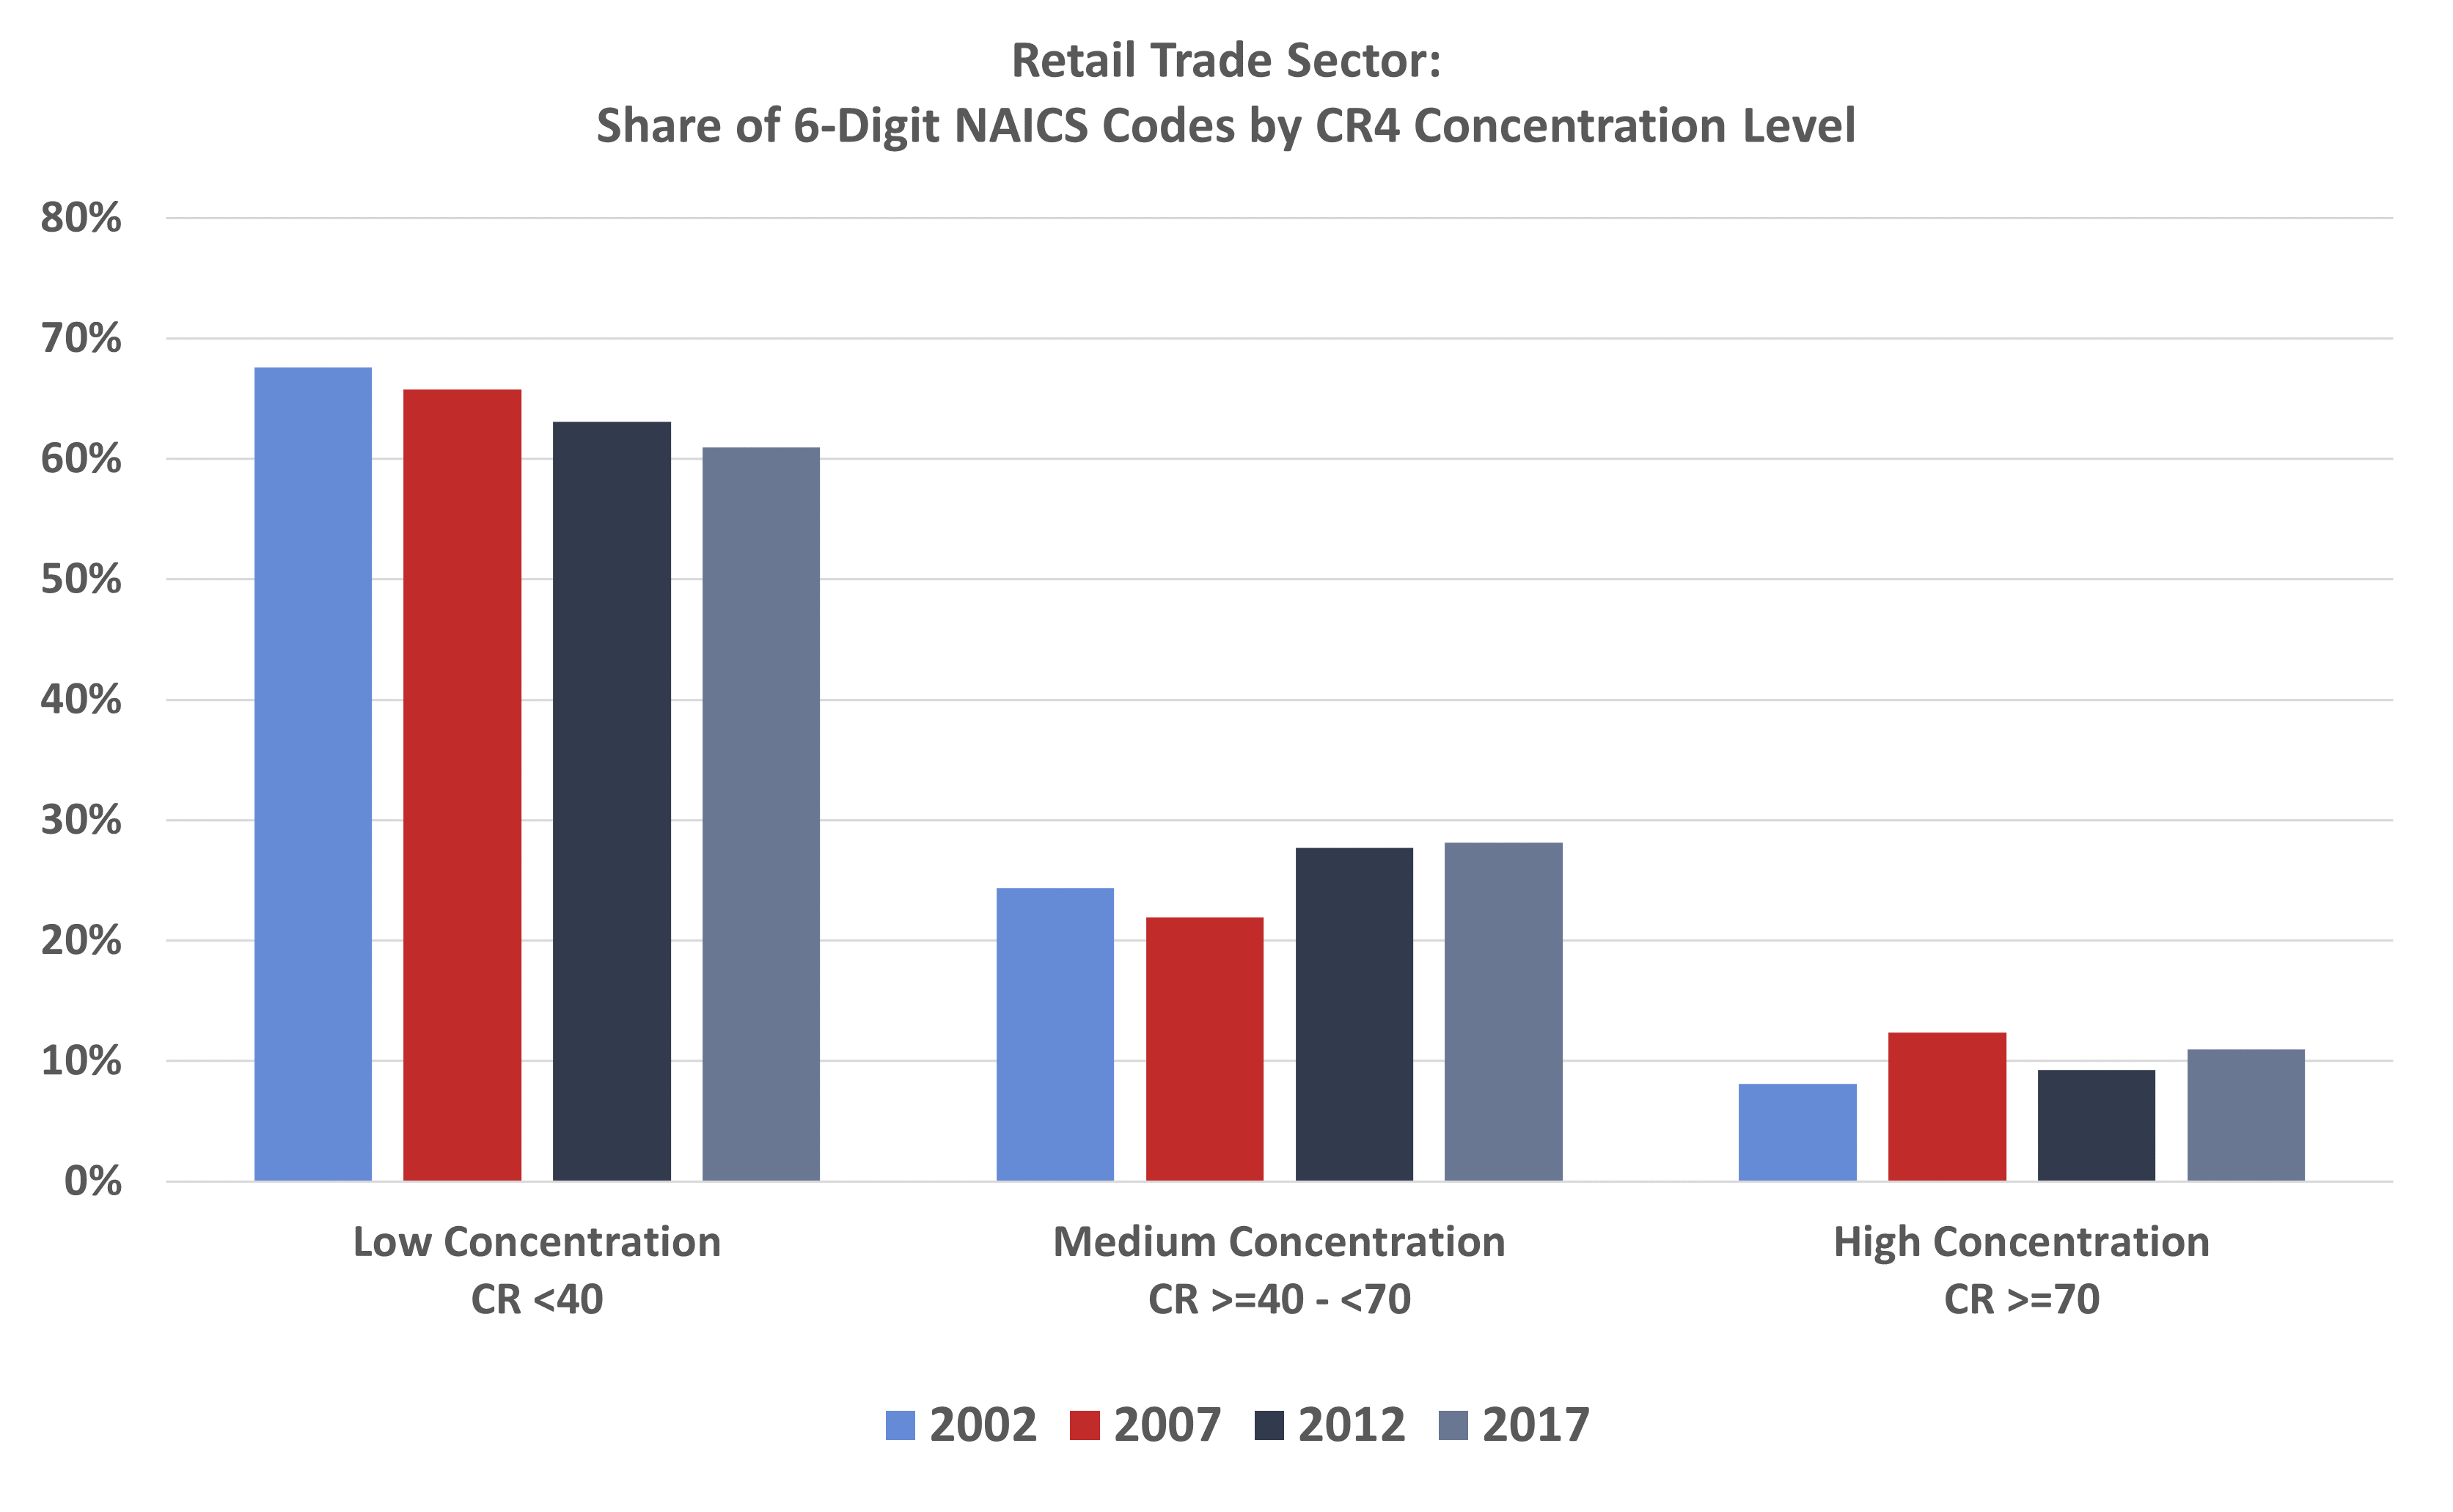
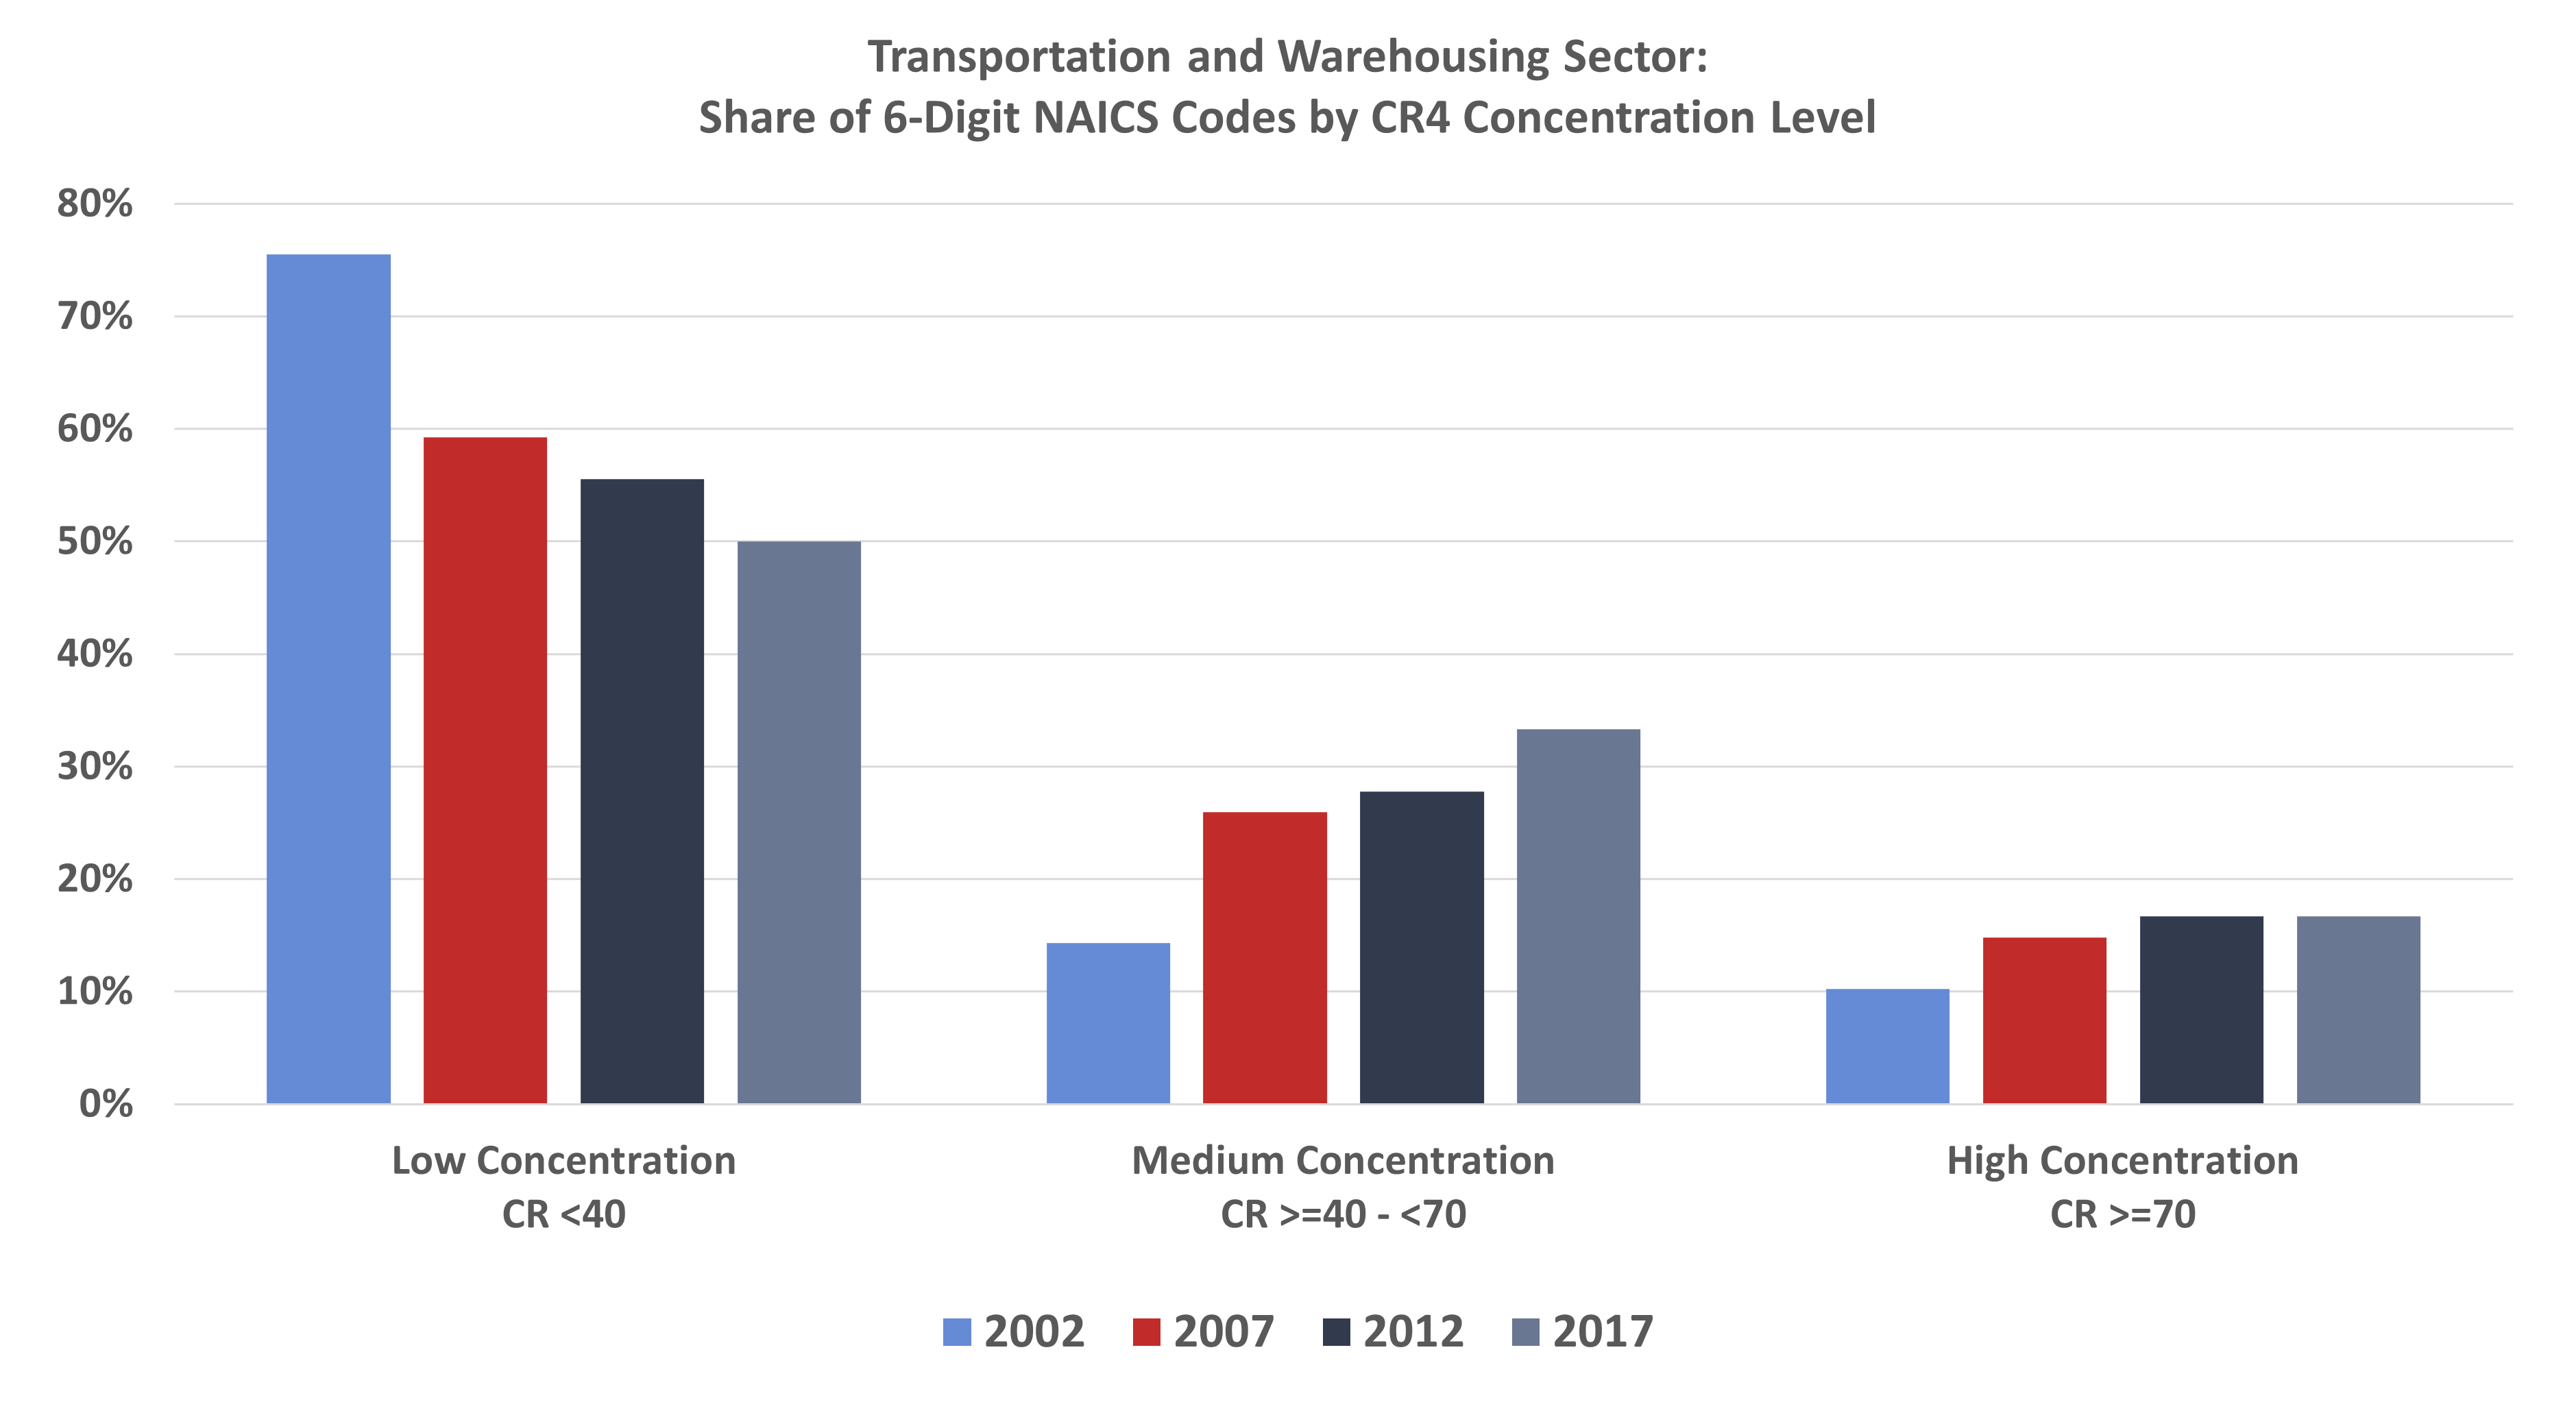
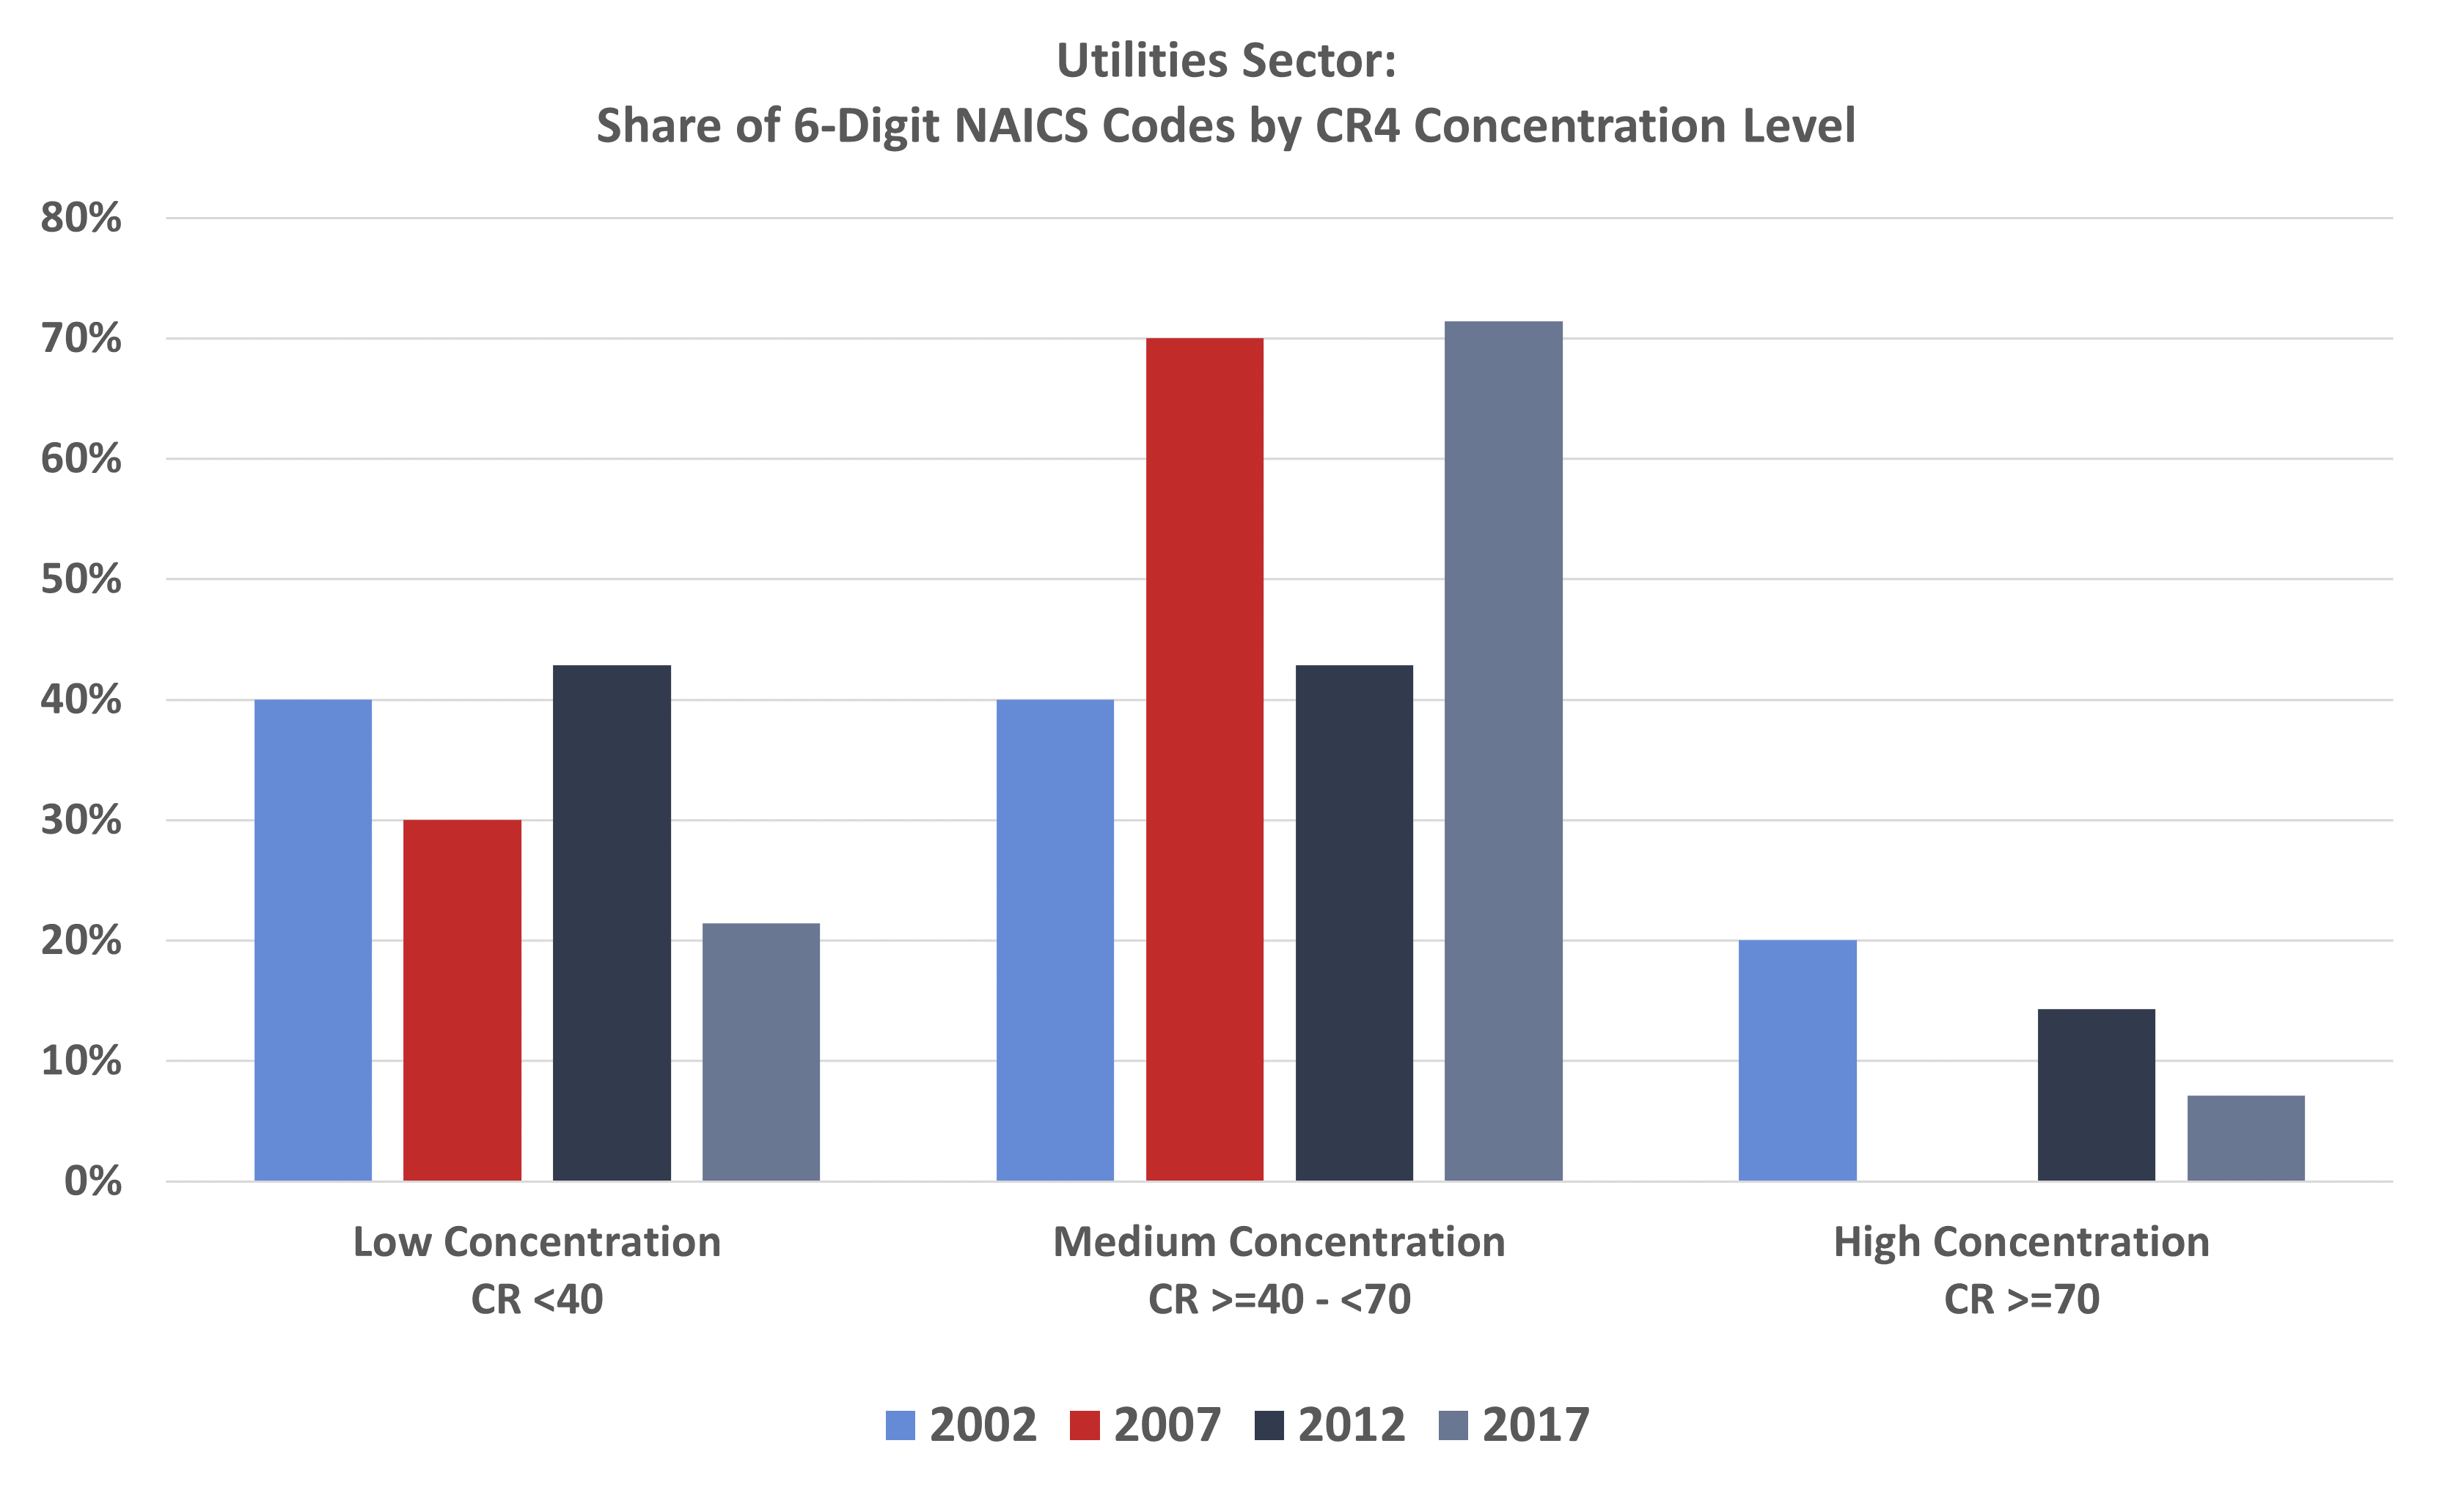
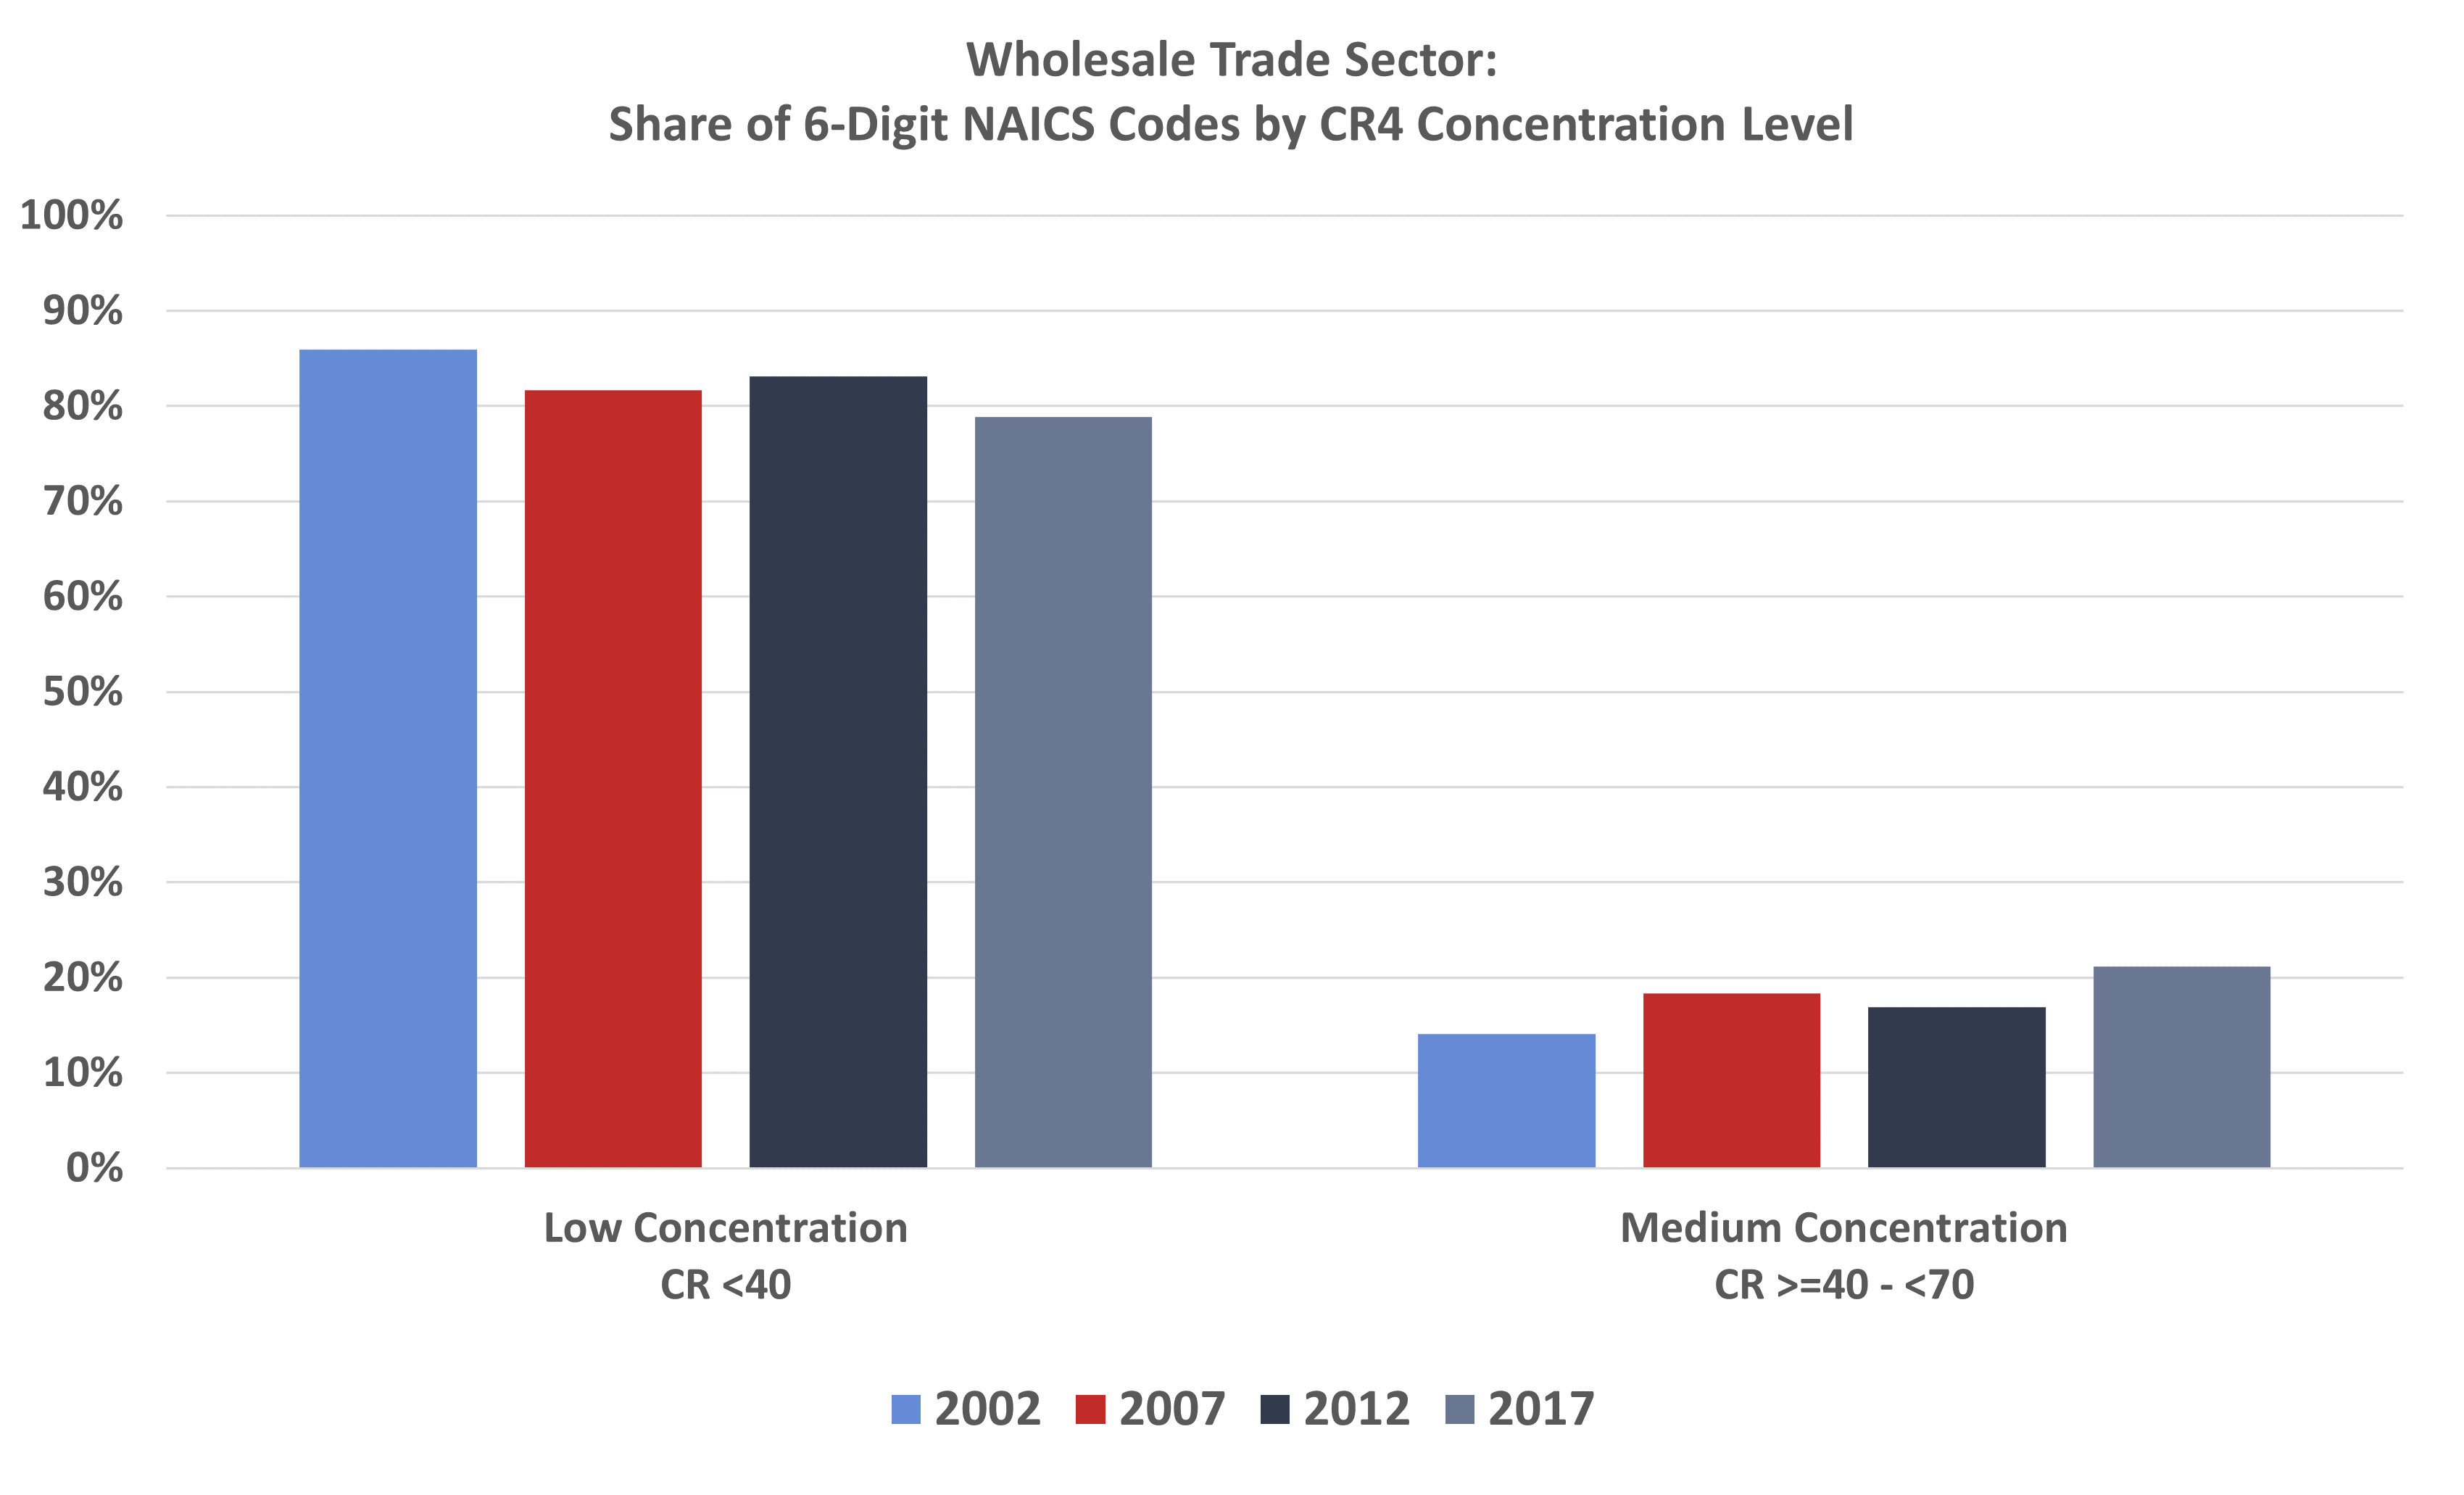
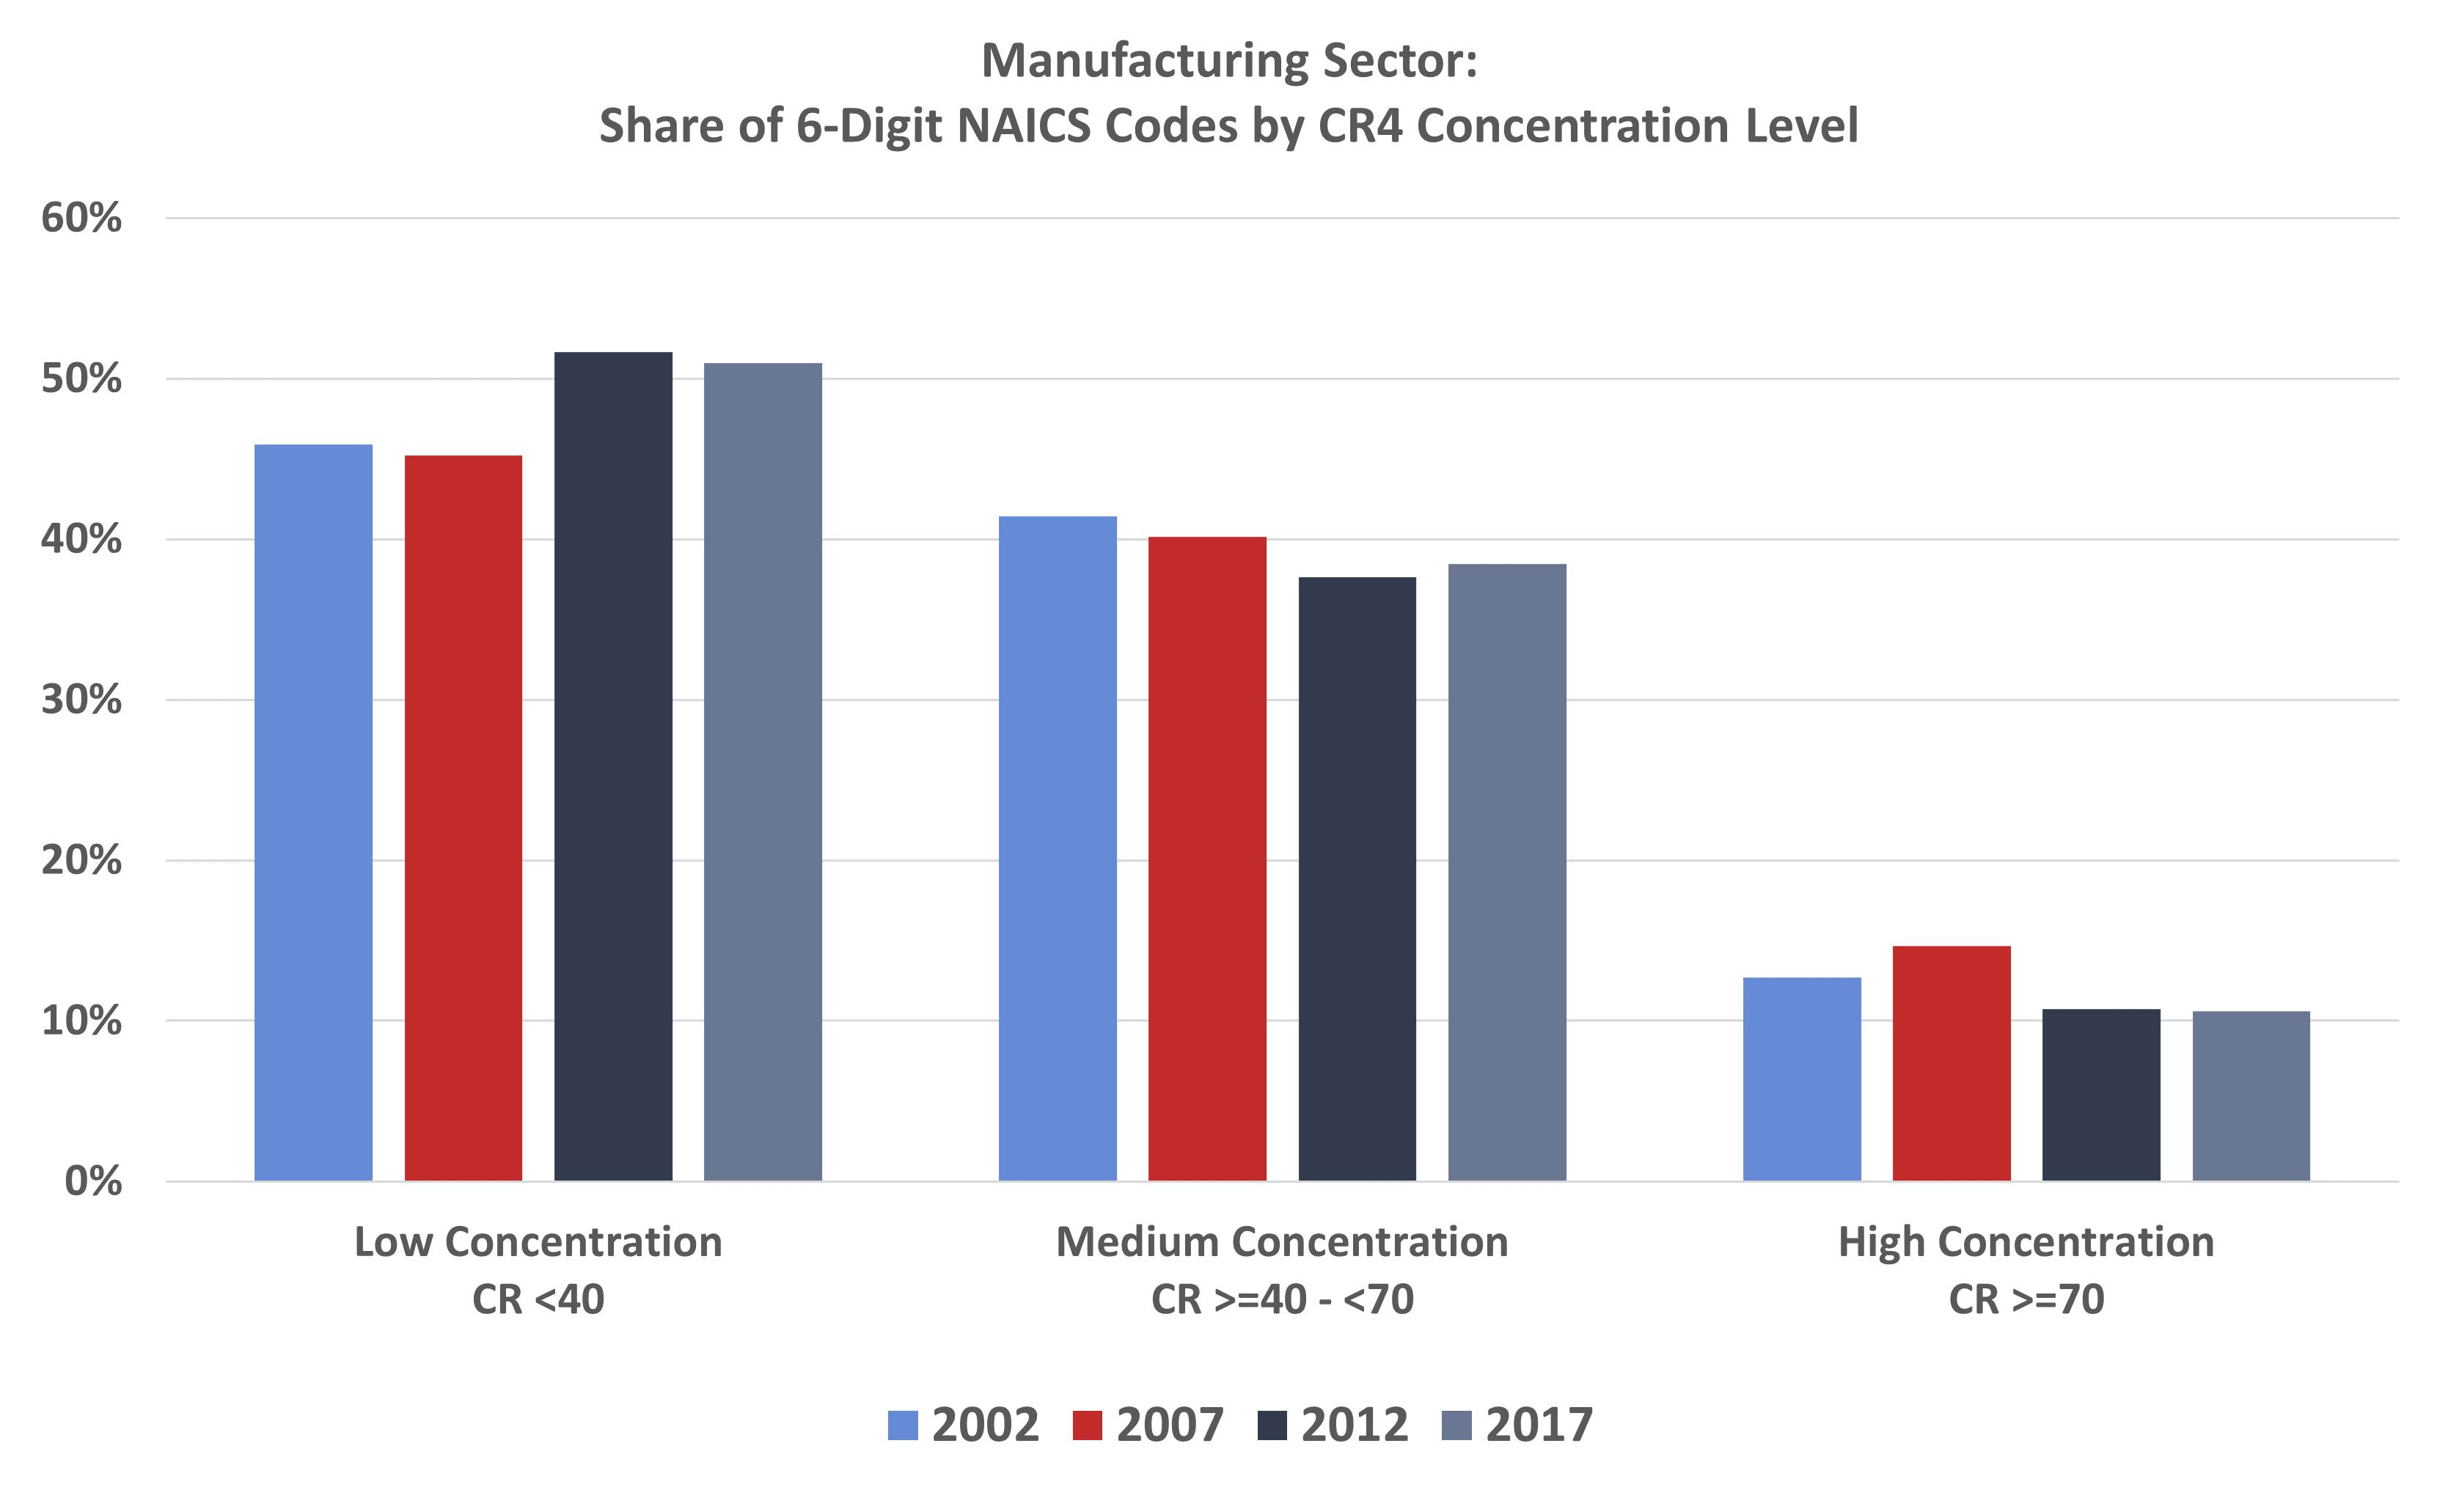
Market Concentration Levels by Sector
Is it possible that the use of broad averages across detailed industries masks increased concentration? To check this, this study shows that an analysis of each industry over time also fails to support the theory that markets have become more concentrated. The series of graphs below show the share of 6-digit NAICS code by concentration level for each overall industry (e.g., Information sector). The share of low, medium, and high levels of concentration remained relatively consistent over the 15-year span.
Conclusion
There is a lack of evidence to support the overarching claim that industries are becoming more concentrated and, if left unchecked, the largest firms will exert some level of monopolist power. In fact, the data from the Economic Census show that average concentration ratios have remained largely unchanged over the 15-year span and the share of highly concentrated firms remained muted.
While the definition of a “market” is undoubtedly fluid and unlikely to be captured perfectly by the NAICS definitions, these data show that competitive markets (low concentration) are the predominant landscape for most industries.
Appendix: Information About Data from the Economic Census
The Economic Census, published every five years by the U.S. Census Bureau, provides a comprehensive set of statistics to help understand the economy. Included in this publication are data measuring the share of industry sales for the four, eight, 20, and 50 largest firms in each industry. These shares are known as concentration ratios (denoted as CR4, CR8, CR20, and CR50).
The industries are categorized using the North American Industry Classification System (NAICS). NAICS groups businesses by their primary business activity, aggregates them into various levels of detail, and assigns them a numeric code. A 2-digit NAICS code is general sector (e.g., 22 – Utilities) while a 6-digit code is specific to an industry (e.g., 221115 – Wind Electric Power Generation).
While this set of data seems ideal for analyzing market concentration across industries, there are shortfalls that need to be considered.
CR data from the Economic Census are measured at the national level to ensure information about individual businesses is kept private. It is easy to imagine, however, that geographical information regarding sales would be useful in a market concentration analysis. For example, at a national level, health care and social assistance services have low market concentration using the CR4 methodology at the 6-digit NAICS level. But a rural area with just one hospital has a very concentrated market. Any sort of anticompetitive behavior on behalf of this hospital would almost certainly lead to lower levels of consumer welfare.
Another point to keep in mind is that the Economic Census measures domestic sales. Imports are excluded. While a concentration ratio may appear high, imports could be the main source of competition for a particular industry but are not considered when calculating concentration ratios.
An additional shortfall of the data set is that NAICS codes are updated every five years. While some industry classifications have remained consistent, others (most notably in the manufacturing sector) have changed. These changes to the NAICS codes could be in the form of a consolidation of multiple industry codes into one code, part(s) of a NAICS code is redistributed into another NAICS code(s), or in some cases, a combination of the two. This makes tracking individual 6-digit NAICS codes across time difficult. A good example of a change made to NAICS codes is in the Utility Sector between 2007 and 2012. In 2012, the 2007 6-digit NAICS code 221119 – “Other Electric Power Generation” was separated into five different NAICS codes to capture solar, wind, geothermal, biomass, and other electric power generation individually.
The analysis above uses the concentration level of the four largest firms at the 6-digit NAICS level and does not attempt to regroup NAICS codes to be consistent across time.
Choosing to analyze the four largest firms rather than eight, 20, or 50 helps better answer the question of whether there is oligopoly or even monopoly power in a specific industry. Widening the net makes answering that question more difficult.
The use of 6-digit NAICS codes provides the best, most specific measure of an industry. Trying to analyze market share using a less specific 4-digit NAICS code runs the risk of grouping firms serving different end markets. To use the Utilities sector as an example, NAICS code 2211 – “Electric Power Generation, Transmission, and Distribution” is a very broad category. NAICS code 22115 – “Wind Electric Power Generation” and 221121 – “Electric Bulk Power Transmission and Control,” while related and falling under the same 4-digit NAICS code, serve different markets.
[1] https://www.politico.com/news/2021/07/01/ftc-lina-khan-antitrust-chair-497764
[2] https://www.whitehouse.gov/briefing-room/presidential-actions/2021/07/09/executive-order-on-promoting-competition-in-the-american-economy/
[3] https://www.uschamber.com/assets/documents/Final-Industrial-Concentration-Paper.pdf
[4] https://itif.org/publications/2021/06/07/no-monopoly-has-not-grown
[5] https://www.cnbc.com/2022/01/18/ftc-doj-seek-to-rewrite-merger-guidelines.html
[6] https://www.census.gov/programs-surveys/economic-census/data/tables.html