


Testimony
March 27, 2019
A Preliminary Evaluation of the Tax Cuts and Jobs Act
United States House of Representatives Committee on Ways and Means
The views expressed here are my own and not those of the American Action Forum. I have benefitted enormously from numerous discussions with my colleague Gordon Gray. I thank Ben Gits and Tom Lee for their assistance.
Chairman Neal, Ranking Member Brady, and members of the Committee, thank you for the opportunity to discuss the impact of the Tax Cuts and Jobs Act (TCJA) now that it has been law for about 15 months. I believe it is important to frame any evaluation of the TCJA relative to the rationale for tax reform in the first place: the weak U.S. economic outlook. Having identified the “problem,” we should consider whether the major provisions of the TCJA addressed the deficiencies of the tax code, examine recent economic performance, and assess the degree to which this can be tied to the TCJA itself. Finally, it is important to discuss how best to evaluate more definitively in the future. As part of this assessment, I would like to make three points:
- The overriding rationale for the TCJA was the need for better incentives for long-term economic growth, improving disappointing wage growth and raising the growth of the standard of living for American families;
- The TCJA, while imperfect, addressed many of the most anti-growth elements of the old tax code; and
- S. economic performance has improved meaningfully since the passage of the TCJA, including objectives like top-line economic growth, business investment and wage growth. This is promising, but not definitive. At this juncture it is simply premature to pass judgement on the TCJA.
Let me discuss these in turn.
The Growth Challenge and Tax Reform
As of 2017, the need to support more rapid-trend economic growth was the preeminent policy challenge. The nation experienced a disappointing recovery from the most recent recession and was confronted with a future defined by weak long-term economic growth. Left unaddressed, this trajectory would leave to the next generation a less secure and less prosperous nation.
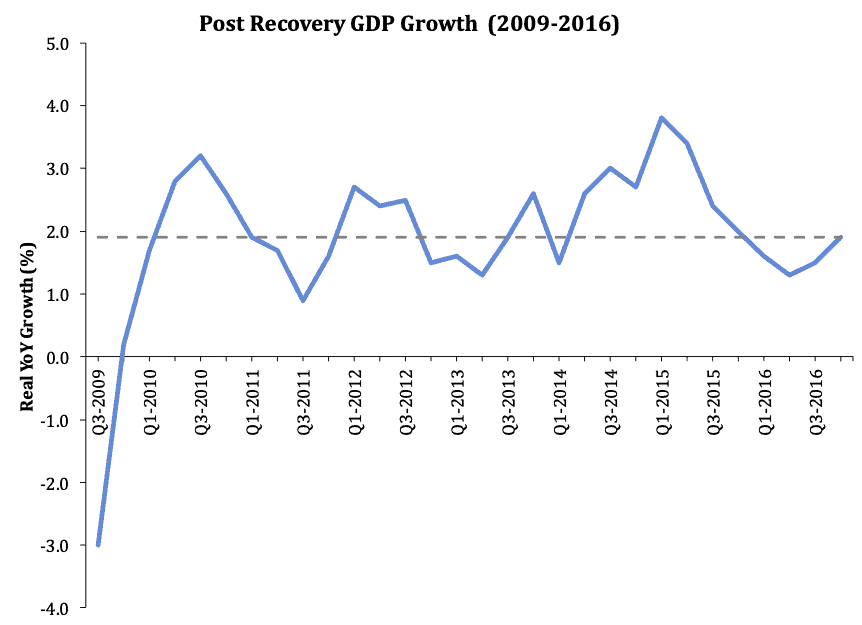
The figure below shows quarterly, year-over-year growth rates for real gross domestic product (GDP) beginning with the official end of the Great Recession in June of 2009. As shown, real GDP growth had been stubbornly weak, averaging 1.9 percent annually (the dotted line). While recoveries from recessions precipitated by financial crises tend to be weaker, the persistence of the nation’s weak economy should not have been considered inevitable, but rather as an encouragement to implement better economic policy.
A related shortcoming had been the growth in productivity (see below).
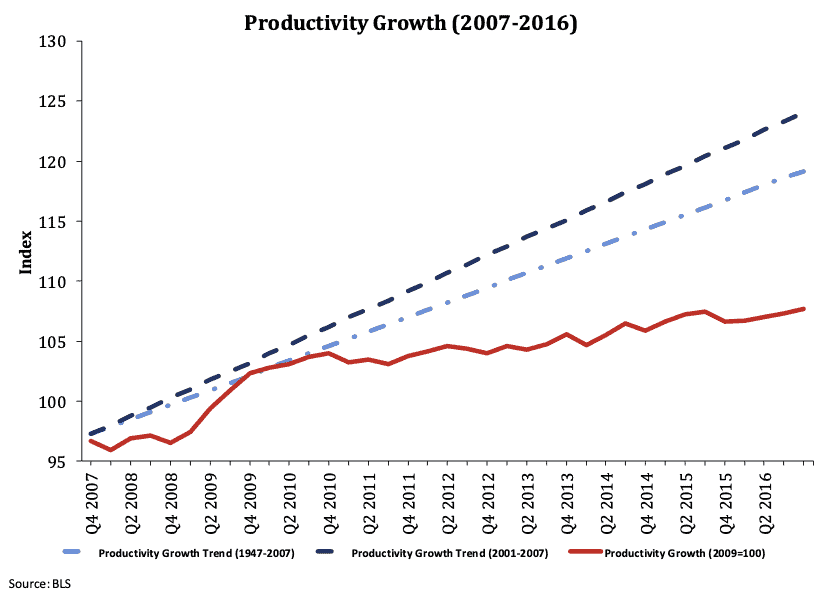
In recent years the actual growth in productivity had fallen below its recent trend (2001 to 2007) and far below the postwar average (1947 to 2007). [1] Accepting diminished productivity growth would mean being resigned to slow growth in real (inflation-adjusted) wages and labor incomes.
Household income, a metric that more working Americans can appreciate, underscores the tepid economic recovery. According to the U.S. Census Bureau, earnings growth of men and women who worked full-time and year-round was essentially zero in 2016.[2]
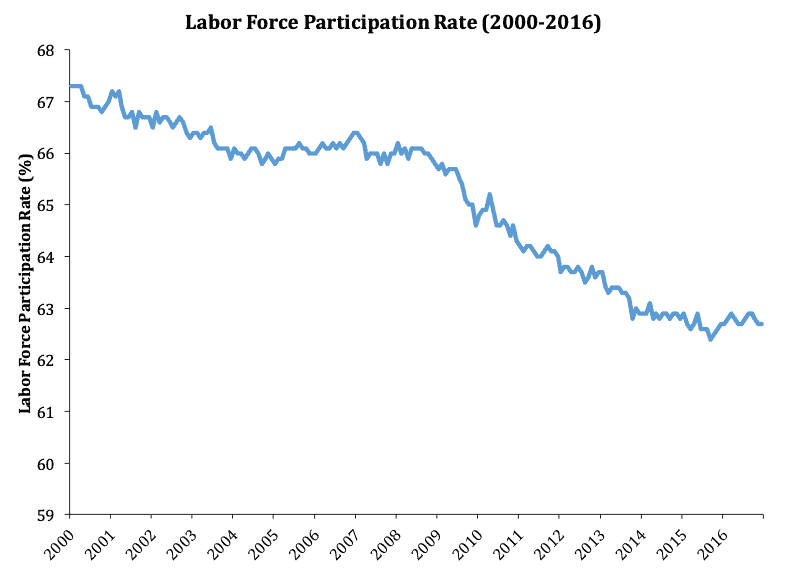
The final essential building block for stronger trend economic growth is growth in the labor force – the population willing and able to work. As a share of the population, the labor force had declined from historical highs in 2000, but this decline accelerated after the Great Recession.
Even more troubling than the poor recovery was the fact that the Congressional Budget Office (CBO) projected poor economic growth – averaging at best 2 percent per year – in the future. That rate of growth is certainly below that needed to improve the standard of living at the pace typically enjoyed in post-war America. During the early postwar period, from 1947 to 1969, trend economic growth rates were quite rapid. GDP and GDP per capita grew at rates of 4.0 percent and 2.4 percent, respectively. Over the subsequent 25 years, however, these rates fell to 2.9 percent and 1.9 percent, respectively. During the years 1986 to 2007, trend growth in GDP recovered to 3.2 percent, while trend GDP per capita growth rose to 2.0 percent.
These rates were quite close to the overall historic performance for the period. The lesson of these distinct periods is that the trend growth rate is far from a fixed, immutable economic law that dictates the pace of expansion, but rather is subject to outside influences – including public policy.
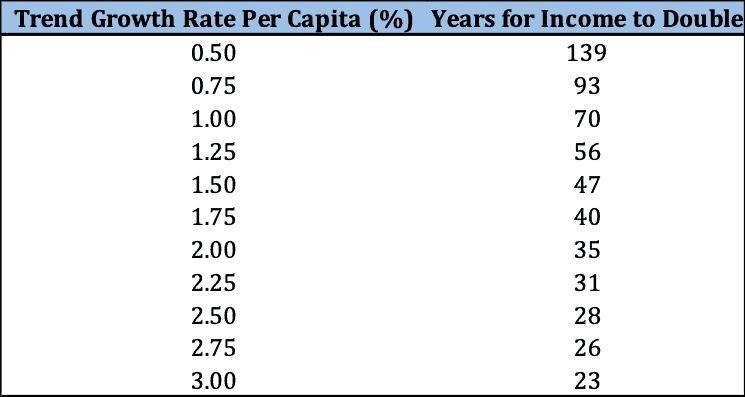
The trend growth rate of postwar GDP per capita (a rough measure of the standard of living) has been about 2.1 percent. As the table below indicates, at this pace of expansion an individual could expect the standard of living to double in 30 to 35 years. Put differently, during the course of one’s working career, the overall ability to support a family and pursue retirement would become twice as large.
In contrast, the long-term growth rate of GDP in the most recent CBO projection is 1.8 percent. When combined with population growth of 0.8 percent, this implies the trend growth in GDP per capita will average about 1.0 percent. At that pace of expansion, it will take 70 years to double income per person. The American Dream is disappearing over the horizon.
More rapid growth is not an abstract goal; faster growth is essential to the well-being of American families.
The Need for Tax Reform
Economic performance was not the only spur to tax reform. Prior to the enactment of the TCJA, the U.S. tax code was broadly viewed as broken and in need of repair, and for good reason.
International Competitiveness and Headquarter Decisions[3]
Prior to the enactment of the TCJA, the U.S. corporate tax code remained largely unchanged for decades, with the last major rate reduction passed by Congress in 1986.[4] During the interim, competitor nations made significant changes to their business tax systems by reducing tax rates and moving away from the taxation of worldwide income. Relative to other major economies, the United States went from being roughly on par with major trading partners to imposing the highest statutory rate of tax on corporation income. While less stark than the United States’s high statutory rate, the United States also imposed large effective rates. According to a study by PricewaterhouseCoopers, “companies headquartered in the United States faced an average effective tax rate of 27.7 percent compared to a rate of 19.5 percent for their foreign-headquartered counterparts. By country, U.S.-headquartered companies faced a higher worldwide effective tax rate than their counterparts headquartered in 53 of the 58 foreign countries.”[5]
The United States failed another competitiveness test in the design of its international tax system. The U.S. corporation income tax applied to the worldwide earnings of U.S. headquartered firms. U.S. companies paid U.S. income taxes on income earned both domestically and abroad, although the United States allows a foreign tax credit up to the U.S. tax liability for taxes paid to foreign governments. Active income earned in foreign countries was generally only subject to U.S. income tax once it was repatriated, giving an incentive for companies to reinvest earnings anywhere but in the United States. This system distorted the international behavior of U.S. firms and essentially trapped foreign earnings that might otherwise be repatriated back to the United States.
While the United States maintained an international tax system that disadvantaged U.S. firms competing abroad, many U.S. trading partners shifted toward territorial systems that exempt, either entirely or to a large degree, foreign-source income. Of the 34 economies in the Organisation for Economic Co-operation and Development, for example, 29 have adopted systems with some form of exemption or deduction for dividend income.[6]
One manifestation of the competitive disadvantage faced by U.S. corporations was decisions on the location of headquarters. The issue of so-called “inversions” remained at the forefront of tax policy and politics. Originally, tax inversions involved a single company flipping the roles of U.S. headquarters and foreign subsidiary — i.e. “inverting.” Tax changes in the early 2000s largely ended this practice. Next, whenever a U.S. firm sought to acquire or merge with a foreign firm, the tax advantages of being subjected to a lower rate and a territorial base made it inevitable that the combined firm would be headquartered outside the United States. In these cases, inversions took place in the context of these otherwise strategic and valued business opportunities. Most recently, foreign firms have recognized that freeing U.S. companies of their tax disadvantage allows foreign acquirers to use the same capital, technologies and workers more effectively. Inversions were occurring because foreign firms were acquiring U.S. firms.
A macroeconomic analysis of former House Ways and Means Chairman Camp’s tax reform proposal is instructive on the incentives inherent in the old tax code for capital flight. John Diamond and George Zodrow examined how reform similar to that proposed by former Chairman Camp would affect capital flows compared to pre-TCJA law.[7] In the long-run, the authors estimated that a reform that lowered corporate rates and moved to an internationally competitive divided-exemption system would increase U.S. holdings of firm-specific capital by 23.5 percent, while the net change in domestic ordinary capital would be a 5 percent increase. It is important to note that these are relative measurements – they were relative to current law at the time. If the spate of announcements of inversions in the years leading up to the enactment of the TCJA is any indication, the old tax code was inducing capital flight. Accordingly, the 23.5 percent and 5 percent increases in firm-specific and ordinary stock, respectively, may be interpreted in part as the effect of precluding future tax inversions.
Placing a value on this potential equity flight is uncertain, but based on these estimates, roughly 15 percent, or $876 billion in U.S.-based capital was estimated to be at risk of moving overseas under the old code.[8]
Finally, it is an important reminder that the burden of the corporate tax is borne by everyone. Corporations are not walled off from the broader economy, and neither are the taxes imposed on corporate income. Taxes on corporations fall on stockholders, employees, and consumers alike. The incidence of the corporate tax continues to be debated, but it is clear that the burden on labor must be acknowledged. A survey compiled by the president’s Council of Economic Advisers aptly summarizes the economics literature, and finds that while differing greatly, empirical estimates have been trending upwards over time, reflecting the dynamism of global capital flows that characterize the modern economy.[9] One study by economists at the American Enterprise Institute, for example, concluded that for every 1-percent increase in corporate tax rates, wages decrease by 1 percent.[10]
Flaws in the Individual Tax Code
As taxpayers rediscover every April, the U.S. code has been complex, confusing, costly to operate and comply with, and leaves taxpayers distrustful that everyone is paying the share Congress intended. In 2016, over 150 million individual tax returns were filed, covering over $10.2 trillion in income.[11] These returns also include millions of businesses that do not file as C corporations. As of 2012, there were 31.1 million non-farm businesses filing tax returns: 23.6 million sole-proprietors, 4.2 million S corporations, and 3.4 million partnerships (including limited liability companies). The Internal Revenue Service (IRS) also recognized 1.6 million C corporations.[12] The tax system is often the most direct interface between individuals and businesses and the federal government.
Unfortunately, that experience is often deeply unsatisfactory. The IRS has 1,186 forms with which taxpayers must contend and requires an average of 11.8 hours per paperwork submission. The overall burden on taxpayers is 8.1 billion hours in paperwork burden imposed by the tax collection system on taxpayers.[13]
As many Americans have experienced, the tax filing process is extremely time intensive and often requires the help of outside expertise. Tax compliance is so onerous for individual taxpayers, over 90 percent of individual taxpayers used a preparer or tax software to prepare their returns. The Taxpayer Advocate Service (TAS), the watchdog office within the IRS, has stated that complexity is the single most serious problem with the tax code. Fichtner and Feldman assessed the costs that the U.S. tax code extracts taxpayers through complexity and inefficiency. The study finds that, in addition to time and money expended in compliance, foregone economic growth, and lobbying expenditures amount to hidden costs are estimated to range from $215 billion to $987 billion.[14]
Recent Economic Developments
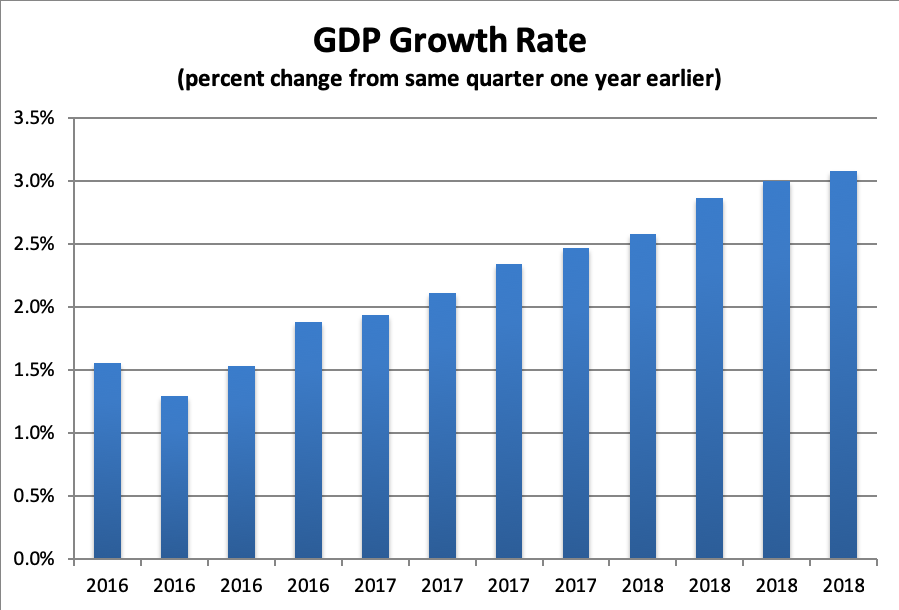
There has been a meaningful improvement in the pace of economic growth over the past two years. Let me begin with GDP growth, measured as the growth from the same quarter in the previous year. As shown below, year-over-year GDP growth has accelerated steadily from a low of 1.3 percent in the 2nd quarter of 2106 to a 3.1 percent in the 4th quarter of 2018.
An important source of this acceleration is an increase in the pace of business investment. Household spending growth (as measured by personal consumption expenditures) has been rising steadily and solidly between 2.4 percent and 2.9 percent year-over-year over this period. As shown in the chart below, however, non-residential fixed investment (“business fixed investment”) has grown much more rapidly since the start of 2017, and even faster (nearly 7 percent versus just over 5 percent annually) in the past year.

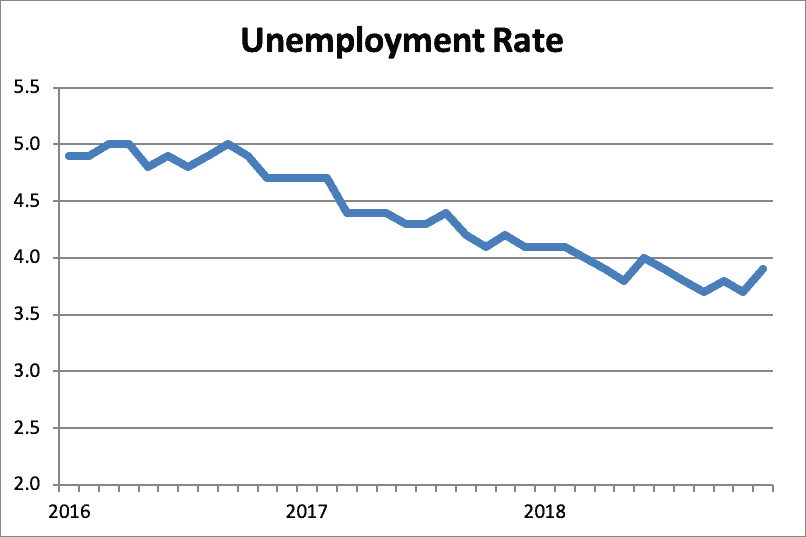
The more rapid growth in GDP has translated into a very strong labor market. After creating an average of 193,000 jobs monthly in 2016, it has averaged 201,000 new jobs in 2017 and 2018, accelerating to an average of 223,000 in 2018. This acceleration is an especially remarkable accomplishment this late in the expansion, when one might have expected the labor force participation and unemployment rates to stabilize.
Had that been the case, job growth would have averaged roughly 90,000 per month. Instead, the unemployment rate has plummeted sharply to below 4.0 percent (see below).
As the labor market continued to heat up, competition for workers has become more fierce and has led to rising wages and other compensation. The best measure of wage and non-wage compensation is the Employment Cost Index (ECI) from the Bureau of Labor Statistics (BLS). As can be seen in the chart below, wage growth in 2018 has been about 3 percent annually – higher than the same quarter in 2017 and up noticeably since prior to 2016.

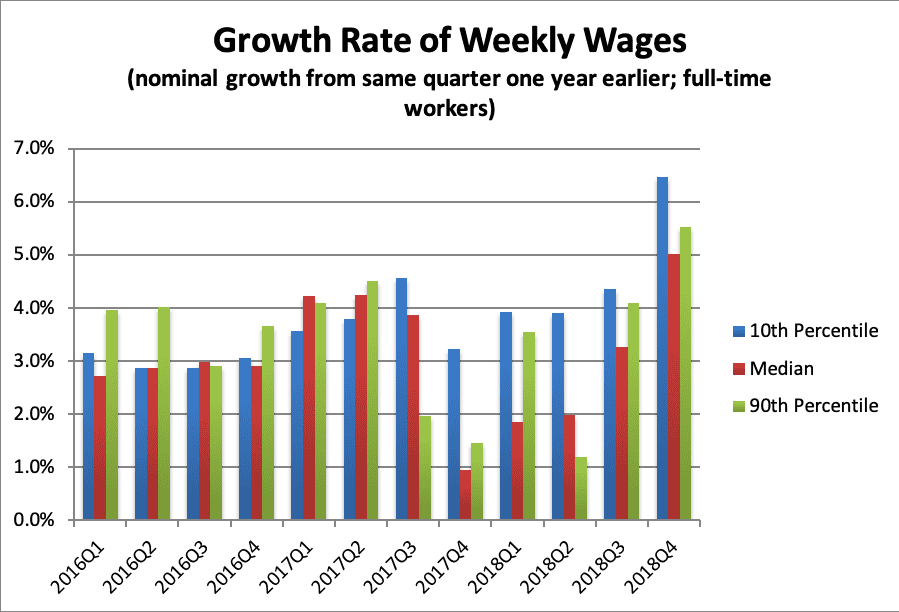
Moreover, wage gains have been widely shared. The BLS provide data on weekly earnings of full-time workers at a variety of points in the earnings distribution – the 10th percentile (low-paid workers), the 50th percentile or median, and the 90th percentile (highly paid workers). The year-over-year growth in these wages is displayed in the chart below.
Clearly nominal wages have been rising across the distribution. More important, however, wage increases have been the most rapid at the 10th percentile since the start of 2018.
Evaluating the TCJA
How much of the recent improvement in economic performance can be attributed to the TCJA? As a matter of economic science, it is certainly too soon to say, but there are good reasons to credit the new law.
The TCJA addressed some of the most glaring flaws in the business tax code. It lowered the corporation income tax rate to a more globally competitive 21 percent, enhanced incentives to investment in equipment, addressed some of the disparate tax treatment between debt and equity, and refashioned the nation’s international tax regime. Primarily for these reasons, the TCJA will enhance incentives for business investment in the United States.
A simple way to measure this effect is shown in the chart below. The red line shows the contribution (in percentage points) of business investment to growth in GDP, as measured by a 4-quarter moving average. The clear need is for investment to surge and push up both the growth rate of the economy and investment’s contribution to that growth.
How can we see if that is coming? The blue line shows a 4-quarter moving average of new orders for capital goods, which fairly closely tracks the investment.
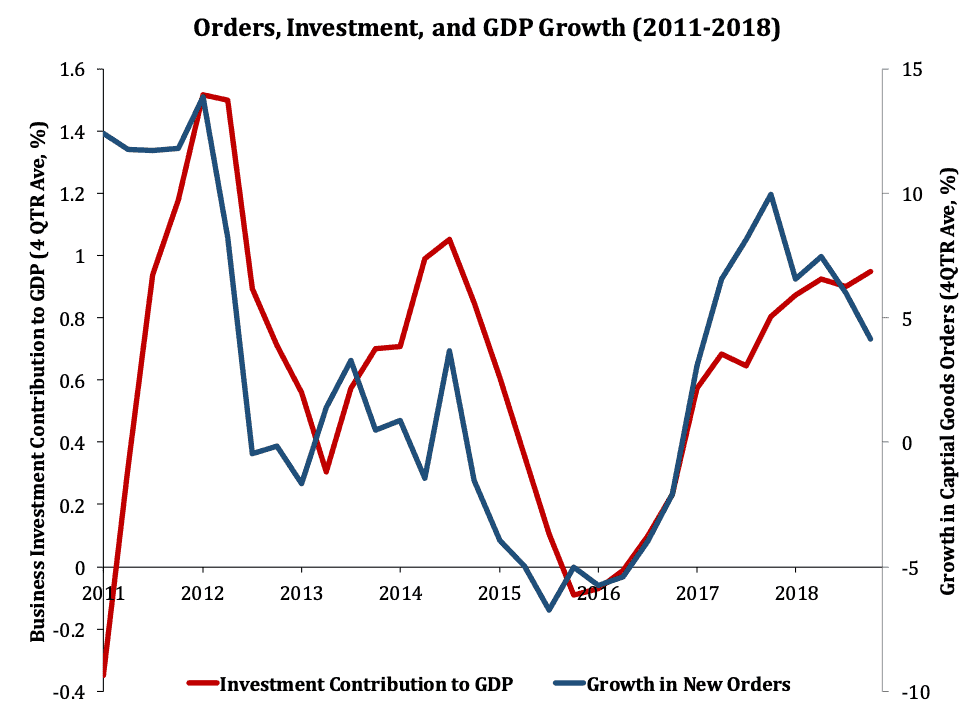
It remains too early to evaluate completely the degree to which the TCJA is boosting investment, but there are clearly some promising indicators. Since the beginning of the current recovery and prior to the enactment of the TCJA, the average contribution of real business fixed investment to GDP growth was 0.6 percentage points. But in the first four quarters after the TCJA’s passage, the contribution of real business fixed investment to GDP growth rose to about 0.95 percentage points. According to the Economic Report of the President, overall private nonresidential fixed investment was up $150 billion (5.8 percent) over recent trends since the enactment of the TCJA trend through the third quarter of 2018.[15] Among nonfinancial businesses, overall capital expenditures were up 12.1 percent over recent trends. According to a research report compiled by Morgan Stanley and Co., plans for future capital expenditures reached “an all-time high” not long after the enactment of the TCJA.[16] This index was ticking up prior to the TCJA enactment and has moderated somewhat since, so its implications should not be overstated, but this is an indicator to monitor for trends in investment behavior subsequent to the TCJA’s enactment. There is also a burgeoning literature on the TCJA’s economic effects, aptly summarized in the most recent Economic Report of the President. One study by Karel Mertens of the Dallas Federal Reserve finds that the cumulative effect on GDP between 2018 and 2020 of individual tax reform to be 0.5 percent, and the cumulative effect of business tax reform to be 1.9 percent.[17]
What is not a meaningful indicator for the TCJA’s effect on investment are stock buybacks. The news is filled with reports that the TCJA has spawned “share buybacks” – corporations purchasing their own stock – and opponents of the law have characterized this as evidence of failed policy. A little reflection, however, indicates that share buybacks tell you essentially nothing about the success of the TCJA.
As noted above, investment is the channel through which the TCJA will most meaningfully improve the U.S. economic growth outlook and standards of living. Critics argue that share buybacks are not investment in new inventions, new business models, or new equipment. Similarly, they are not higher wages for workers. Taken to its logical conclusion, this view regards share buybacks as a reflection of policy failure.
This reasoning is incomplete. When firms repurchase their stock, the dollars they pay do not disappear into a black hole. The sellers could easily turn around and invest themselves. Indeed, only about a fifth of corporate-source earnings are distributed to taxable entities, which means the vast majority of those earnings are going to things like pension funds, whose incentive is to channel the dollars to the place with the highest return – those firms doing the best investment in inventions, business models, and equipment. This is precisely how markets should channel capital for productive investment.
In fact, there could be many more intermediaries and many, many links in the investment chain. The bottom line is that success or failure is measured by the final transaction in that chain, not the first. As long as investment in the economy as a whole rises, the TCJA will have done its job.
As an aside, it is probably a good thing when there are share buybacks. They suggest that the firm has little in the way of high-return investments to make. It is far better to avoid having the dollars trapped in a low-return firm and instead have them flow through financial markets to the best investment opportunities.
Conclusion
Prior to the enactment of the TCJA, the U.S. tax code hadn’t been overhauled in over 30 years. The tax code was widely viewed as broken – a conspicuous drag on the economy that chased U.S. firms overseas while suppressing investment here at home. Major elements of the TCJA, particularly the lower corporate tax rate, expensing of qualified equipment, and the broad architecture of the international reforms, should improve the investment climate in the United States.
Notes
[1] https://www.americanactionforum.org/research/does-compensation-lag-behind-productivity/; Also see https://www.bls.gov/opub/btn/volume-6/below-trend-the-us-productivity-slowdown-since-the-great-recession.htm on which figure 2 is based
[2] https://www.census.gov/library/publications/2017/demo/p60-259.html
[3] See: https://waysandmeans.house.gov/wp-content/uploads/2016/05/20160525TP-Testimony-Holtz-Eakin.pdf
[4] https://www.americanactionforum.org/research/economic-and-budgetary-consequences-of-pro-growth-tax-modernization
[5] PricewaterhouseCoopers (2011). Global Effective Tax Rates. Washington, DC
[6] https://taxfoundation.org/territorial-tax-system-oecd-review/
[7] http://businessroundtable.org/sites/default/files/reports/Diamond-Zodrow%20Analysis%20for%20Business%20Roundtable_Final%20for%20Release.pdf
[8] https://www.americanactionforum.org/research/economic-risks-proposed-anti-inversion-policy-update/
[9] https://www.whitehouse.gov/sites/whitehouse.gov/files/documents/Tax%20Reform%20and%20Wages.pdf
[10] Kevin A. Hassett and Aparna Mathur, “Taxes and Wages,” American Enterprise Institute Working Paper No. 128, June 2006.
[11] https://www.irs.gov/statistics/soi-tax-stats-individual-income-tax-returns-publication-1304-complete-report#_pt1
[12] https://www.jct.gov/publications.html?func=startdown&id=4903
[13] https://www.americanactionforum.org/research/tax-day-2018-compliance-costs-approach-200-billion/
[14] Fichtner, Jason J. and Jacob M. Feldman, “The Hidden Costs Of Tax Compliance.” Mercatus Center 2015 Web. http://mercatus.org/sites/default/files/Fichtner-Hidden-Cost-ch1-web.pdf
[15] https://www.whitehouse.gov/wp-content/uploads/2019/03/ERP-2019.pdf
[16] http://www.taxanalysts.org/content/economic-report-gives-white-house-support-tax-cut-prediction
[17] Mertens, K. 2018. The Near-Term Growth Impact of the Tax Cuts and Jobs Act. Research Department Working Paper 1803. Dallas: Federal Reserve Bank of Dallas.
