


Testimony
June 4, 2020
Infrastructure and the Response to the Economic Impacts of COVID-19
United States Senate Committee on Environment and Public Works
*The views expressed here are my own and not those of the American Action Forum. I thank Gordon Gray and Thomas Wade for their insight and assistance.
Chairman Barasso, Ranking Member Carper, and members of the Committee, thank you for the privilege of appearing today to share my views on infrastructure investment and the response to the economic impact of the COVID-19 pandemic. I wish to make three main points:
- The economic fallout of the pandemic is staggering and unprecedented in our lifetimes;
- Most forecasters anticipate that the economy will quickly recover a substantial fraction of the lost jobs and income, but that full recovery will take years to achieve; and
- To the extent that infrastructure is included as part of the response to the COVID-19 pandemic recession, it should be part of a patient strategy to bolster the supply capacity of the economy over the medium to longer term.
Let me discuss these in turn.
The Impact of the COVID-19 Pandemic on the Economy
The macroeconomic impact of the COVID-19 pandemic far exceeds any experience in our lifetimes. Essentially all the major leading economic indicators have seen historic declines, wiping out the hard-won gains from the longest recovery in U.S. history.
Recent Economic Trends
Prior to the pandemic, there had been a meaningful improvement in the persistence of healthy economic growth over the past three years. Gross domestic product (GDP) growth, measured as the growth from the same quarter in the previous year, accelerated steadily from a low of 1.3 percent in the 2nd quarter of 2106 to a recent peak of 3.2 percent in the 2nd quarter of 2018. Of note, throughout this period GDP growth remained above the 1.8 percent growth rate that prevailed throughout the balance of the recovery.

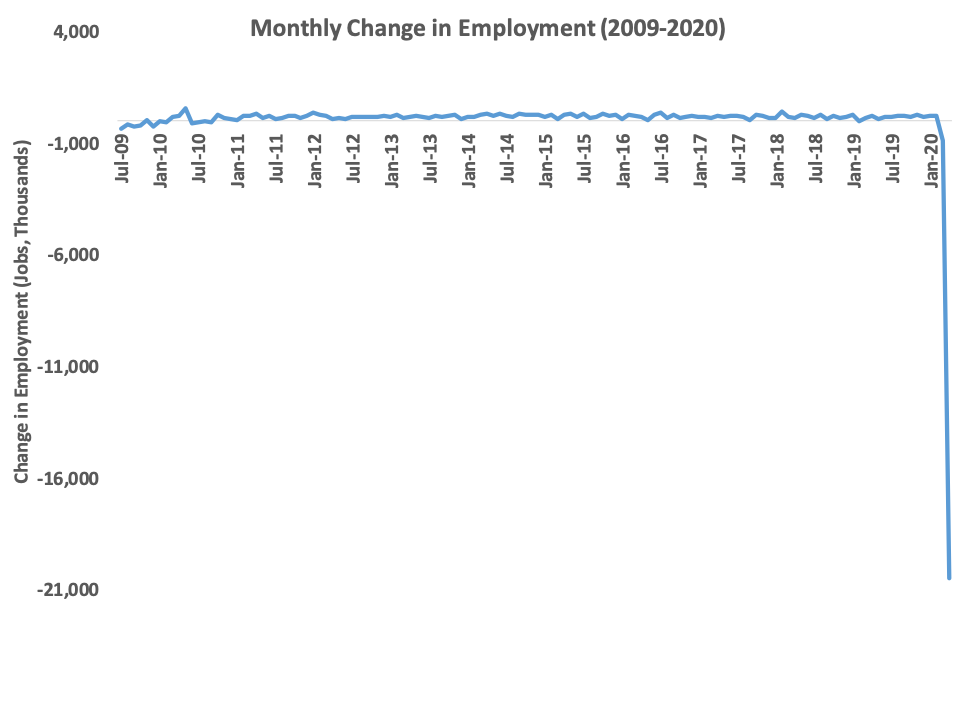
In June of 2009, the United States began the economic recovery from the Great Recession. What followed was nearly 11 years – the longest expansion in U.S. history – of steady if modest economic growth. Over that period, nearly 22 million jobs were created. Remarkably, the pace of job creation accelerated over the course of the recovery. Over the first half of the recovery, monthly job creation averaged 138,000; this increased to 198,000 new jobs created per month over the latter half of the recovery.
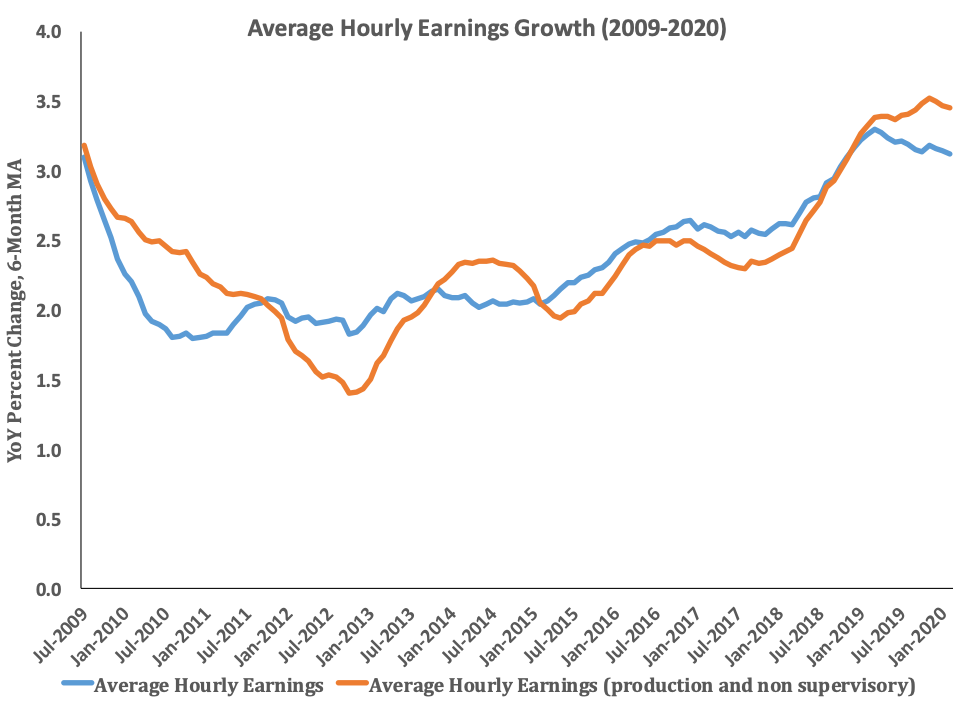
With higher growth and tighter labor markets, unemployment continued to fall as payroll and wage growth accelerated. Wage growth improved for all workers, including for non-supervisory workers. Indeed, from December 2018 onward, growth in hourly earnings (on a yearly moving average) for production and nonsupervisory workers outpaced that of workers overall every month.
The economic story of the recent past is the realization of years of modest growth finally beginning to accrue to individuals and families, broadly raising the standard of living. Recent accelerations in that growth punctuated a return to prosperity. That all came apart in March of 2020.
The Economic Impact of the COVID-19 Pandemic
The COVID-19 pandemic precipitated a historic shuttering of the economy in March, guaranteeing that the broadest measure of economic wellbeing – real quarterly GDP growth – would reflect some of the devastation in the first quarter. Indeed, the Bureau of Economic Analysis’s (BEA) estimate for the decline in first quarter GDP is 5.0 percent on an annualized basis. This is the single largest drop in real GDP since 2008. While any contraction, particularly one on the order of magnitude with those observed during the Great Recession, is troubling, in this instance the contraction reflects only the leading edge of the economic devastation.
Higher-frequency data reveal a historically devasted economy. Payrolls in April fell by 20.5 million, with private sector payrolls shedding 19.5 million jobs. The service sector lost over 17 million jobs. The leisure and hospitality industry was particularly devastated, losing over 7.6 million jobs. Goods-producing industries saw a decline of over 2 million. Government shed 980,000 jobs. No industry saw net positive hiring.
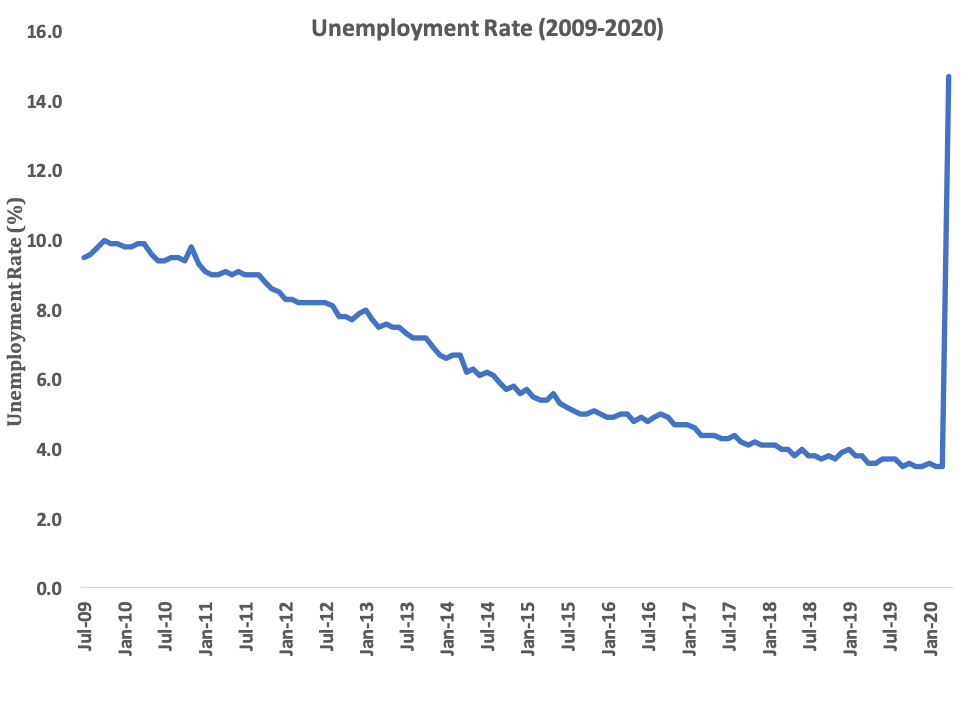
The unemployment rate jumped to 14.7 percent, which exceeds the highest level since the Great Depression. As BLS notes, were it not for the classification of some workers as employed but “Absent for other reasons,” this number would be on the order of 5 percentage points higher.
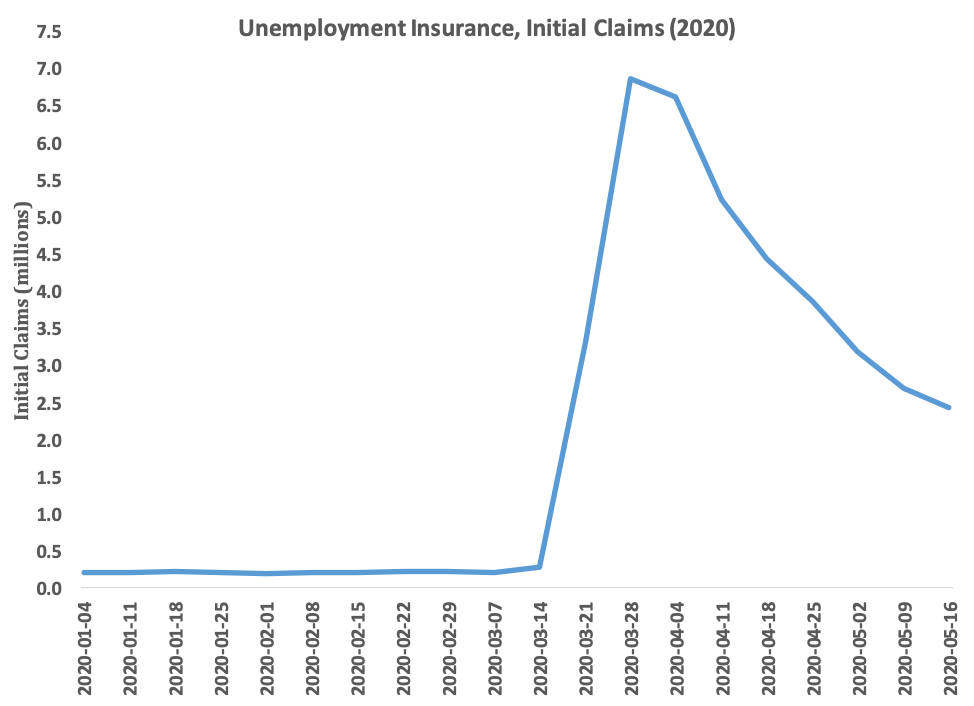
More frequent data still – weekly unemployment insurance (UI) claims – tell a similar story. Before March of this year, the single highest weekly initial claims report was 695,000 in 1982. No week in recorded U.S. history saw millions of Americans claiming unemployment insurance benefits. In the present environment, new UI claimants can only be measured in the millions.
In short, April job losses are 10 times larger than any previous month’s job losses. The April rise in the unemployment rate is 10 times larger than the previous one-month increase. The 6 million new claims for unemployment insurance in one week is 10 times larger than the previous one-week increase. The outlook for the 2nd quarter of 2020 is that GDP will decline by 11 percent; in the worst year (1932) of the Great Depression, the decline was 12 percent. The U.S. economy is enveloped in an economic downdraft of unprecedented magnitude.
The Policy Response to Date
In light of the size of the problem, it is appropriate that the policy response has been unprecedentedly large as well. In addition, the mechanism of the downturn differs significantly from earlier episodes such as the Great Recession or Great Depression; this dictates a different character to the policy response.
At the onset, the U.S. economy suffered from massive, cascading cash-flow crunches. With the arrival of the virus, large swaths of the economy – airlines, hotels, entertainment, restaurants, and so forth – overnight lost their customers and revenue. Businesses and households started selling everything they could to raise cash and hang on. The mass sell-off buffeted financial markets. The Federal Reserve (Fed) has done a sterling job of minimizing the turbulence. It reduced its policy rate to zero and announced an open-ended, unlimited buying spree. As the Fed put it, “The Federal Open Market Committee (FOMC) will purchase Treasury securities and agency mortgage-backed securities in the amounts needed to support smooth market functioning and effective transmission of monetary policy to broader financial conditions and the economy” (emphasis added).
The Fed revived two programs from the financial crisis and created two new facilities to extend credit to large employers via the purchase of corporate debt. It also revived an emergency lending vehicle last used in the 2007-08 crisis to support small businesses and consumers by encouraging investors to buy securitized student debt, auto debt, and credit-card debt.
These actions were effective in restoring normal function to financial markets and prevented an economic crisis in the real, Main Street economy from transforming into a financial crisis as well. As part of this effort, the Fed set up a variety of emergency lending facilities for financial market participants. Banks, in particular, and financial markets, in general, continue to perform effectively.
But not everyone could raise enough cash selling assets. Instead, businesses laid off workers and cut off suppliers. These moves effectively shifted the cash-flow crunch onto other firms or U.S. households.
The Coronavirus Aid, Relief, and Economic Security (CARES) Act provided a crucial offset to the household and business cash-flow crisis. It provided businesses with grants or loans on the condition that they not lay anybody off. The grants and loans would keep the businesses intact; the continued payroll would keep workers and their families intact. The basic economic task is to use the enormous borrowing power enabled by the U.S. taxpayer to raise trillions of dollars and then pour this cash into a variety of “funnels” leading to firms and households. This is simply bridge financing of otherwise economically sound businesses.
Of course, there has already been a lot of damage – and that damage continues to rise – that government support for America’s small and large businesses could not avert. As a result CARES (along with the Families First Act) contained an aggressive effort to help those who are unemployed, sick, or forced to stay away from work to care for others in the form of cash, unemployment insurance, and paid sick leave.
This response appears to be highly successful. In the report on Personal Income and Outlays from the Bureau of Economic Analysis, disposable personal income rose by $2.1 trillion (at an annual rate) or 12.9 percent, largely because government social benefits rose by $3.0 trillion. Moreover, personal saving rose by $4.0 trillion, indiciating the capacity to sustain standards of living over subsequent months.
Another success is the Paycheck Protection Program (PPP) as administered by the Small Business Administration (SBA) with the assistance of Treasury. The SBA has supported over $500 billion in lending to small businesses impacted by the pandemic. The PPP has proven so enormously popular and necessary as to require available funding to be increased after the CARES Act was signed into law. The program has justifiably come under some criticism, and in particular many questions remain outstanding as to the format and nature of loan forgiveness. Despite these flaws, I have stated that the PPP is the best part of the CARES Act. The SBA has facilitated the largest single support for the economy for the month of April. That such enormous sums were distributed to businesses in need at all, let alone so quickly, remains extraordinary.
The jury remains out on the effectiveness of the CARES Act lending to larger businesses. The Act provides for $500 billion in financial assistance to eligible businesses, states, municipalities, and tribes as emergency relief for losses related to the ongoing coronavirus pandemic. Only $1.8 billion, however, has been spent as of the date of this testimony, two months after the CARES Act passed into law.
The Economic Outlook
The Congressional Budget Office (CBO) typically updates its economic forecast twice yearly – once in January and once in August. Before the pandemic, CBO’s baseline was keyed off of an economic forecast entirely abstracted from the effects of the pandemic, built on an assumption of real GDP growth in 2020 of 2.2 percent, an unemployment rate of 3.5 percent, and slowly rising interest rates. This was a fairly mainstream forecast for the year, but to perform accurate cost-estimating CBO had to essentially update their forecast on the fly, and it is to their credit that they did so.
The new economic forecast reflects a similar outlook to other major post-COVID-19 analyses – a sharp uptick in economic activity in the third quarter of 2020 that only partially restores the economic gains of the past several years. GDP is expected to fall 11 percent in the 2nd quarter, or 38 percent at an annual rate.
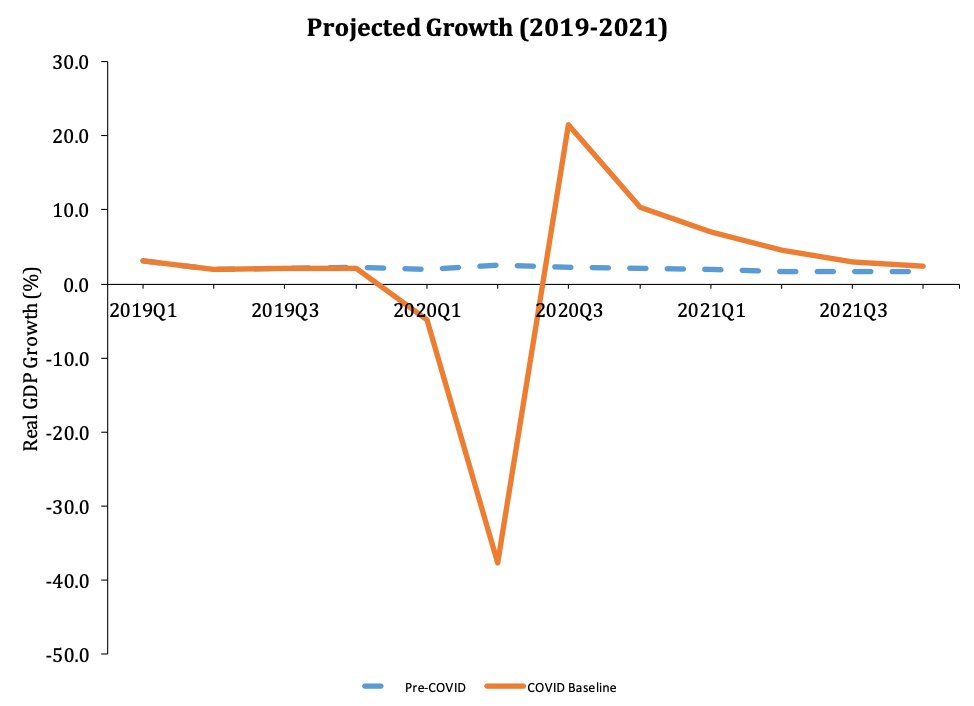
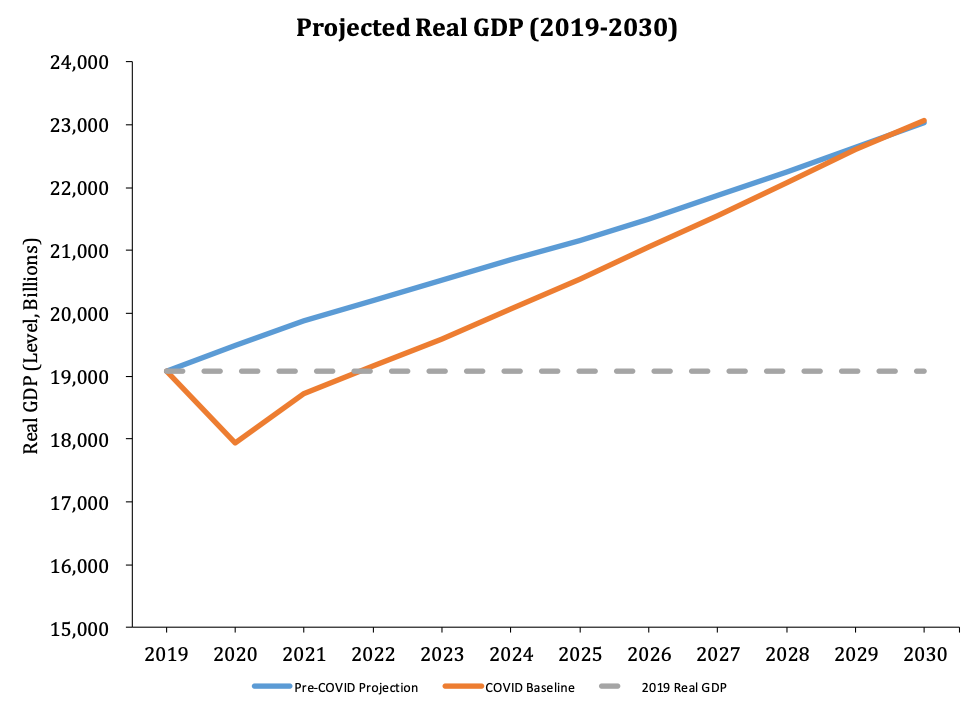
For the entire year 2020, GDP will be down 5.6 percent as every component of spending declined except federal government purchases. By contrast, in 2021 every component will rebound except for federal purchases. The CBO sees growth at a rate of 4.2 percent in 2021. What this means is that despite a sharp, expected return to growth in Q3 of 2020, the scale of the prior contraction is such that CBO does not forecast the level of real GDP returning to pre-crisis levels until 2022.
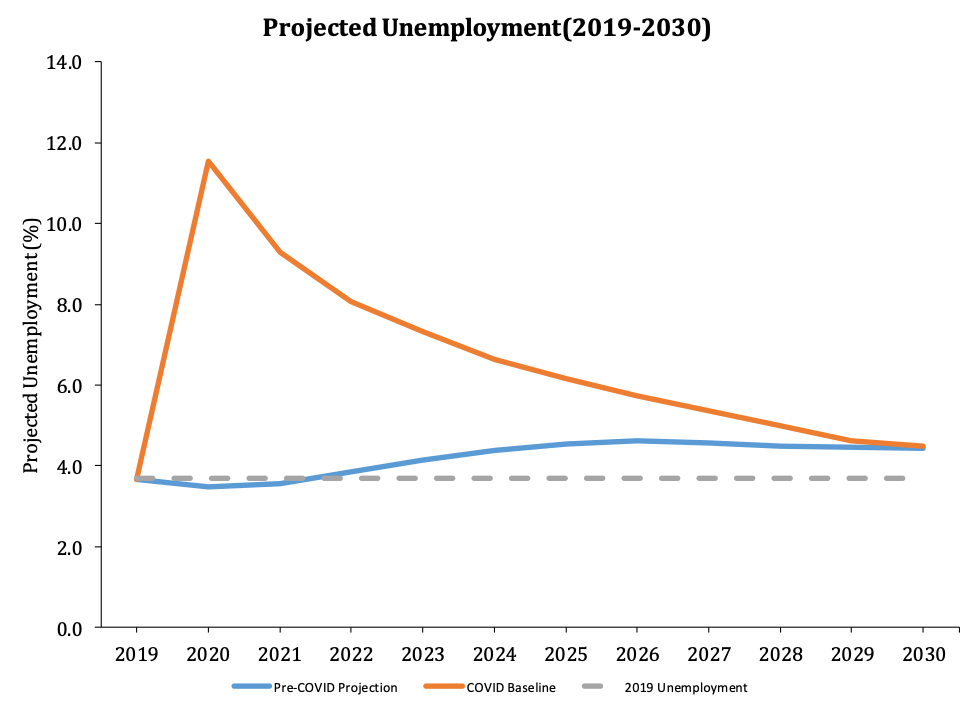
The unemployment rate will top out at 15.8 percent in the 3rd quarter of 2020 but remain an elevated 8.6 percent as far out as the 4th quarter of 2021. Because CBO projected gradual increases in unemployment, under CBO’s forecast, unemployment never returns to the historic lows witnessed prior to the outbreak of the pandemic.
The implications of the current and projected losses associated with the COVID pandemic are highly consequential for federal policy. The CARES Act stands as the single largest fiscal intervention in U.S. history, an appropriate response to a historic challenge. Continual monitoring of the economic indicators – weekly, monthly, quarterly, annually – will continue to inform Congress on the direction and tenor of the recovery, and policymakers should tailor policies accordingly.
Implications for Infrastructure Investment
The theory undergirding the case for a v-shaped recovery from the COVID-19-induced downturn is pretty simple. It assumes that firms, either from their own sources or via the vast amount of federal support, have enough liquidity to stay in business until the economy re-opens. At that point, a commerce-starved public steps up to start buying, labor-starved businesses quickly hire, and Americans happily head back to their jobs. The various programs in the CARES Act were designed to address the cash-flow needs for this evolution of the economy.
A key part of this logic is that it simply involves recovery – restarting what was there before – and not restructuring. That almost certainly will not be the case. Transportation services, hotels and other accommodations, performing arts, amusements and gambling, and eating and drinking places account for about 5 percent of GDP and 11 percent of employment (at the end of 2019). In these industries the 2020 problem (and perhaps beyond) is not liquidity; their business models are no longer uniformly viable. There will be firms in these industries that will transform from illiquid to simply insolvent. This is among the factors that will slow the pace of the recovery and prevent an immediate rebound to levels of activity present in January and February.
The changing economic landscape also means that the policy design should change as well. It does not make sense to put taxpayer dollars into companies that market forces may eliminate. Over the next few months, the emphasis should shift from speedy, indiscriminate lending and grants to targeted lending programs where needed. Policy should also shift its focus away from keeping workers attached to their firms and toward supporting shifts in the demand for workers as some industries shrink and others expand.
Strong policy support will be an important element of recovering from the COVID-19 recession. But it will have to be more nimble than simply repeating CARES.
In addition, policy should anticipate the need to support supply-side issues. The virus itself may continue to generate headwinds, regional lockdowns, and other supply disruptions. And the need to modify workplaces to ensure safe operation in the presence of the coronavirus will raise the cost of doing business and slow the pace of recovery.
This is where infrastructure investment can be of direct assistance to the recovery. As noted above, the CBO projection anticipates elevated levels of unemployment through 2021. A well-designed infrastructure effort can begin to provide economic benefits at roughly this point in the recovery.
I encourage Congress to take a disciplined approach. First, any infrastructure policy should be something that cannot, or will not, be provided by the private sector alone. From a (literally) textbook viewpoint, there is infrastructure that is valuable to production that has some combination of two characteristics: (1) it is jointly consumed; (2) it is not possible to exclude people or firms from using it. (Technically, these kinds of goods have the label “public goods.” See Chapter 4 of Rosen and Gayer.)
One truck driving on a highway does not stop another from doing so as well; both “consume” the highway at the same time without diminishing the other. (Notice the same is not true of the diesel fuel they use; that is a private good.) The same is true of airports and the air traffic control system. Or the broadband backbone. Non-excludable means you can’t stop someone from using the infrastructure, making it quite difficult to charge for its use. Neither characteristic is absolute, and they change with technology and market conditions. But the more something is shared in use and difficult to charge for, the better candidate it is for genuinely being public infrastructure.
Second, it should be tied as directly as possible to better economic performance. The prime imperative is to improve efficiency and reduce the costs of the national supply chain. The economy has already weathered severe supply shocks, and one can anticipate more in the pandemic’s future. And responding to the pandemic will raise the costs of doing business. It is important to use policy to offset these changes to the extent possible. Better connectivity across ports, railroads, airports, trucking, and other parts of the economy will improve efficiency. Those impacts are direct and immediate; they are the best candidates for infrastructure spending.
A third criteria is to prioritize those that are national (or regional) in scope. The federal government solves national problems; it should be first and foremost focused on improving national connectivity in transportation and the like. Projects that are metropolitan in scope should have lesser priority and be the responsibility of states and localities. The federal government might also be involved in financing such projects, but in doing so it should demand serious analysis that these projects generate quality results.
It is also important to set expectations appropriately about what infrastructure spending will and will not accomplish. Infrastructure should not be about “stimulus.” The most important aspect of projected recoveries for the U.S. economy is not the growth rate in the latter half of 2020. The most important feature is that even those forecasts that anticipate rapid growth in the 3rd and 4th quarters still have the level of economic activity at the end of 2021 below that at the beginning of 2020.
Infrastructure projects are long-lived. They provide long-lived benefits that have nothing to do with the near-term pace of growth and should be planned and implemented independent of it as well. As it turns out, few projects are genuinely “shovel-ready,” and the history of using public-works spending as a tool of “stimulus” is replete with failure.
What does this say about current legislative proposals? Consider, for example, the America’s Transportation Infrastructure Act (ATIA). It fits nicely into the framework. It is focused on surface transportation, a key part of the supply chain. It uses existing state programs, thus reducing costly start-up issues associated with new programs. And it makes no attempt to front-load or otherwise force spending to occur too quickly.
That is consistent with the evidence on the contribution to productivity from infrastructure, which suggests that policymakers should be modest in their expectations for a new infrastructure initiative to quickly remake the economic outlook.
The modern literature on the productivity impacts of public infrastructure was spawned by the work of David Aschauer [1989]. In effect, he assumed that GDP is produced by combining the usual inputs – private-sector capital and labor – and inputs of public-sector capital. For the United States, he concluded that infrastructure had a very strong positive effect on private-sector productivity – stronger than the impact of private-sector capital. His specific estimate indicated that a 10 percent rise in the public-sector capital stock would raise the level of productivity by 3.9 percentage points. Put differently, the so-called “elasticity” of productivity with respect to public capital is 0.39. If productivity impacts are as large as the Aschauer results implied, federal infrastructure outlays would have a lasting impact on the path of real GDP, personal incomes, and the federal budget.
Unfortunately, the Aschauer finding does not hold up. In 1994, my own research showed that Aschauer’s result was an example of reverse causality; i.e., during periods of high productivity growth, more spending on infrastructure occurred. Using data from the 50 U.S. states, I found little to no evidence of lasting productivity impacts.
A large amount of research followed. The histogram below, from Bom and Ligthart [2014], summarizes 578 estimates from 68 studies that cover various time periods, nations or states, levels of government (municipal, state, federal), and types of public capital.
 The histogram shows the distribution of q, the elasticity defined above. As one can see by inspecting the figure, there are large positive (over 2.0) and large negative (below -1.5) examples in the literature. The bulk of the estimates cluster closely around zero, however. The overall shape of the distribution does suggest a greater chance of positive impacts than negative ones, so a consensus estimate of the elasticity might be slightly above zero.
Infrastructure can contribute to a policy mix that responds effectively to the pandemic recession. But it is not a silver bullet and will only be successful if it is undertaken in a disciplined, patient fashion. As noted above, ATIA strikes me as a good example of this approach.
Thank you, and I look forward to answering your questions.
