


Testimony
March 22, 2022
Testimony on: Rural Quality of Life: Opportunity and Challenges for the Rural Care Economy
United States Senate, Committee on Committee on Agriculture, Nutrition, and Forestry
* The views expressed here are my own and not those of the American Action Forum. I thank Gordon Gray, Jackson Hammond, Tom Lee, and Sarah Smith for their assistance.
Chairwoman Stabenow, Ranking Member Boozman, and members of the committee, thank you for the privilege of appearing today to discuss the rural care economy and the economic outlook for rural communities. I hope to make the following main points:
- No specific policies for the rural care economy can offset the negative impact of a poor macroeconomic environment.
- Due to prior policy errors, the United States is facing inflation levels previously unseen in a generation.
- Overall macro policy should not further exacerbate inflation and specific policies should be consistent with strong market incentives; the Build Back Better agenda falls short on both metrics.
Let me discuss these in turn.
The Macroeconomic Environment
In many respects, the current state of the United States economy is quite good. Real (inflation-adjusted) gross domestic product (GDP) rose at an annual rate of 7.0 percent in the 4th quarter of 2021. The unemployment rate stood at 3.8 percent in the most recent (February) employment report. Wages are rising rapidly; average hourly earnings are up 5.1 percent from February 2021 – 6.7 percent for non-supervisory and production workers.
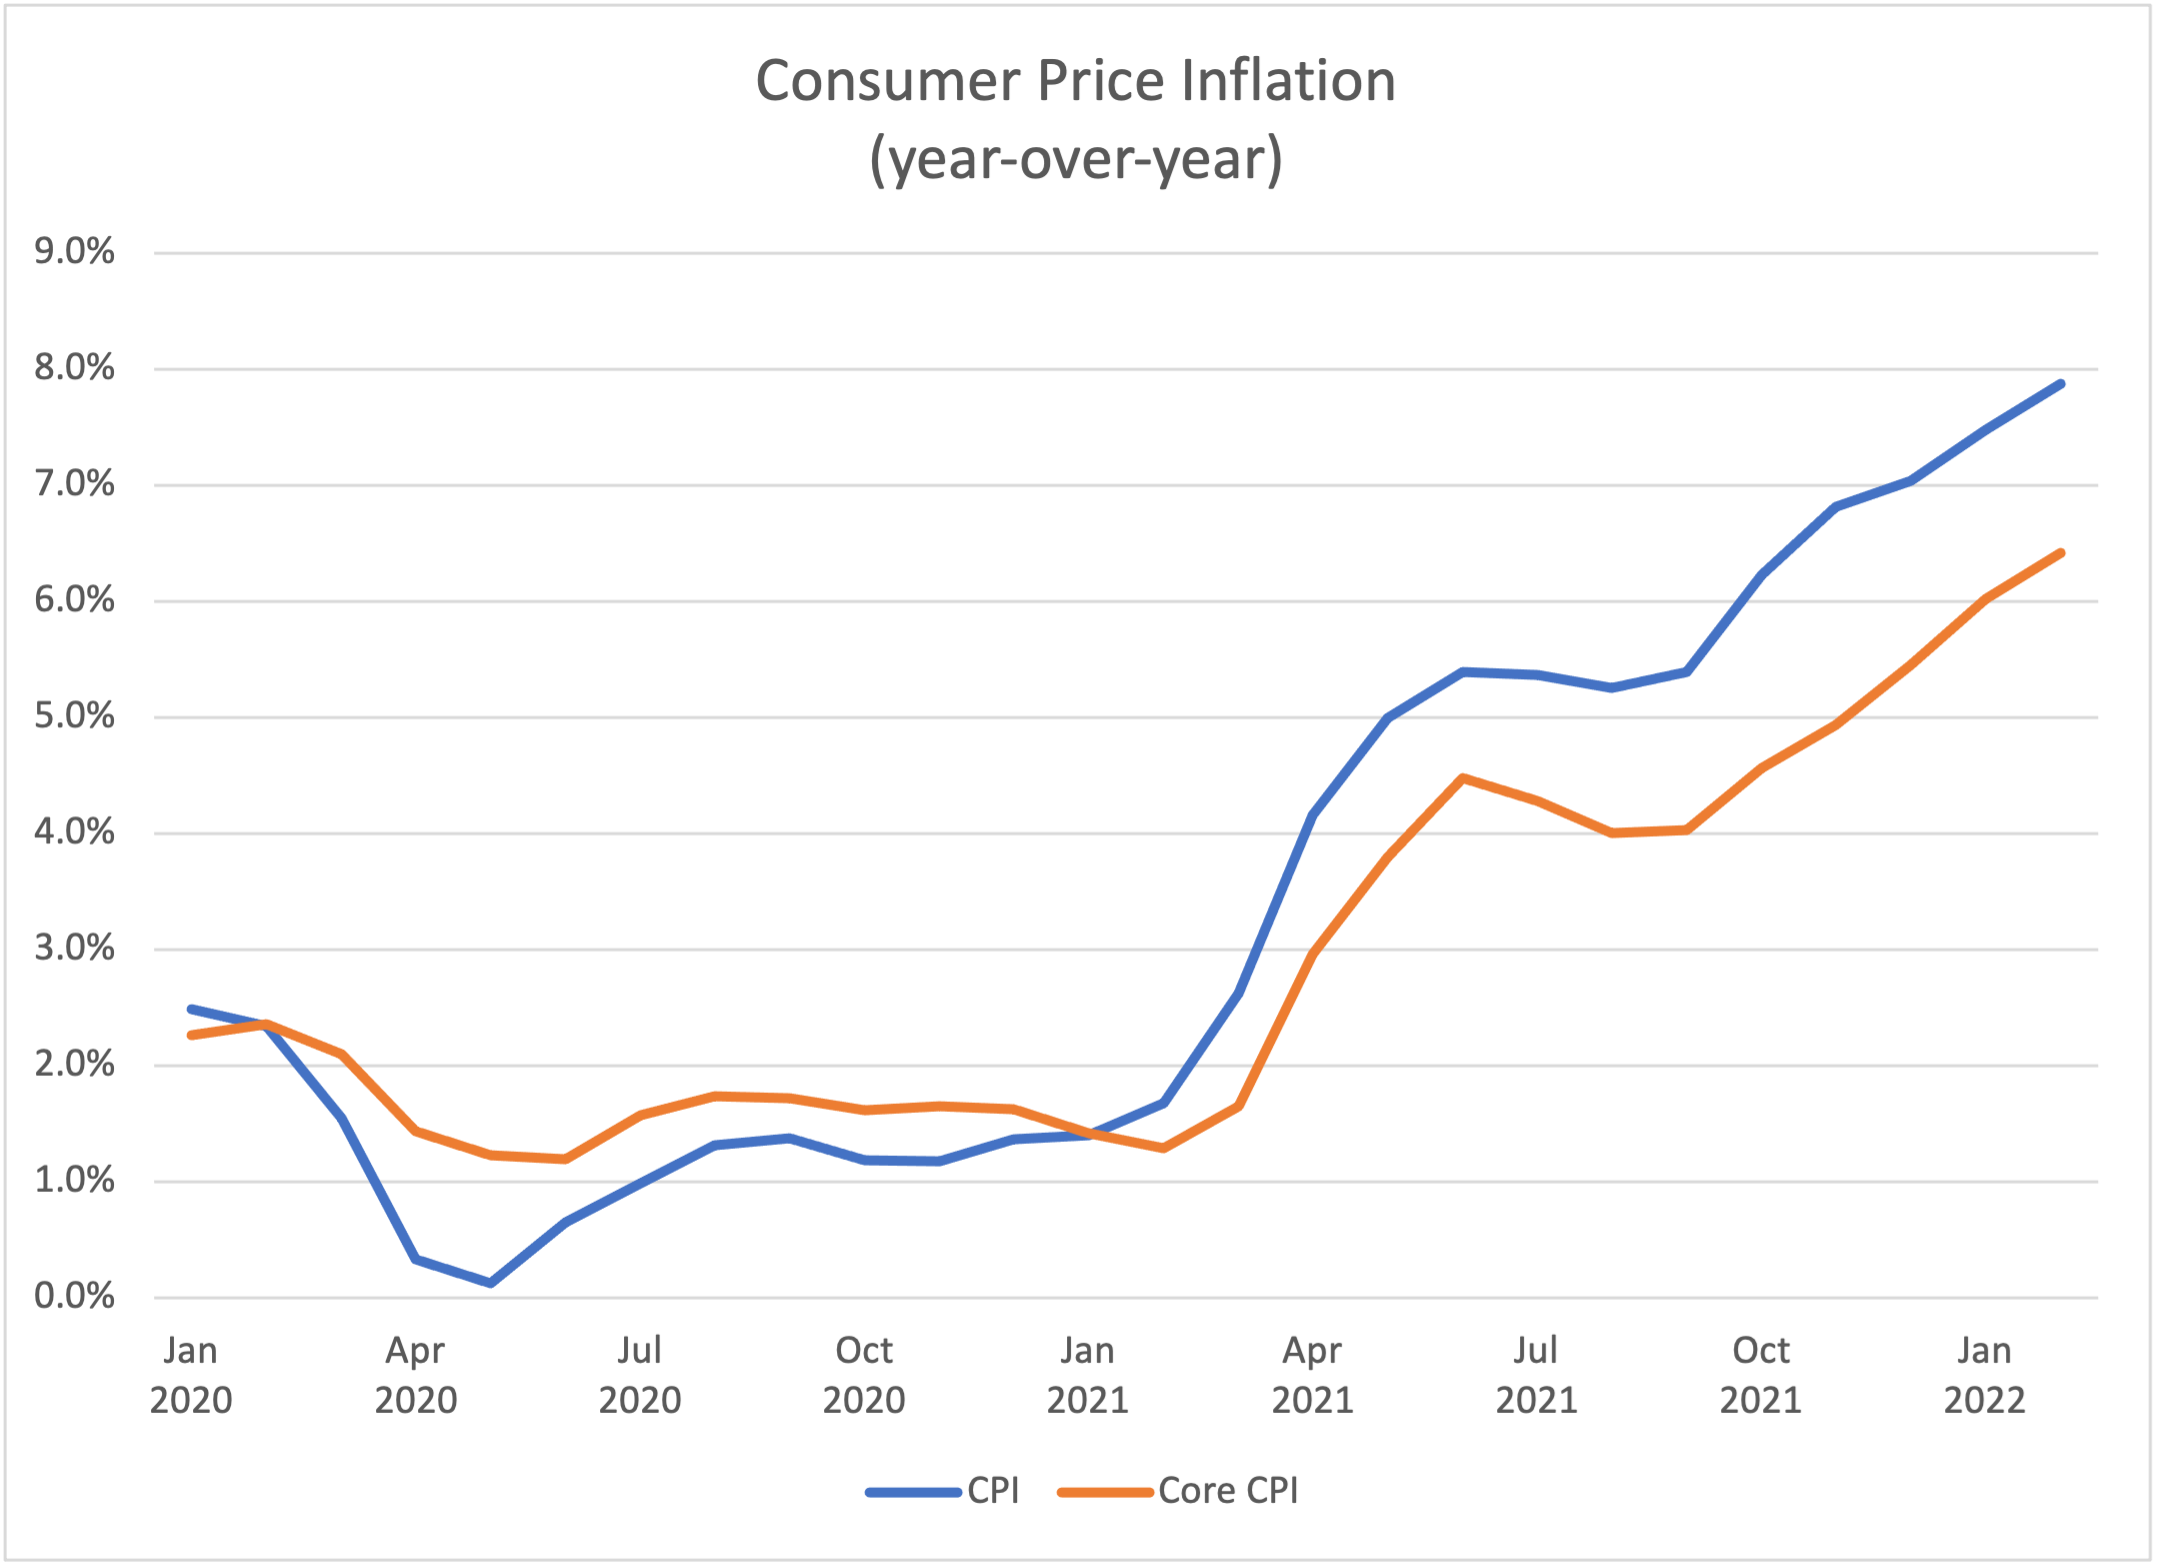
The Achilles heel of the outlook, however, is the worst inflation problem in 40 years. As measured by the Consumer Price Index (CPI), year-over-year inflation has risen from 1.4 percent in January 2021 to 7.9 percent in February 2022 (see chart, below). So-called “core” (non-food, non-energy) CPI is up from 1.4 to 6.4 percent over the same period. In each case, the measure is the highest since 1982.
Even these data, however, disguise the pain of inflation. Over one-half of the typical family budget is devoted to food, energy, and shelter and the composite inflation for these items is currently 8.4 percent. Energy costs are up a staggering 25.6 percent; gasoline alone is up 38.0 percent and regular gas is $4.29 a gallon, on average.[1]
These data raise the important question: How did the United States develop this inflation problem?
Policy Responses to the COVID-19 Recession in 2020
The sharp downturn in the spring of 2020 was different in character, deeper, and more rapid than any postwar recession. Despite this, on a bipartisan basis Congress and the administration responded in a timely fashion, with programs of necessarily large scale and by –and large appropriate design.
During the 2nd quarter of 2020, GDP fell by nearly 10 percent, rivaling the decline of 12 percent during the entire year 1932 – the worst year of the Great Depression. The Coronavirus Aid, Relief, and Economic Security (CARES) Act was passed in March 2020 in bipartisan fashion and was a response of roughly 10 percent of GDP. CARES was timely and appropriate in its scale. The specific programs were also by and large well-designed. In the aftermath of CARES, employment growth resumed in May 2020 and GDP recovered by roughly 8 percent in the 3rd quarter.
In late fall and early winter 2020, however, a new wave of COVID-19 infections arose across the country and headwinds to growth re-emerged. Congress and the administration again responded in a timely, bipartisan fashion with the Consolidated Appropriations Act of 2021, which included roughly $900 billion in economic support modeled on the design of the CARES Act. The economy weathered the COVID-19 stress and grew at a strong 6.5 percent in the first quarter of 2021.
Policy Actions in 2021 and the Emergence of Inflation
In contrast to the policy actions in 2020, the major action in 2021 – the American Rescue Plan (ARP) – was partisan in nature, untimely, and excessively large and poorly designed. It was simply a major policy error.
As the economy entered 2021, it was growing strongly due to the continued support and the arrival of the vaccines as an additional weapon in the fight against the coronavirus. The $1.9 trillion ARP was advertised as much-needed stimulus to reverse the course of the economy and restore growth. The economy was no longer in recession, however, and was growing at a roughly 6.5 percent annual rate. There was simply no need for additional stimulus, especially as a large fraction of the household support in the CARES and appropriations acts had been saved and was available.
Even worse, the ARP was excessively large. Real GDP at the time was below its potential, with the output gap somewhere in the vicinity of $450 billion (in 2012 dollars). The $1.9 trillion stimulus was a bit over $1.6 trillion in 2012 dollars. Thus, the law was a stimulus of over three times the size of the output gap that needed to be closed to get the economy back to potential. Based on any reasonable economic theory of stimulus, $1.9 trillion is far too large, particularly given supply constraints. The ARP (passed in March) did not appreciably alter the pace of growth from the first to the second quarter, but it did fuel inflation.
The 6.5 percentage point jump in CPI inflation has been rivaled only twice in the postwar era – during 1951 when it jumped as much as 10.6 percentage points and 1974 when the rise hit 6.1 percentage points. Both episodes are instructive. The 1951 episode is a cautionary tale about over-stimulating the economy. In this case, year-over-year growth in GDP entered the year in double-digit territory and prosecution of the Korean War layered on year-over-year growth government spending that peaked at 49 percent in the third quarter. Excessive government spending in a hot economy can quickly fuel inflation.
In contrast, the 1974 episode features the exact opposite of demand stimulus. Instead, it reflects a huge supply cost shock – the quadrupling of oil prices due to the OPEC oil embargo. Cost increases can quickly be passed along to consumers, even if the economy is moving toward recession.
The inflation of 2021 reflects a combination of these forces. The COVID-19 pandemic has wreaked havoc on labor markets worldwide, and the resulting disruptions in supply chains and goods production have been well-documented. These supply constraints increased costs and generated higher inflation across the globe. European consumer price inflation, for example, increased about one percentage point each quarter and ended 2021 at 4 percent (see chart, below). Part of the U.S. experience is driven by supply chain issues as well.
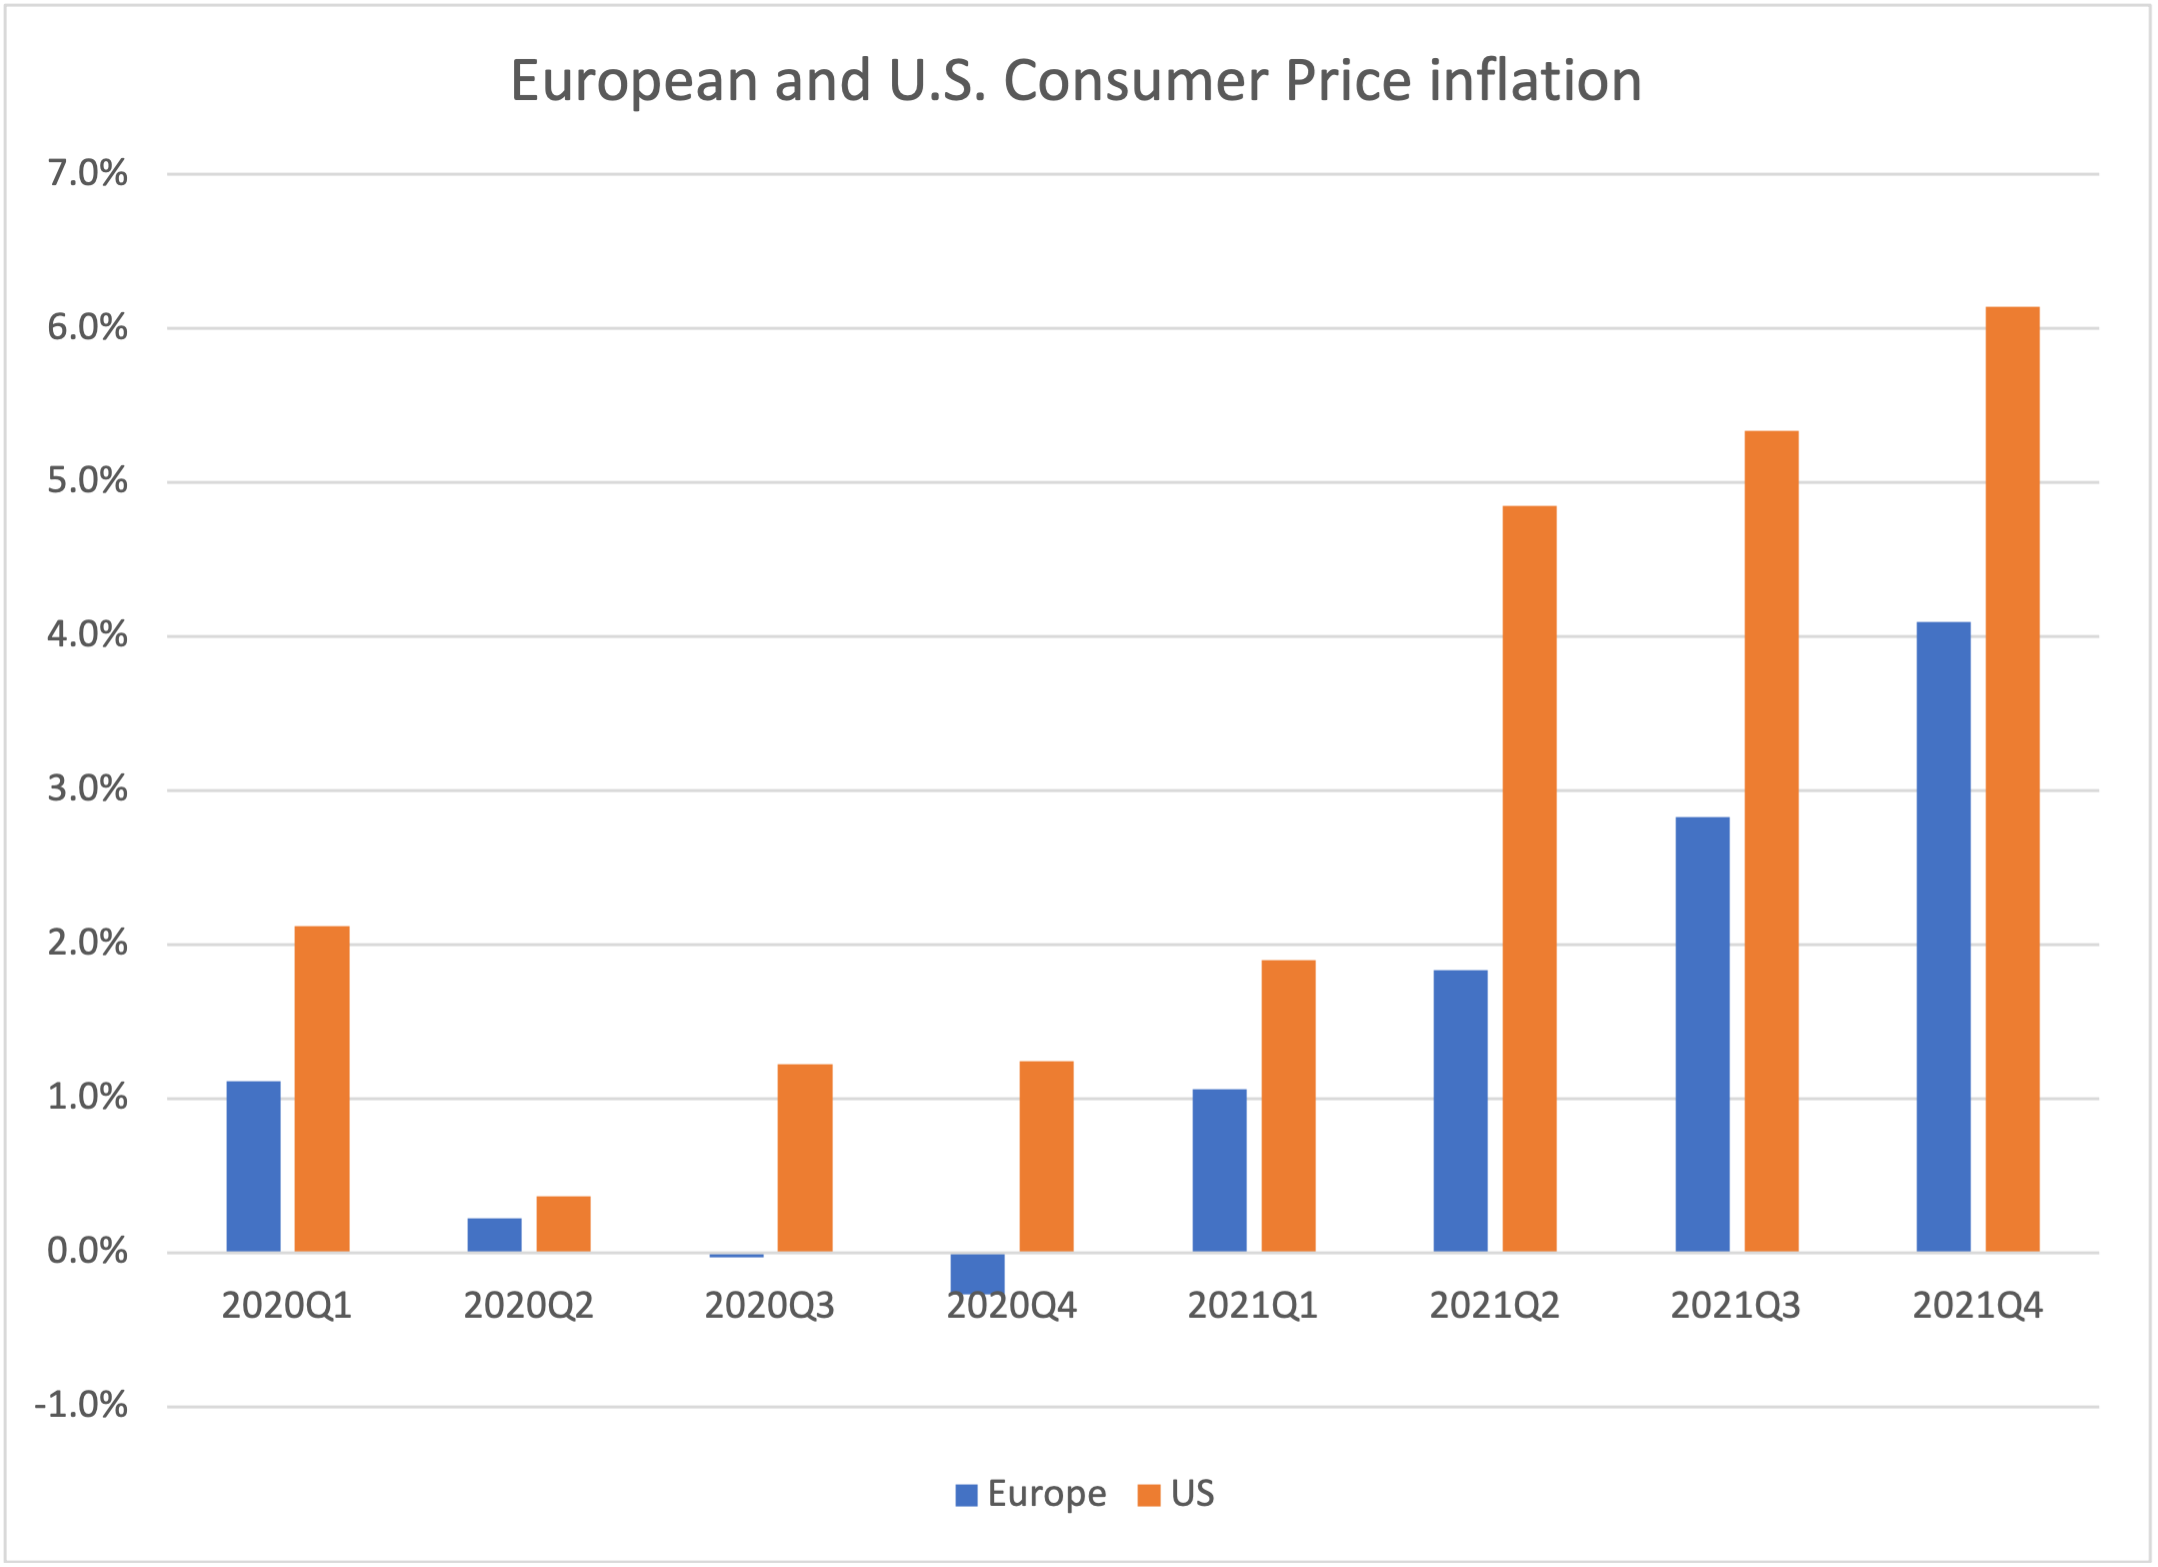
But the ARP added fuel to the fire. Inflation responded immediately to the policy error, jumping from 1.9 percent in the first quarter to 4.8 percent in the second quarter – nearly three times the increase in supply-driven inflation in Europe. The fiscal stimulus was reinforced by an aggressively accommodative monetary policy that featured zero interest rates and continuous, large monetary infusions. Inflation continued to rise as the year went on.
Inflation is a clear problem in the present. Will it continue? To be durable, price inflation must be accompanied by wage inflation and higher inflation expectations. Wage inflation has already arrived, as average hourly earnings rose 5.1 percent from February 2020 to February 2022. To compound matters, consumers’ expectations for inflation over the next year – as measured by the New York Federal Reserve Bank – rose from 3 percent to 6 percent during 2021. This raises the specter of workers bargaining for higher wages as a hedge against expected inflation. When those labor cost increases get passed on to consumers, the expected inflation becomes a self-fulfilling prophecy.
Energy Policy and Trade Policy
As noted earlier, energy prices are a central component of recent inflation dynamics. In part, this reflected the recovery from lows reached during the onset of the COVID-19 pandemic (oil futures briefly entered negative territory in 2020). And more recently, the Russian invasion of Ukraine has been a shock to oil, natural gas, and commodity markets. But the Biden Administration has pursued a fundamentally negative policy agenda toward domestic sources of energy.
In response to the impact of these errors, the Biden Administration has focused on policies that are either too slow-acting – reversing the moratorium on new oil leases on federal lands (currently held up in court), too small (releasing oil from the Strategic Petroleum Reserve), or misguided (banning exports) to be effective.
Similarly, current trade policy is also hurting the rural economy. When President Trump finalized the Section 232 and Section 301 tariffs, five nations retaliated by imposing their own tariffs on U.S. exports. A common target of the retaliatory actions was agricultural products, affecting U.S. exports of soybeans, pork, and fruits and nuts, for example. This hurts U.S. agriculture as there is less demand for its products, resulting in lower revenue and profits.
As a response to the economic damage caused by Trump’s trade war, the United States and China agreed to a “Phase One” trade deal which went into effect in February 2020. One of the main provisions of the deal was for China to commit to expanding purchases of U.S.- made goods, specifically purchasing $80.1 billion of U.S. agricultural products from 2020 through the end of 2021. From January 2020 through December 2021, China’s imports of covered agricultural products from the United States were $61.4 billion (77 percent) and U.S. exports were $61.1 billion (83 percent). This shows Phase One failed to deliver its intended results for U.S. agriculture.
The Biden Administration has opted to remove some of the Section 232 steel and aluminum tariffs on European Union (EU) products. It has also agreed to a deal to remove U.S. and EU tariffs stemming from a dispute between Boeing and Airbus for five years. These actions have led to the EU canceling a portion of its retaliatory tariffs on U.S. exports, including agricultural exports. President Biden has kept in place the majority of tariffs, however, meaning a majority of retaliatory actions are still in effect on U.S. exports. In February 2021, the United States International Trade Commission imposed new tariffs on fertilizer imports, increasing costs for farmers. Ultimately, the Biden Administration could use trade policy to expand U.S. agricultural exports to the rest of the world, helping U.S. farmers. By keeping in place a majority of tariffs while not making any other major moves, however, the Biden Administration is using trade policy to engage in economic protectionism, much like the prior administration. This leads to higher costs for U.S. farmers and lower demand for their products.
The Policy Flaws of the Build Back Better Agenda
The Build Back Better agenda, which has taken various legislative incarnations thus far, is a massive expansion of the social safety net, an enormous and poorly designed tax increase, a climate change policy, an education policy, and much more.
At the macro level, it is of questionable merit as the way forward for pro-growth fiscal policy. American Action Forum (AAF) research highlights one area of concern regarding the economic consequences of raising the proposed taxes and spending it exclusively on productive infrastructure. The economy shrinks instead of grows, as the negative effects of the taxes outweigh even a disciplined focus on productive spending. Since the actual Build Back Better Act (BBBA) is not a disciplined infrastructure spending program, the likely impacts would be even more negative.
Despite this, President Biden continued to make the case for the BBBA in his recent remarks: “[I]t’s true that long-term investments that bring down the biggest costs that families face — housing, childcare, education, and healthcare — these investments will lower out-of-pocket expenses, not raise them. They will spur more people to work by helping ease the burdens of childcare and senior care that parents, especially mothers, bear — keeping them out of the job market”.
The gamble in the BBBA is whether the constellation of checks to parents (child tax credit), paid family leave, child-care subsidies, earned income tax credit expansion, home health care, and health insurance subsidies will raise the labor force participation rate (LFPR) – particularly for women. Suppose, for example, the BBBA were to instantaneously raise the LFPR for U.S. females to that of western Europe (taken from Isabel Soto’s recent research). That would mean an LFPR of 72.1 percent instead of 68.9 percent, or roughly 3.3 million more workers (as of the end of June). That corresponds to a 2.3 percent increase in the labor input in the economy. If productivity is (roughly) the same for the new workers, this means a 2.3 percent increase in GDP.
Is 2.3 percent big? Well, it is roughly one year of trend economic growth or $520 billion. I’ll let you decide if that is “big” enough. I would just emphasize that it is hardly a lock. First, much of the benefit – child credit, health insurance subsidies, home health care, child-care subsidies – is not work-contingent. Moreover, as Soto concluded: “Data from European countries that have implemented country-wide paid-leave programs do not support the argument that a state-sponsored paid-leave system increases female labor force participation. There have also been attempts to create paid leave programs in the United States at the state level, but since the creation of these programs, female labor force participation has not seen significant change.”
No change in labor force participation means no change in supply-side growth.
This constellation of taxpayer subsidies does not grapple with one labor market dynamic that is particularly meaningful in rural America: older Americans permanently leaving the workforce. Between February and April of 2020, the U.S. labor force shrank by nearly 8 million. Nearly two years later, the labor force remains about half a million workers short of the February 2020 level, while the U.S. population has grown by over 3.5 million people. There are a host of factors that influence the decision to return to work, retirement among them. Many older workers retired and never came back. Indeed, recent work by economists from the Kansas City Federal Reserve shows that the share of retirees increased during the pandemic. But interestingly, the rise was caused not by an increase in the decision to retire, but rather in a significant increase in workers’ decision to stay retired. Given that rural America has a higher share of Americans over age 65, older Americans’ decisions to stay retired will be of particular importance. The BBBA’s panoply of subsidies do not appear well-suited to shift that trend. Instead, the agenda would become simply another large demand stimulus, exactly what the U.S. economy does not need at this moment.
The individual policies also suffer from design flaws. Consider elder, child, and health care.
Elder care. According to an AAF analysis, the cost of caring for the millions of seniors who will need care over the next decade will dwarf the budget allocated under this proposal. The cost of employing 1.5 million health care workers full-time at an hourly wage of $22 (more than the average wage of home health aides) is $33 billion for a single year, but the cost of care is much higher than the cost of the labor of the care provider. Many people will need full-time care and ready access to medical equipment, which will necessitate moving into long-term care facilities; such a facility can cost around $100,000 per year currently.
While most seniors prefer to age at home, for many it will not be an option; simply providing more home health care workers will not solve the entirety of the long-term care crisis. AAF previously estimated that the cost of various types of long-term care (LTC) over the next decade will increase between 20 percent for home health aides and up to 47 percent for assisted living facilities, based on current trends. Given these projections, the total cost of LTC needed in 2030 could reach between $1.3 trillion and $2.5 trillion.
Based on these estimates, President Biden’s estimated cost of $450 billion, which is also intended to fund innovative new treatment options, is woefully unrealistic. Further, it is unclear whether the plan envisions these LTC workers being hired by the government or the private sector; if the idea is for the private sector to hire them, there are no details as to how the government would facilitate that uptake and cover those costs.
Child Care. Proposals from this administration on child care would actively make the situation worse, not better, as noted by one AAF analysis. The cost of providing child care is largely driven by labor—young children need a lot of supervision, which has led to minimum staffing requirements of one care provider for every three, five, or 10 children, depending on age. With such ratios, a care provider’s salary is limited by the fee per child. For example, with a staff-to-child ratio of 1:4, the cost per child must be $15,000 to pay a wage of $60,000, without accounting for any of the significant overhead costs of the facility, including rent, liability insurance, furnishings, toys, administrative expenses, and so on.
And many of these overhead expenses are fueled by other regulatory requirements intended to keep children safe, healthy, and able to thrive developmentally. While easing some of these regulatory burdens may reduce costs and lower the barriers to entry for new providers, parents may understandably be uncomfortable with relaxed standards for their children’s care providers.
Given these labor constraints and cost burdens, increasing supply is likely to be expensive. Calculating the cost of key child care proposals requires an understanding of how many children need formal care to figure out how many additional caregivers and how much new space is needed. None of this is easily known. Not all young children need formal daycare outside of the home; many are kept at home with their parents, family members, or paid providers. Children cared for by paid professionals in their own homes obviously do not require additional daycare center space or labor. Many 3- to 5-year-olds attend preschool for part of the day and thus only need daycare for part of the day, or perhaps not at all.
There are 24.6 million children aged 0-5 living in 14 million households, including 10 million households where there are two parents and both are working, or there is a single parent who is working. Among the nearly 12 million children aged 3-5 in the United States, 61 percent (7.3 million) attend preschool for part of the day, meaning they may only need child care for half of the day. Assuming an even distribution of children who need care because their parents are working across age groups and whether they attend preschool or not, we can assume 8.9 million infants to 2-year-olds need care, as well as the equivalent of 5.9 million 3- to 5-year-olds (with those in preschool counted as needing only half a day). Thus, for purposes of this analysis, let’s suppose 14.8 million children need care.
With an average staff-child ratio of 1:5, 3 million child care workers are required to fully meet demand. As of May 2019, there were only 561,520 child care workers according to the Bureau of Labor Statistics, suggesting a workforce sufficient for roughly 2.8 million children. Thus, there appears to be a shortage of roughly 2.4 million child care workers. A common component of the Democratic proposals noted above is to increase the supply of caregivers by increasing their wages to a level on par with elementary school educators. Currently, child care workers make significantly less: The median annual income of a child care worker is $25,460, while the median annual salary for an elementary school teacher is $60,940. If given an annual wage of $60,000, this would cost $144 billion, plus an additional $19.6 billion to increase the wages of the existing child care staff.
Many child care centers would also need to be built, which would require significant new funding. Typical requirements for the amount of space per child is a minimum of 35 square feet indoors, although some areas require more; additional outdoor space is also necessary, but not all facilities would need to include outdoor space if public space is available nearby. If an additional 12 million children need care, at least 420 million square feet of new child care space would be needed. With an average retail office space rental cost of $18 per square foot as of the second quarter of 2020, the new space needed would cost $7.6 billion annually in rent.
In total, based on these estimates, increasing the supply of child care is expected to cost a minimum of $171.2 billion in the first year, with much of these costs likely to increase each year as inflation rises and salaries grow. The cost would also increase further should the number of children needing care rise. Finally, subsidizing the cost of care for high-income earners and limiting the cost to no more than 7 percent of a family’s income would eliminate downward pricing pressures, potentially allowing for higher charges. None of the various proposals described below would provide nearly enough funding to cover these estimated 10-year costs. Further, this estimate does not account for the substantial additional cost of providing families with child care subsidies more generous than what is currently available.
Health care. As with child care, the issues plaguing rural health care are ones of supply. The United States Department of Agriculture programs being discussed today, particularly the Community Facilities Program and the Distance Learning and Telemedicine Program, are attempts to mitigate the severe shortage of providers and facilities in rural areas. These programs are important to rural communities, but they are ultimately band-aids on an expensive health care system that incentivizes volume over quality. President Biden’s BBBA proposals do not address this supply crisis and would likely worsen rural health care with its drug pricing provisions. The combination of price setting (what the administration calls “negotiation”) by the Health and Human Services secretary and inflation penalties would very likely reduce generic and biosimilar market entry, putting at risk potential savings and improved treatment options for millions of Americans. Price controls in the insulin market, in particular, would essentially eliminate future improvements in insulins and may well be unnecessary as insulin prices are beginning to drop with the emergence of greater competition. The BBBA’s inflation penalties are also likely to result in higher launch prices and could drive price increases commensurate with inflation for therapies whose prices would not increase under current law.
Thank you and I look forward to your questions.
