


Testimony
January 18, 2024
Unleashing Main Street’s Potential: Examining Avenues to Capital Access
U.S. House of Representatives Committee on Small Business
* The views expressed here are my own and not those of the American Action Forum (AAF). I thank Dan Goldbeck, Angela Kuck, and Sarah Smith for their assistance.
Chairman Williams, Ranking Member Velazquez, and members of the committee, thank you for the privilege of appearing today to discuss access to capital and the growth prospects of America’s small businesses.
Small businesses are central to the performance of the U.S. economy in meeting the needs of American families. According to the Small Business Administration (SBA) 99.9 percent of businesses across the United States are small businesses; a total of 33.2 million businesses and nearly half of all U.S. employees are employed by a small business. The distribution of employment is highly uneven, however, with 16 percent of small businesses having one to 19 employees and only 650,000 small businesses having between 20 and 499 employees.
Thus, it is desirable that small businesses also be growing businesses, and the current economic and policy environment has a multitude of headwinds to growth. In particular:
- The current macroeconomy is characterized by slowing economic growth, the stubborn remainder of high inflation, and the challenge of returning inflation to the Federal Reserve’s 2 percent target;
- In general, the Biden Administration is imposing regulatory burdens at a record rate, while the Basel III endgame capital rules threaten to needlessly raise the cost of all credit products; and
- Additional policy uncertainty stems from the budgetary outlook, the tax treatment of investments and research and development expenditures and the 2025 sunsets of broad swaths of the 2017 tax law.
Let me discuss each in turn.
The Macroeconomic Environment
In some respects, the current state of the U.S. economy appears quite solid. Real (inflation-adjusted) gross domestic product (GDP) rose 4.9 percent in the 3rd quarter of 2023, up from 2.1 percent and 2.2 percent in the 1st and 2nd quarters, respectively. The unemployment rate stood at 3.7 percent in the December employment report and average hourly earnings rose 4.1 percent from December 2022 to December 2023.
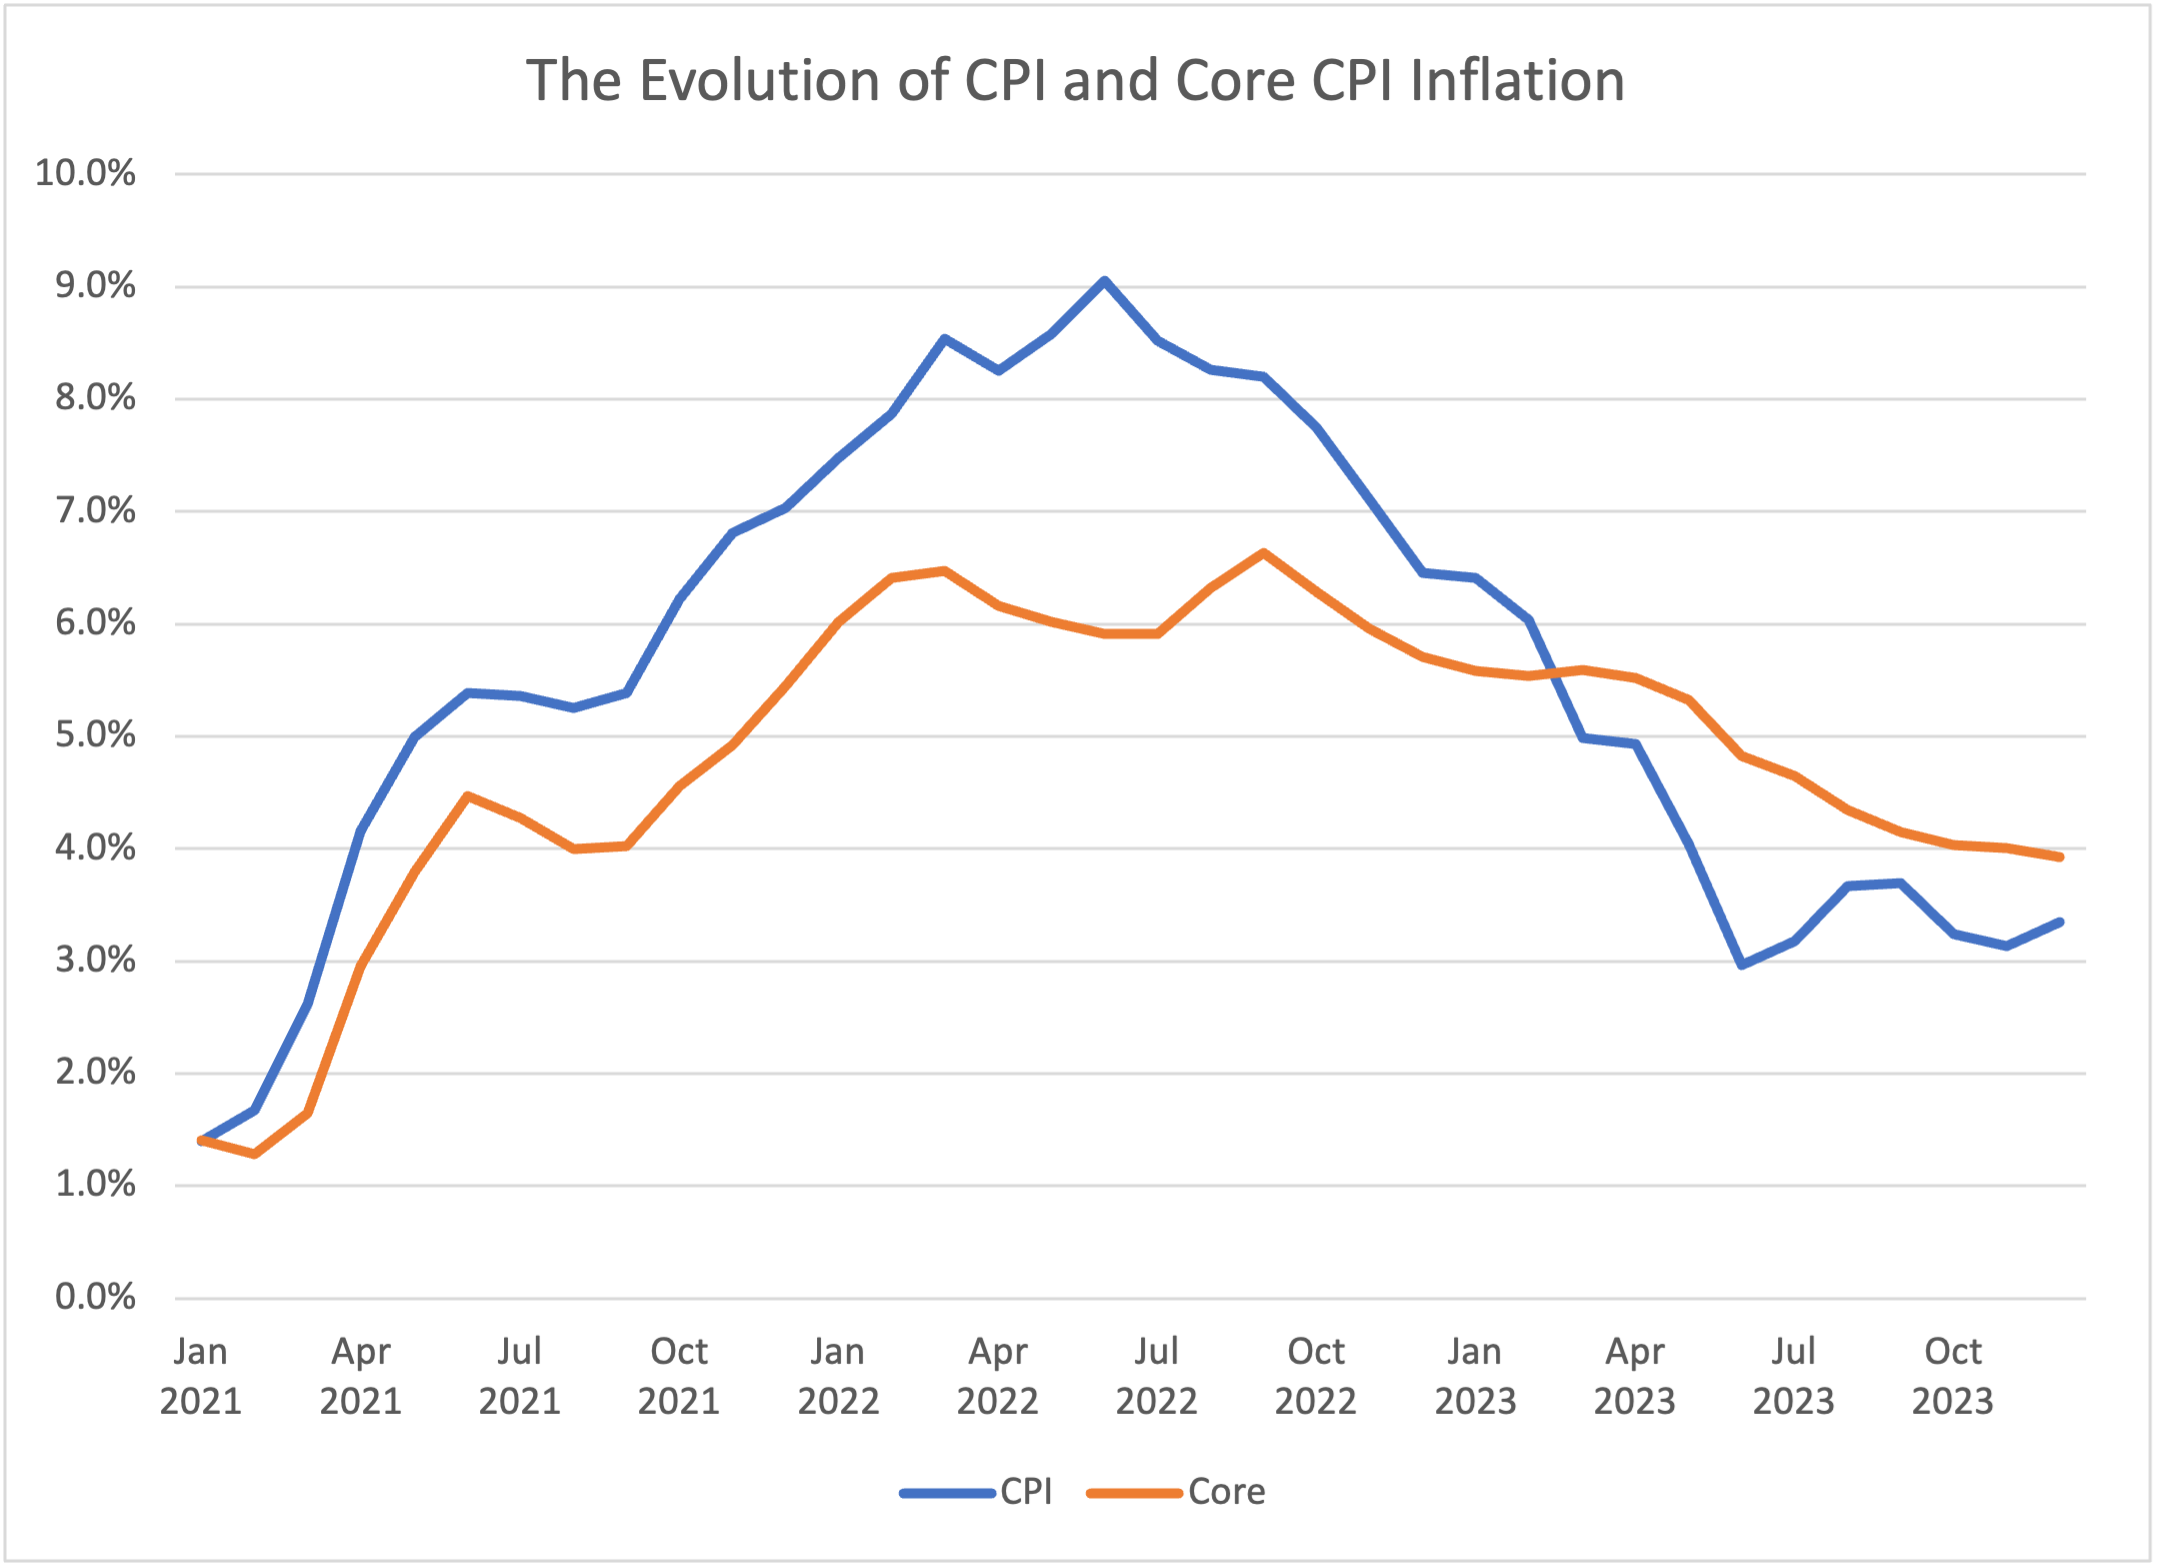
There are two notable weaknesses in the outlook, however. The first is the aftermath of the worst inflation problem in 40 years. As measured by the Consumer Price Index (CPI), year-over-year inflation has risen from 1.4 percent in January 2021 to a peak of 9.1 percent and settled at 3.4 percent in December. (See chart, below.) So-called “core” (non-food, non-energy) CPI is up from 1.4 percent to 3.9 percent over the same period, with a peak of 6.6 percent. In each case, the measures have experienced their highest levels since 1982 and exceeded the pace of wage increases in 2021 and 2022.
Inflation itself, as well as the interest rate increases brought about by the Federal Reserve’s attempts to return to the 2 percent target, have had a distressing impact on the small business community. Thus, an important issue for future policy is avoiding inflation. How did this inflation problem develop?
Policy Responses to the COVID-19 Recession in 2020
The sharp downturn in the spring of 2020 was different in character, deeper, and more rapid than any postwar recession. In response, on a bipartisan basis, Congress and the administration responded in a timely fashion, with programs of necessarily large scale and by-and-large appropriate design.
Immediately upon recognition of the potential for financial distress, the Federal Reserve cut rates to zero, made an open-ended commitment to providing liquidity, and began a monthly quantitative easing consisting of $60 billion of Treasury securities and $30 billion of mortgage-backed securities.
During the 2nd quarter of 2020, GDP fell by nearly 10 percent, rivaling the decline of 12 percent during the entire year of 1932 – the worst year of the Great Depression. The Coronavirus Aid, Relief, and Economic Security (CARES) Act was passed in March 2020 in bipartisan fashion and was a response of roughly 10 percent of GDP. CARES was timely and appropriate in its scale. The specific programs were also for the most part well-designed. In the aftermath of CARES, employment growth resumed in May 2020 and GDP recovered by roughly 8 percent in the 3rd quarter.
In the late fall and early winter of 2020, however, a new wave of COVID-19 infections arose across the country and headwinds to growth re-emerged. Congress and the administration again responded in a timely, bipartisan fashion with the Consolidated Appropriations Act of 2021, which included roughly $900 billion in economic support modeled on the design of the CARES Act. The combination of fiscal and monetary policy in 2020 allowed the economy to weather the COVID-19 stress and it grew at a strong 6.5 percent in the 1st quarter of 2021.
Policy Actions in 2021 and the Emergence of Inflation
In contrast to the policy actions in 2020, the major actions in 2021 – unchanged stimulative monetary policy and the American Rescue Plan Act (ARPA) – were untimely, excessively large, and poorly designed. Both represent a major policy error.
As the economy entered 2021, it grew strongly due to the continued support and the arrival of the vaccines as an additional weapon in the fight against the coronavirus. The $1.9 trillion ARPA was advertised as much-needed stimulus to improve the state of the economy and restore growth. The economy was no longer in recession, however, and was growing at a roughly 6.5 percent annual rate. There was simply no need for additional stimulus, especially as a large fraction of the household support in the CARES and Consolidated Appropriations Acts had been saved and was available.
Worse, the ARPA was excessively large. Real GDP at the time was below its potential, with the output gap somewhere in the vicinity of $450 billion (in 2012 dollars). The $1.9 trillion stimulus was a bit over $1.6 trillion in 2012 dollars. Thus, the law was a stimulus of over three times the size of the output gap that needed to be closed to get the economy back to potential. Based on any reasonable economic theory of stimulus, $1.9 trillion is far too large, particularly given supply constraints. The ARPA (passed in March) did not appreciably alter the pace of growth from the 1st to the 2nd quarter, but it did fuel inflation.
The 6.5 percentage point jump in CPI inflation has been rivaled only twice in the postwar period – during 1951 when it jumped as much as 10.6 percentage points and 1974 when the rise hit 6.1 percentage points. Both episodes are instructive. The 1951 episode is a cautionary tale about over-stimulating the economy. In this case, year-over-year growth in GDP entered the year in double-digit territory and prosecution of the Korean War layered on year-over-year growth in government spending that peaked at 49 percent in the 3rd quarter. Excessive government spending in a hot economy can quickly fuel inflation.
In contrast, the 1974 episode featured the exact opposite of demand stimulus. Instead, it reflects a huge supply cost shock – the quadrupling of oil prices due to the OPEC oil embargo. Cost increases can quickly be passed along to consumers, even if the economy is moving toward recession.
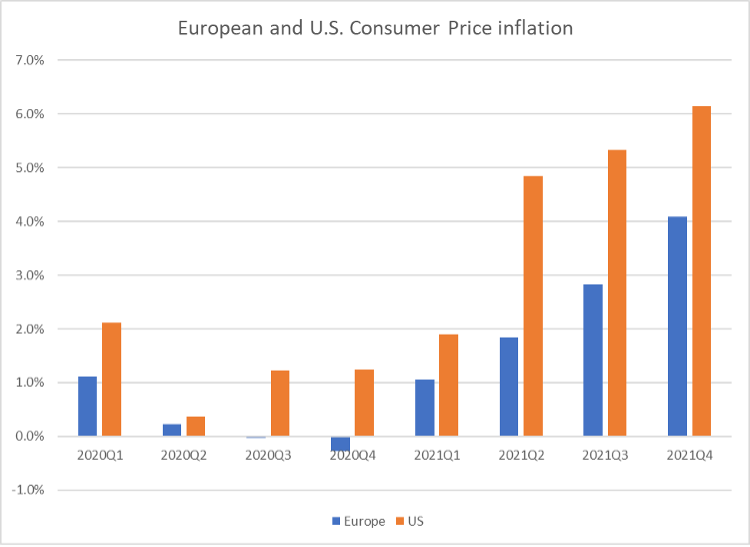
The inflation of 2021 reflects a combination of these forces. The COVID-19 pandemic has wreaked havoc on labor markets worldwide, and the resulting disruptions in supply chains and goods production have been well-documented. These supply constraints increased costs and generated higher inflation across the globe. European consumer price inflation, for example, increased about 1 percentage point each quarter and ended 2021 at 4 percent. (See chart, below.) Part of the U.S. experience is driven by supply chain issues, as well.
But the ARPA added fuel to the fire. Inflation responded immediately to the policy error, jumping from 1.9 percent in the 1st quarter to 4.8 percent in the 2nd quarter – nearly three times the increase in supply-driven inflation in Europe. The fiscal stimulus was reinforced by an aggressively accommodative monetary policy that featured 0 percent interest rates and continuous, large monetary infusions. Inflation continued to rise as the year went on.
Continued Policy Actions and Inflation
In the period after the ARPA, Congress passed the Infrastructure Investment and Jobs Act, known as the Bipartisan Infrastructure Framework (BIF). Did this exacerbate the inflation problem? First, despite all the claims of passing a trillion-dollar infrastructure bill, the Congressional Budget Office (CBO) indicates that discretionary spending will rise by $415.4 billion over the next 10 years. This is significant but not a fiscal earthquake like the ARPA.
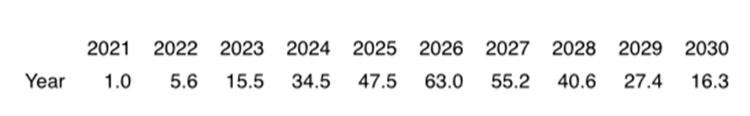
Second, the BIF will not generate any significant near-term stimulus or inflationary pressure. The table below shows a rough translation of the CBO score into calendar-year spending impacts, including the mandatory spending offsets. In a roughly $21-trillion economy, another $5.6 billion in spending (0.026 percent) simply is not going to move the macroeconomic needle. Even at the maximum, the impact will be below one-half of 1 percent of GDP.
Third, while the bill will not create additional inflation pressure, it will also not solve the administration’s current inflation-related political problems. There just is not enough impact in the near term to accomplish this task. Even at the peak, this would require a more significant impact on productivity and aggregate supply, and these dollars are not large enough to accomplish this kind of supply expansion.
Nevertheless, other pieces of legislation did contribute to the durability of the inflation problem. The first to think about is the Inflation Reduction Act (IRA). To be clear, the IRA will not reduce inflation. In fact, no single piece of legislation will do that. What matters, instead, is the overall tax-and-spend (fiscal) policy of Congress. Indeed, as Gordon Gray nicely documents, the two big items Congress passed are the CHIPS Act and the IRA. Combined, they would raise taxes by about $830 billion and increase spending by $515 billion, yielding $315 billion in deficit reduction. That sounds anti-inflationary. Unfortunately, a closer look reveals the bills would not begin to materially reduce the deficit until 2028 – that is, four years from now. It will be up to the Federal Reserve to bring inflation under control.
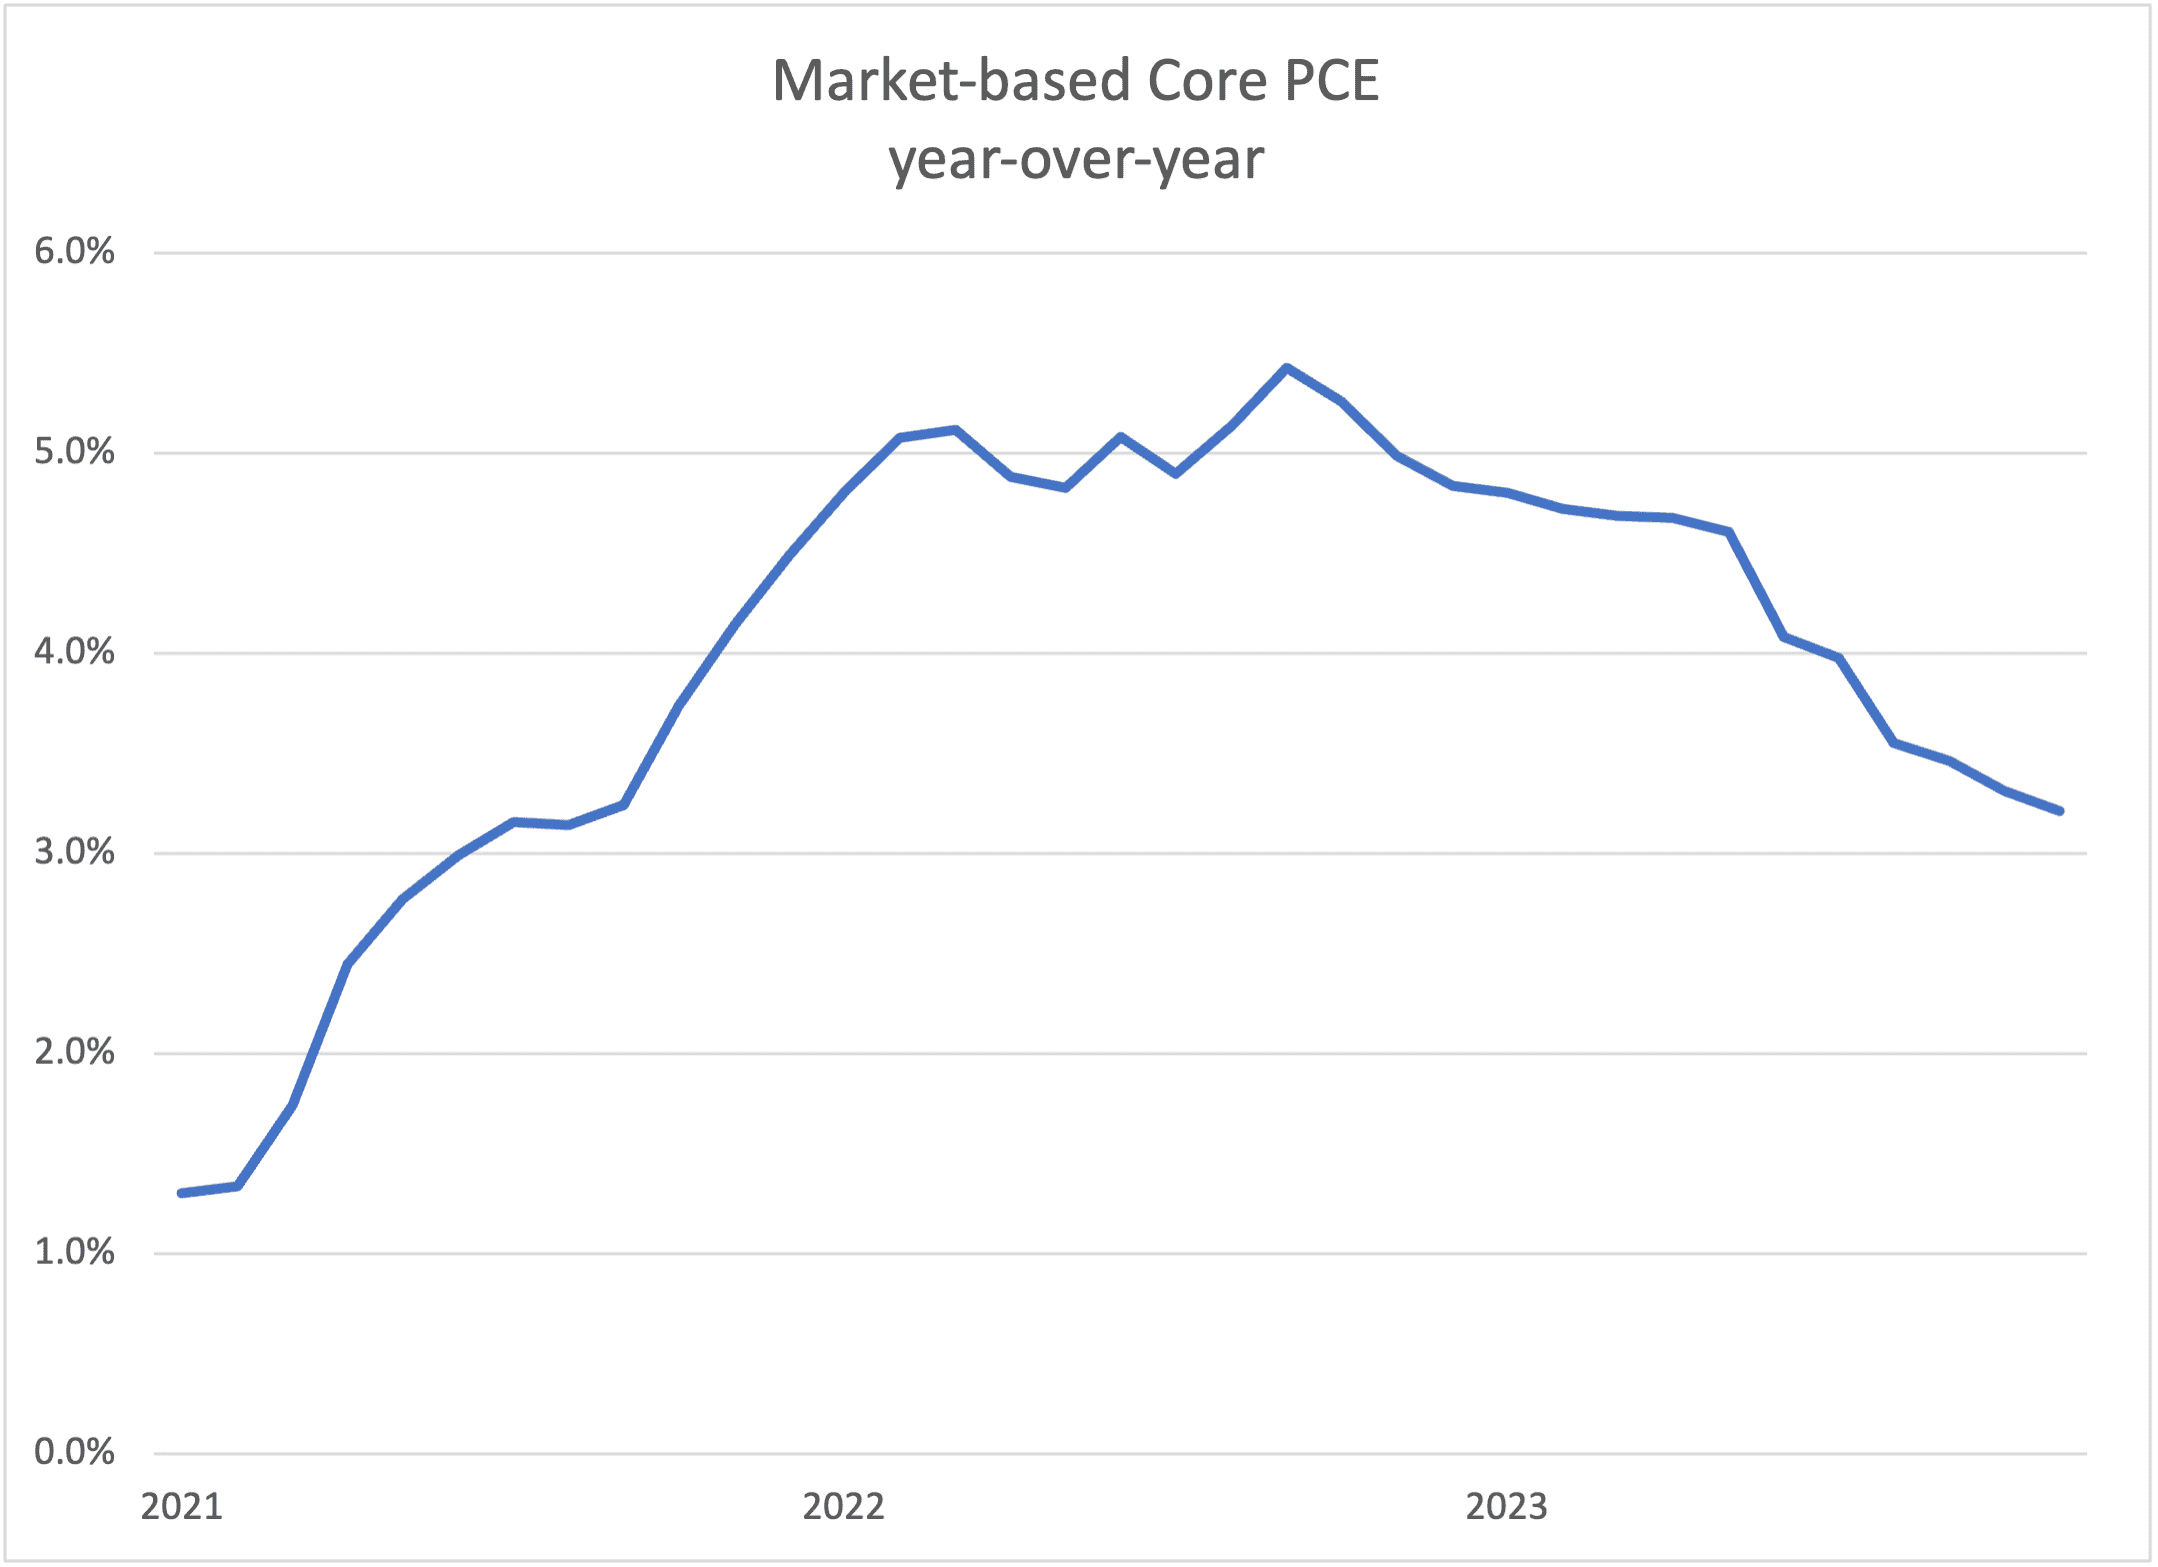
Looking forward, an important aspect of the uncertainty is the unknown need for the Federal Reserve to maintain a restrictive monetary policy. Although substantial progress was made in 2023, the Fed’s preferred measure of inflation remains well above the 2 percent target. (See chart, below).
Any such need highlights the second weakness in the outlook: an excessive reliance on demand from the household sector. In the 3rd quarter GDP data, of the 4.9 percent growth rate, 1.3 percentage points were due to (transitory) inventory accumulation and essential 1.0 point from government spending. The remainder, 2.6 percentage points of private demand growth, derived almost entirely from household spending. Non-residential fixed investment contributed a mere 0.2 percentage points. The most recent data suggest that this imbalance continued in the 4th quarter of 2023.
This is troubling because every postwar recession, with the exception of the pandemic recession, began with a downturn in business investment. Thus, to the extent that an environment of high interest rates and continued investment is sapping the confidence of businesses small and large, the need to continue to combat inflation will constrict future investment spending and elevate the risks of recession.
In short, the current economic outlook is fraught with risks to growth in the small business sector and the economy as a whole.
Regulatory Burdens
A second headwind to small business growth is regulatory burdens. To get a handle on how regulatory burdens affect economic growth, one must first ascertain what the regulatory landscape looks like. Thankfully, as part of its ongoing RegRodeo project, the American Action Forum (AAF) has a record of all rules with some measurable economic impact going back to 2005. The estimates logged in RegRodeo come directly from agency estimates provided in a given rule’s analysis.
From 2005 to today, agencies have recorded cumulative totals of $1.5 trillion in regulatory costs and approximately 1.3 billion annual hours of paperwork. For perspective, the cumulative new regulatory costs imposed over the past 18 and a half years would represent roughly 6 percent of current U.S. GDP.
The cumulative picture, however, largely demonstrates the rough scale of regulation. There have been four different presidential administrations in power at some point during the span that RegRodeo covers. The following graph charts the average total costs per year imposed in each administration:
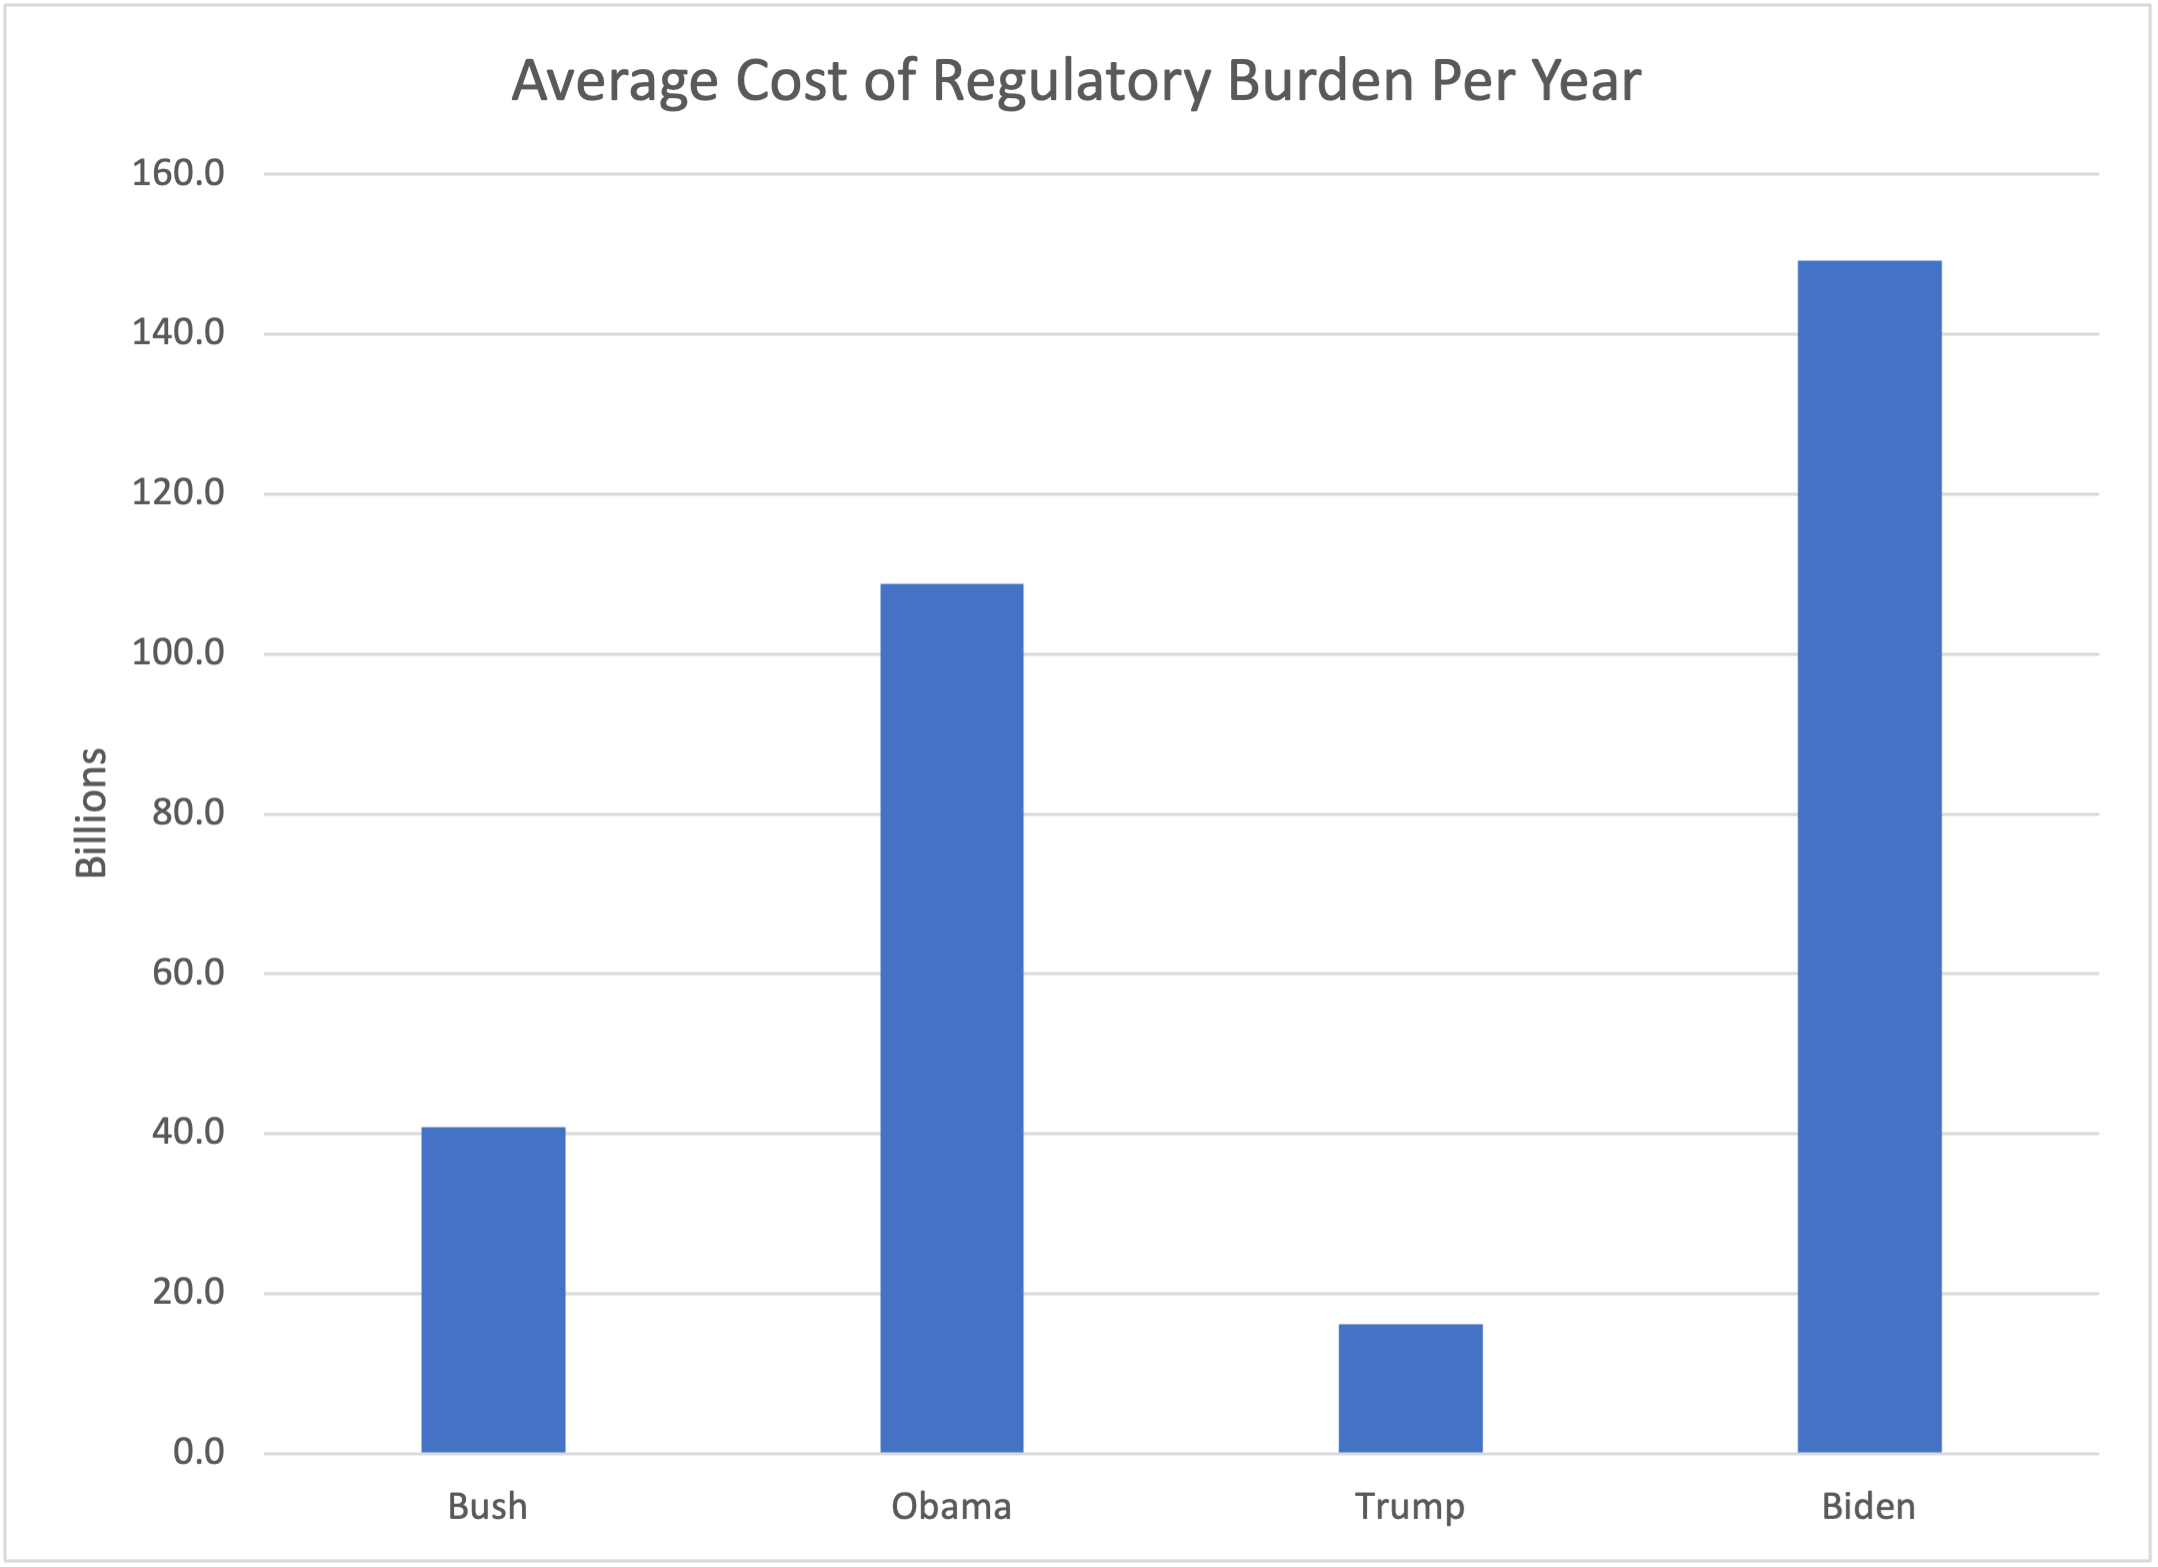
Granted, this only includes a partial sample of the Bush and (by necessity) Biden Administrations. It is nevertheless difficult not to draw some immediate conclusions regarding administration-to-administration trends. The Biden Administration represents an outlier in the scale of the regulatory burden, and the most recent unified agenda indicates no cessation of this regulatory tsunami.
There is no definitive estimate of the growth consequences of excessively costly regulation. Nevertheless, there is a growing literature examining the economic consequences of regulation. Van Reenen, Aghion, and Bergeaud (2023) analyze the consequences of a sharp increase in the burden of labor regulations on companies with 50 or more employees. Using panel data from France, they find that regulation is a headwind to innovation and growth:
Using the structure of our model we quantitatively estimate parameters and find that the regulation reduces aggregate equilibrium innovation (and growth) by 5.8% which translates into a consumption equivalent welfare loss of at least 2.3%, approximately doubling the static losses in the existing literature.
Similarly, Armstrong, Glaeser, and Hoopes (2023) find that: “Consistent with regulation imposing net costs on firms, firms’ overall exposure to regulation negatively relates to their profitability and more regulated firms earn higher future returns.”
Finally, Dawson and Seater (2013) look at the economy as a whole and conclude:
We introduce a new time series measure of the extent of federal regulation in the U.S. and use it to investigate the relationship between federal regulation and macroeconomic performance. We find that regulation has statistically and economically significant effects on aggregate output and the factors that produce it–total factor productivity (TFP), physical capital, and labor. Regulation has caused substantial reductions in the growth rates of both output and TFP and has had effects on the trends in capital and labor that vary over time in both sign and magnitude. Regulation also affects deviations about the trends in output and its factors of production, and the effects differ across dependent variables. Regulation changes the way output is produced by changing the mix of inputs. Changes in regulation offer a straightforward explanation for the productivity slowdown of the 1970s.
These findings are not surprising. Regulation imposes costs on firms, which compete with opportunities for innovation, capital investment, worker training, and productivity growth. At present, they also represent an additional supply shock that exacerbates inflation pressures. It is widely recognized that small businesses are especially vulnerable to regulatory costs and that the impact of such an aggressive regulatory state will be felt most acutely among those firms that are key employers facing the need for better growth policy.
At present, a particular financial services regulation – the so-called Basel III endgame – represents a significant threat to access to capital by small businesses. As I have previously written:
[T]he Fed will likely raise the capital requirements on the largest banks even though there is no evidence of any need for the increase. And it will expand to the regional banks the same requirements because of the failure of Silicon Valley Bank, even though there is zero evidence that capital requirements or risk models led to its problems. And how does it conclude that this is a good idea? By ignoring costs.
Sure, there are benefits to regulations, but there are also costs and not all regulatory expansions will pass a benefit-cost test. The Fed seems to have forgotten about half of the issues in evaluating capital requirements.
Holding additional capital is argued to provide benefits in the form of safety and soundness. But the regulators have provided no evidence of the scale of such benefits, even though the large increase in capital standards will become embedded in the cost of every credit product, raising the costs of accessing capital for every small business.
Policy Uncertainty: The Budget and the Tax Code
The final source of headwinds to growth for small businesses is the unknown resolution of the outlook for the federal budget and the tax code. For the economy as a whole, the most pressing economic policy issues are interrelated: the need for faster economic growth and a fiscal stance that reduces deficits and controls the federal debt. The record on growth is striking. From 1960 through 2000, the average pace of growth in real GDP per capita was 2.4 percent. At this pace, GDP per capita – a rough measure of the standard of living – would double every 29 years. Thus, in roughly one working career, growth would double the standard of living, giving American families the opportunity to pursue their economic dreams.
Since then, from 2001 to 2022, the average pace of growth has been a full percentage point slower: 1.4 percent. At this pace the standard of living will double only every 56 years. There is the palpable sense that access to the American Dream is disappearing over the horizon.
The implications are enormous. Had the pace of growth been maintained in the 21st century, real GDP (in 2017 dollars) would have been $6.3 trillion higher in 2022, translating into additional real income of nearly $19,000 per capita. There is no government transfer program that can compete with the power of compound economic growth.
The budget consequences would be enormous as well. Assuming federal revenues are roughly 19 percent of GDP, a faster pace of growth would mean that revenues would be $1.2 trillion higher than at present. At a time when the CBO projects $20 trillion in federal deficits over the next 10 years, having $12 trillion less in deficits would make the job of controlling the federal debt much more manageable.
Note, however, that how federal deficits will evolve is especially anti-growth. The CBO baseline anticipates that the unified deficit will rise from 5.8 percent of GDP in 2024 to 7.3 percent of GDP in 2033, a 1.5 percentage point rise. Social Security spending will rise by 0.7 percentage points (from 5.3 percent to 6.0 percent of GDP) and Medicare spending will rise by 1.6 percentage points (from 3.7 percent of GDP to 5.3 percent of GDP). Thus, the combined growth of these two large mandatory spending programs will exceed the increase in the deficit by 0.8 percentage points.
If resources are transferred from private-sector investment to federal subsidies to consumption, each dollar transferred reduces the growth in productivity, real wages, and the standard of living. Notice that this is true regardless of whether that transfer comes via taxes or deficit finance, but deficit finance is more likely to come at the expense of private investment. Past chronic federal deficits have already been a headwind to growth; the evolution of deficits over the next decade is an even greater threat to growth.
In short, how the fiscal threat is addressed matters tremendously for growth. And the sunset of the tax rates, investment incentives, and small business features of the 2017 Tax Cuts and Jobs Act is a particular example of this general issue. Simply allowing the provisions of the 2017 Act to sunset would be an enormous shock to growth prospects in the small business sector.
Instead, Congress must recognize that federal fiscal policy is contributing to the slower pace of economic growth. Borrowing trillions of dollars when the economy is at full employment competes with private sector demands for capital. Reduced access to capital diminishes private-sector investment, thereby reducing growth in productivity and the standard of living. This unhealthy mix is only made worse by a heavy reliance on anti-growth tax increases to address the fiscal problems.
Thank you and I look forward to your questions.
