


Testimony
September 10, 2020
The Need for Financial Aid to America’s States and Territories During the Pandemic: Supporting First Responders, Assisting Schools in Their Efforts to Safely Educate, and Preventing Mass Layoffs
*The views expressed here are my own and do not represent the position of the American Action Forum. I am indebted to my colleague Gordon Gray for many valuable conversations.
Chairwoman Waters, Ranking Member McHenry, and Members of the Committee, thank you for the privilege of participating in this hearing on financial aid for states and territories during the pandemic crisis. In this short testimony, I want to make three simple points:
- The recession induced by the coronavirus pandemic has been dramatic and rapid, potentially disrupting the tax and other revenue streams for state and local governments;
- States and localities faced the brunt of the public health crisis, incurred costs for first responders, health professionals, and other direct impacts of the COVID-19 pandemic; and
- This recession is like no other, and historical relationships between the economic cycle and state-local finances will not provide good guidance for the financial needs of the sub-federal sector.
Let me discuss these in turn.
The COVID-19 Recession Is Sharp and Rapid
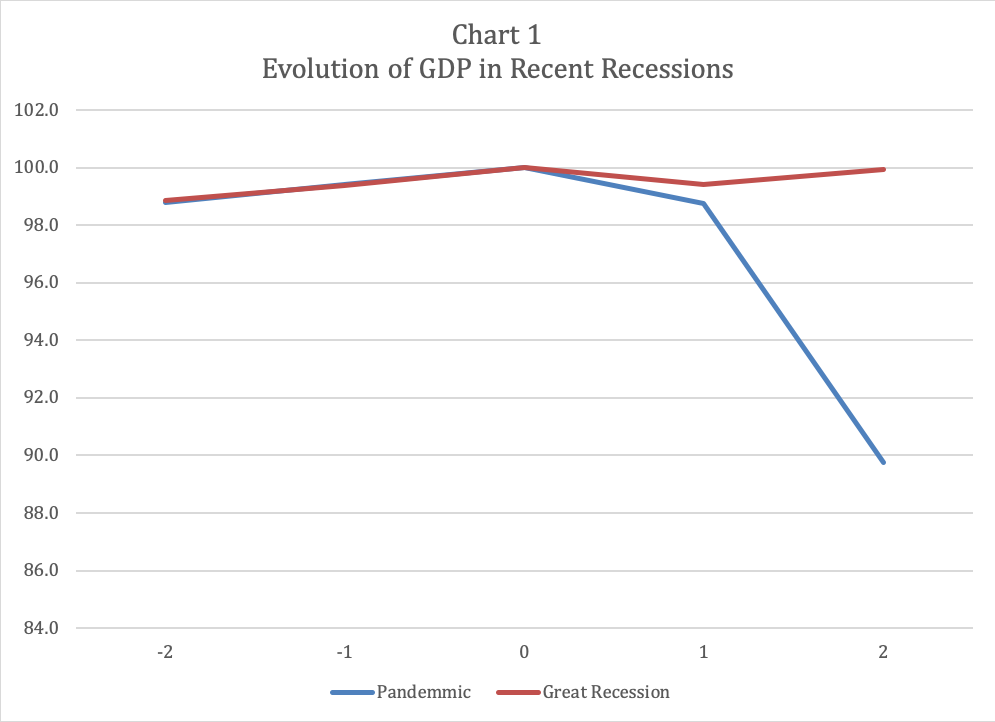
The power of the COVID-19 Recession is shown in Chart 1, which compares this recession with the Great Recession. For each cycle, the chart displays two quarters of data (labelled as -2 and -1) leading up to the business cycle peak (labelled 0, and as identified by the National Bureau of Economic Research) and two quarters of recession data. The data are gross domestic product (GDP), measured relative to its value at the peak quarter.
As one can see, economic growth leading to the peak quarter is essentially identical in both business cycles. The speed and depth of decline in this recession, however, is dramatically greater. GDP had already fallen 10 percent from the peak in the 2nd quarter of 2020, and there is every reason to expect that 3rd quarter GDP will rise substantially from this low. In contrast, the peak-to-trough decline in the Great Recession was 4 percent and it was not reached until the 2nd quarter of 2009, six quarters after the business cycle peak.
One might be tempted to conclude that state-local budgets will be the mirror image of Chart 1, but this conclusion would ignore important differences in the mechanics of the recessions.
The Composition of this Recession Is Different
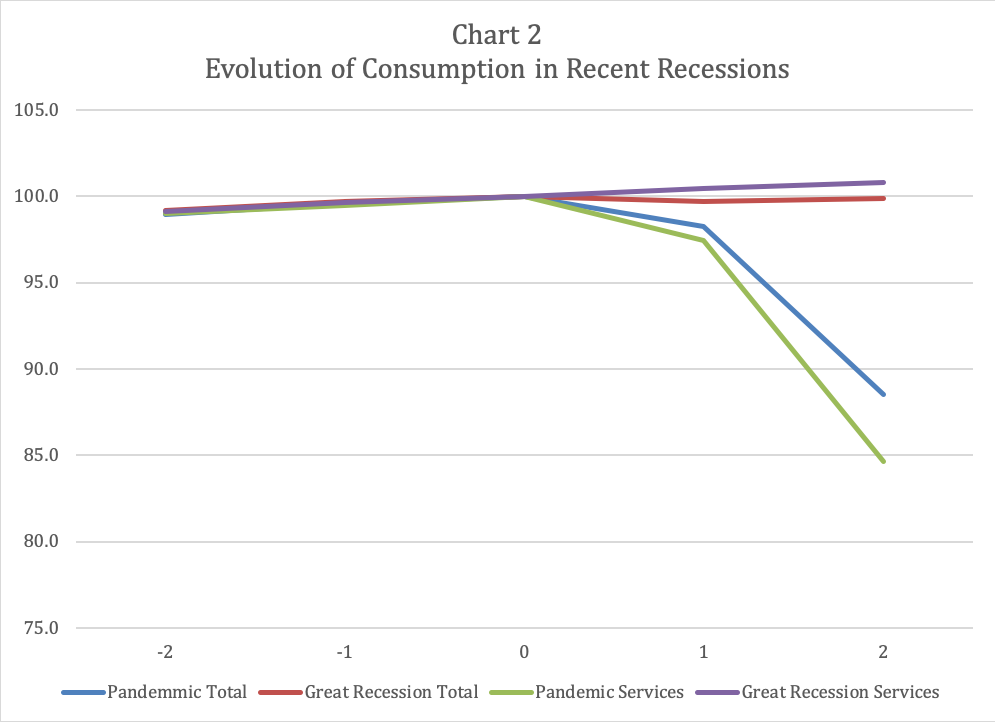
The sharp nature of the downturn is not the only distinguishing feature of this recession. The unique characteristic of this recession is the sharp downturn in household spending – measured by personal consumption expenditures (PCE). As one can see in Chart 2, total PCE fell by even more than overall GDP, 11.5 percent, and in direct contrast to the Great Recession where spending showed no decline. At the heart of the spending pullback is the demand for services; personal consumption spending on services falls even more dramatically – down roughly 15 percent – in Chart 2, in contrast to rising during the Great Recession. This difference merits further investigation.
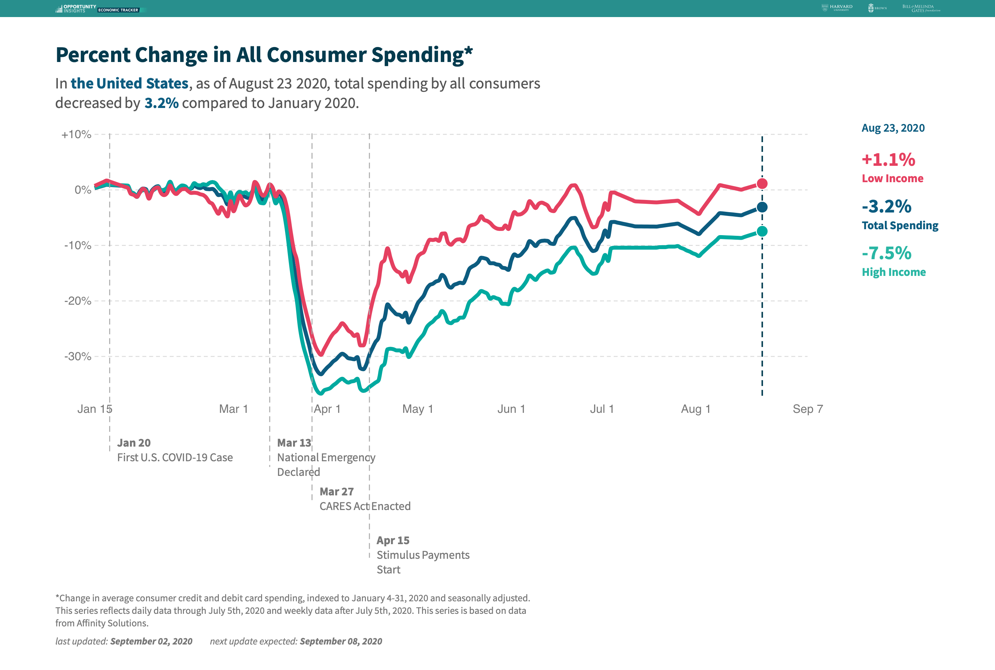
To do so, it is useful to review two charts from Chetty, et. al. The first, below, shows real-time data on consumer spending by quartile and carries three major lessons. The first is the same lesson as Chart 2: The onset of the recession was driven by a sharp drop in spending, even though there had not been any decline in income. This is a very different mechanism than was common in 20th-century business cycles (which were income-driven) and 21st century business cycles (which thus far have been driven by financial bubbles).
The second lesson is that the sharp pullback in spending was largely due to high-income households. As the chart shows, spending in the top quartile fell much more sharply (31 percent compared to a year earlier) in late March than in the bottom quartile (23 percent). The COVID-19 recession emanated from more affluent Americans; responding to it should reflect this fact.
The final lesson is that federal transfers – checks to individuals and children, pandemic unemployment insurance – shored up the finances of lower-income consumers to such a degree that by mid-August their spending was up by roughly 1 percent compared to January 2020, while higher-income families’ spending was down by 7.5 percent.
Why? Unlike the previous recession, the big cutbacks were not in big-ticket durable items or other non-durable goods. Instead, the diminished purchases of services shown in Chart 2 is responsible for two-thirds of the decline. People stopped flying (transportation services), staying at hotels (housing services), attending concerts and movies (entertainment services), and so forth. The issue was the fear of individuals to participate in anything that involved personal contact. This fear produced the downturn, which was exacerbated by the lockdowns that occurred later.
A slightly more detailed examination of the data reveals that spending fell primarily among high-income households for in-person services (e.g. restaurants) and that these services were produced by low-income workers in small business in these high-income areas.
History May Be a Poor Guide to State-Local Finances
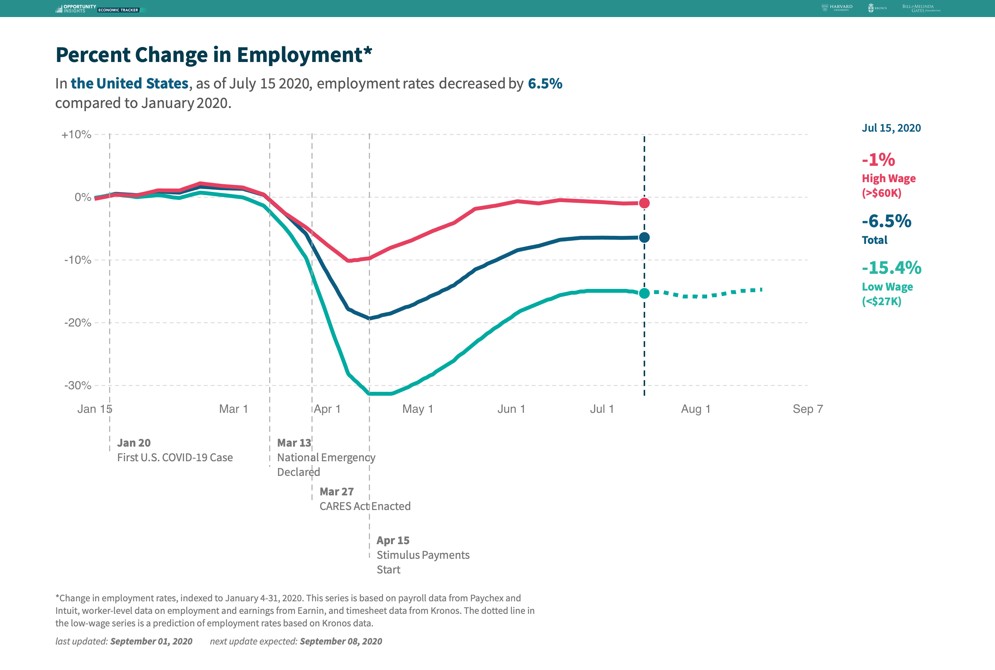
Because of the sharp differences in the mechanics of the recession, one may suspect that historical relationships between measures of the cycle (e.g., the unemployment rate) and state and local finances may not be a good guide to current conditions. To begin, this recession has been concentrated on low-wage workers, as these are disproportionately represented in service industries that have been at the center of the downturn. The chart below from Opportunity Insights highlights the damage done to low-wage labor markets (and also the relative recovery of high-wage employment).
Next, the scale of the Coronavirus Aid, Relief, and Economic Security (CARES) Act will have direct impacts on state-local finances. The combination of Paycheck Protection Program funds and unemployment compensation will provide taxable income to states and localities. In addition, recessions are typically accompanied by equity-market slumps. In this case, the opposite is true, which will support the realization of taxable capital income. Finally, housing markets have held up or risen during the recession. These factors may be behind the fact that personal income taxes for state-local governments were down only $0.1 billion in the 2nd quarter, corporate income taxes declined only $8.3 billion, and property taxes rose $4.1 billion.
Finally, as noted earlier, the decline in spending has been concentrated in services. Since most services are untaxed, the decline in sales tax revenues may be mitigated as well. Sales taxes were down $42.5 billion in the second quarter.
Thank you and I look forward to your questions.
