Weekly Checkup
May 14, 2021
An Opportunity for Bipartisan Drug-Pricing Reform
A few weeks back, when the Biden Administration outlined its much-anticipated American Families Plan, it was notable that the president did not include pharmaceutical price reforms in the proposal. At the time, I argued that even though House Democrats would certainly try to insert their drug legislation (H.R. 3) into the reconciliation package, Biden’s decision to leave it out would embolden moderate Democrats to withhold their support. Sure enough, last week 10 House Democrats sent a letter to Speaker Pelosi pressing for more limited, bipartisan action on drug prices. But there still remains a real opportunity for drug-pricing reform now.
Given the slim Democratic majority in the House, Pelosi can only afford to lose two members of her conference on any piece of legislation. Further, the only way to get her ambitious—and destructive—drug policies enacted is to use the budget reconciliation process to bypass an all but certain Senate filibuster. House Democrats hope that, despite Biden’s stated preference not to include drug policy in the reconciliation packages, including H.R. 3 in a House-passed reconciliation package could pressure moderate Democrats in the Senate to go along with the reforms. If only three of the 10 House Democrats who signed the May 3 letter refuse to support a package that includes H.R. 3, however, Pelosi will be unable to send it to the Senate.
These moderate Democrats do see a path forward, however, embracing policy ideas that have already attracted broad bipartisan support—for example, reforming the Medicare Part D drug benefit to realign incentives and put a hard cap on beneficiaries’ out-of-pocket costs. AAF’s Team Health first proposed such a restructuring of the Part D benefit back in 2018, and since then virtually every major piece of proposed drug-price legislation has included some variation on that proposal, including both H.R. 3 and the Republican alternative, H.R. 19. In addition to capping beneficiary costs, these reforms would amend the benefit design by reducing the federal government’s reinsurance liability, incentivizing insurers to control drug costs by increasing their liability throughout the benefit, and decreasing drug manufacturers’ incentives for higher prices by lifting the existing cap on their liability for drug costs in the catastrophic phase.
Each version of this proposal has varied to a degree, primarily in exactly how much of the costs associated with the changes should be borne by drug makers versus insurers, but there is strong bipartisan agreement around the basic structure. Further, as originally outlined by AAF, analysis from in 2018 found the changes could save the federal government between $23.4 billion and $30 billion over 10 years, while total costs to beneficiaries could be reduced between $400 million and $7.8 billion depending on how the dials are adjusted. The biggest obstacle to these reforms is the likelihood that they would result in a small increase in monthly Part D premiums for beneficiaries. In effect, most beneficiaries would see their premiums increase by roughly 50 cents a month, while some beneficiaries—those with the highest drug costs—would see significant savings in their out-of-pocket costs.
The opportunity to force drastic and damaging changes on the U.S. pharmaceutical system that progressives are seeking appears to be evaporating. But there is a real opportunity to make meaningful, bipartisan reforms to Medicare’s drug benefit, if Speaker Pelosi is willing to seize it.
Podcast: TRIPSing over IP Protections for COVID-19 Vaccines
AAF’s Christopher Holt and Tom Lee examine the impact of waiving intellectual property protections for COVID-19 related drugs and products.
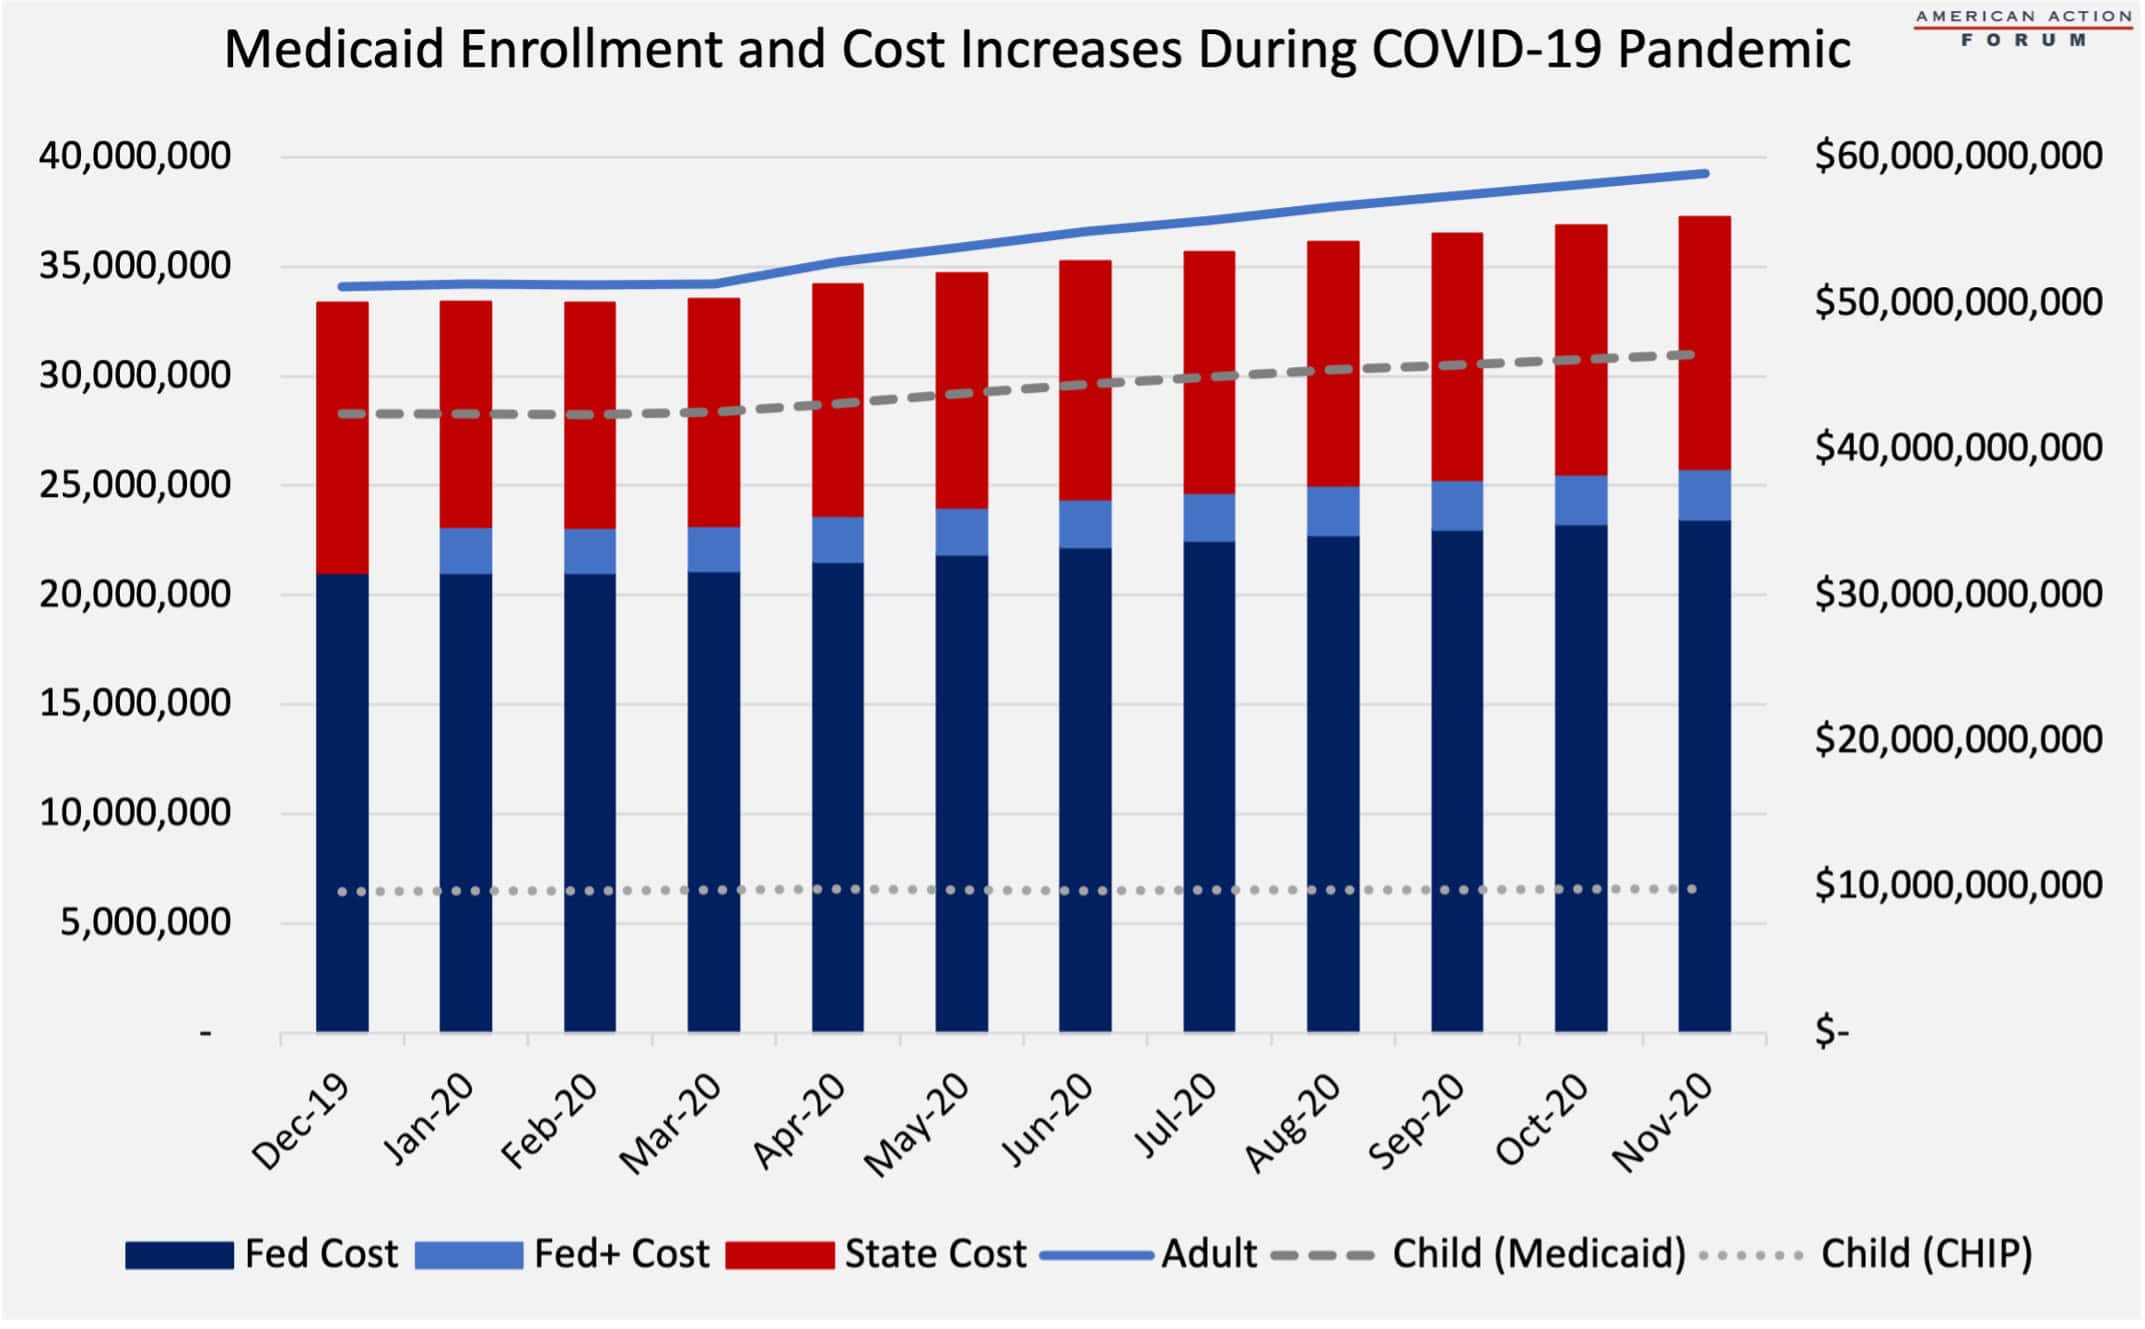
Chart Review: Medicaid Enrollment and Costs
Tara O’Neill Hayes, Director of Human Welfare Policy
Amid the economic fallout of the COVID-19 pandemic, Medicaid enrollment has increased as people have either lost job-based insurance or their income has fallen low enough to qualify for Medicaid. As shown by the chart below, enrollment increases were primarily driven by adults, increasing 15.3 percent from December 2019 to November 2020. Enrollment among children increased at just over half that rate at 8.2 percent. This discrepancy indicates that more childless adults lost health insurance coverage or income than adults with children, consistent with employment data from the Bureau of Labor Statistics.
With enrollment increases come cost increases. Overall, costs have increased an estimated 12 percent from December 2019 to November 2020. As a result of changes passed in March 2020 to ease anticipated state budget burdens, the federal government is bearing an additional 6.2 percent of the total costs for the duration of the pandemic, retroactive to the beginning of the first quarter in which the pandemic was declared. This change has led to the federal government paying nearly 70 percent of all Medicaid costs for the duration of the pandemic. State costs, on the other hand have decreased by an estimated 7 percent since December 2019.
Source: Centers for Medicare and Medicaid Services
Video: Why a TRIPS Waiver Will Not Boost Production
AAF’s Christopher Holt explains why waiving intellectual property protections for COVID-19 vaccines will not boost distribution in developing countries.
Tracking COVID-19 Cases and Vaccinations
Jackson Hammond, Health Care Policy Analyst
To track the progress in vaccinations, the Weekly Checkup will compile the most relevant statistics for the week, with the seven-day period ending on the Wednesday of each week.
| Week Ending: | New COVID-19 Cases: 7-day average |
Newly Fully Vaccinated: 7-Day Average |
Daily Deaths: 7-Day Average |
|
May 12, 2021 |
35,442 |
737,727 |
591 |
|
May 5, 2021 |
46,389 |
1,339,138 |
659 |
|
April 28, 2021 |
52,941 |
1,384,338 |
633 |
|
April 21, 2021 |
63,082 |
1,447,528 |
689 |
|
April 14, 2021 |
70,027 |
1,698,266 |
714 |
|
April 7, 2021 |
64,596 |
1,536,835 |
629 |
|
March 31, 2021 |
63,726 |
1,338,231 |
822 |
|
March 24, 2021 |
57,473 |
944,100 |
857 |
|
March 17, 2021 |
53,488 |
1,006,580 |
939 |
|
March 10, 2021 |
55,141 |
940,131 |
1,347 |
|
March 3, 2021 |
62,609 |
898,202 |
1,635 |
|
Feb. 24, 2021 |
66,587 |
830,760 |
1,978 |
|
Feb. 17, 2021 |
76,566 |
733,764 |
2,065 |
|
Feb. 10, 2021 |
103,176 |
689,843 |
2,620 |
|
Feb. 3, 2021 |
134,050 |
475,178 |
2,872 |
|
Jan. 27, 2021 |
161,510 |
330,632 |
3,229 |
Sources: Centers for Disease Control and Prevention Trends in COVID-19 Cases and Deaths in the US, and Trends in COVID-19 Vaccinations in the US
Note: The U.S. population is 332,328,360.
Worth a Look
New York Times: Many Unvaccinated Latinos in the U.S. Want the Shot, New Survey Finds
Kaiser Health News: Covid Testing Has Turned Into a Financial Windfall for Hospitals and Other Providers