Weekly Checkup
January 24, 2020
Certificate-of-Need, the Hangnail of Health Policy
Inaction in the face of evidence is a recurring problem in public policy. On the docket for this week is scrutinizing a pernicious collection of legislation known as Certificate-of-Need (CON) laws. It seems that despite 40 years of mounting evidence to their futility, we can’t seem to get rid of them.
For those new to this subsection of health policy, CON is a (mostly) state-level regulatory process that aims to restrain health expenditures, improve and maintain quality of care, and ensure adequate supply of health care resources, especially for indigent populations. This is done by regulating entry into various aspects of the industry by requiring providers to prove that a “need” for their service exists within a certain geographic area. Currently, 35 states and the District of Columbia have CON laws, with 3 others having similar variants.
The problem is CON laws fail in their stated goals. Instead of ameliorating costs and improving quality, it promotes market consolidation and limits the supply of critical services, achieving the opposite results they seek to accomplish.
Starting at a broader level of impact, analysis indicates CON legislation is a path to higher health care costs, diminished access to care, and reduced competition. In a 2015 paper in Antitrust, then-commissioner on the Federal Trade Commission Maureen Ohlhausen observed that while it has been difficult to measure the benefits of CON law accurately, the downsides are far easier to understand. By inhibiting the ability of new players to enter the health care market and prioritizing incumbent providers, “these laws are actually restrictions on output, and output restrictions restrain the social benefits of free market competition.” This opinion is backed by a litany of research out of the Mercatus Center demonstrating that, largely through reduced competitive forces, CON laws are associated with fewer overall hospitals (particularly rural hospitals), increases in total health spending, and inadequate supplies of health care resources, among other findings.
To see the implications of this framework for specific health services, one need not look further than nursing homes. While a sane person would never dream of preventing new hotels or restaurants in a locality due to a lack of “need,” nursing homes are one of the most consistently restricted health services nationally. According to David Grabowski in Health Affairs, the research clearly indicates that nursing home CON regulations lower access and diminish the quality of care. Maybe this outcome contributes to recent findings that the majority (56 percent) of seriously ill hospitalized adults are “very unwilling” or would “rather die” than permanently live in a nursing home. And if you think that isn’t bad enough, you should see what these laws do to imaging services, arguably the most important diagnostic tools providers have at their disposal.
Despite the repeal of the federal mandate for CON laws in 1986, these things keep hanging around like my winter cold. The substantial benefits to incumbent providers certainly don’t help, yet it’s apparent that short-term losses for a few providers may produce long-term gains for whole communities. We just need to get out of our own way.
Chart Review: The Effectiveness of Bundled Payments in Medicare Fee-for-Service
Andrew Strohman, Health Care Data Analyst
In an effort to drive down costs, Medicare uses a system of lumping payments for different services together into one bundle. Under the Inpatient Prospective Payment System (IPPS), Medicare reimburses providers for fee-for-service (FFS) beneficiaries within a diagnosis-related group (DRG). These payments are determined by grouping the principal diagnosis, up to 25 additional diagnoses, and up to 25 procedures performed during the patient’s hospital stay into one consolidated price.
The chart illustrates differences between the weighted average of charges covered by Medicare, when the charges are considered separately and then summed, and the amount actually paid out to providers, both in total and just by Medicare. The weighted average for all covered charges (charges covered by Medicare) across all DRGs was $58,781. Total payments, however, average only 23 percent of covered charges, while Medicare payments account for only 20 percent. Medicare payments account for, on average, 84 percent of total payments, with the difference made up by third-party payments and individual co-pays and deductibles. The disparity between covered charges and total payments suggests the IPPS model is able to drive down inpatient costs for Medicare FFS beneficiaries. What remains unclear is its impact on reimbursement rates in the larger health insurance market including Medicare Parts B and D and private insurance.
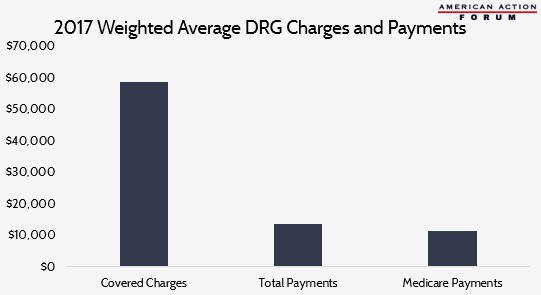
Data obtained from CMS
Worth a Look
New York Times: Major Insurers Pledge $55 Million to Try to Lower Generic Drug Prices
FierceHealthcare: Amazon files trademarks for its pharmacy business in overseas markets