Weekly Checkup
October 18, 2019
Don’t Believe Everything You Read in CBO Cost Estimates
Drug prices continued to drive the health policy debate this week. First, we received a new version of Speaker Pelosi’s drug pricing bill (H.R. 3), aimed at gaining the support of progressive members. This was followed by a trio of hearings on the legislation including the first markups of the legislation. Less noticed, however, was the Congressional Budget Office’s (CBO) preliminary analysis of part of the bill’s impact, released last Friday.
According to CBO, Title I of H.R. 3 will save the federal government $345 billion over 10 years. That’s hardly surprising, as AAF President Douglas Holtz-Eakin explained earlier this week: If you combine price fixing with extortion, backed by federal power, you can absolutely force prices down. As CBO acknowledged, its predictions of the impact of H.R. 3 on future innovation are far less certain. CBO estimates that the pharmaceutical industry will lose between $500 billion and $1 trillion in revenue over the next decade as a result of the policies in Title I alone. Yet CBO expects this to translate to a reduction in new drugs of only 8 to 15 over that same period—a mere 4 percent reduction. In other words, CBO is saying that federal spending will be greatly reduced, drug prices will be lowered, and there will still be upwards of 300 new treatments approved by the Food and Drug Administration (FDA). Lower costs, improved access, a slight reduction in innovation, and sticking it to drug makers as a bonus. It seems like a great deal, but CBO’s math here betrays some suspect assumptions.
Studies have found the average cost of bringing a new drug to market is just shy of $2.9 billion. CBO is projecting a loss in revenue for drug makers that is the equivalent of the cost of developing between 172 and 345 new drugs. The FDA approves an average of 33 new drugs each year, or 330 drugs over the next decade. So, to be clear, CBO is saying the reduction in revenue could eclipse the cost of producing all the new drugs that would be expected to be approved over the next decade.
Now, it’s reasonable to assume that the lost revenue CBO projects will not be made up for exclusively in reduced spending on research and development (R&D). Pharmaceutical manufacturers will absorb that lost revenue in myriad ways. But it would be foolish to assume that the effect of that lost revenue would only be limited to the industry’s profits. That’s simply not how economics works. It’s also reasonable to think, though CBO doesn’t say if it assumed this, that the existing pipeline of drugs—and certainly those in the first half of the 10-year window—would be only marginally impacted by the loss of revenue because much of the R&D spending has already occurred. In other words, the effect on innovation would very likely be more dramatic outside the time period CBO is considering. But even accounting for the limited impact of the policies on drugs already in development, and the reality that the lost revenue will not be exclusively born by the industry’s R&D, a projection of 8 to 15 fewer new treatments over the next 10 years is staggeringly low.
In fairness CBO notes that its “analysis of the bill is not complete,” and that the projection of 8 to 15 fewer drugs is a “preliminary estimate.” CBO will have to provide a final estimate of H.R. 3 that encompasses the entirety of the bill before it comes to the floor, and one can expect that analysis to provide a robust explanation of how CBO calculates its effect on innovation.
Even if CBO’s upward estimate of $1 trillion in lost revenue comes to fruition, drug makers will certainly not stop R&D altogether, so there is no chance that all drug development would cease. It’s also clear, however, that the impact of H.R. 3 on innovation will be substantially higher than reducing new treatments by just 8 to 15 over the next decade.
Chart Review
Andrew Strohman, Health Care Data Analyst
A frequently highlighted issue in public health discourse is the disparity in maternal mortality rates in the United States compared to other developed countries. According to data obtained from Humanprogress.org, the United States also has among the highest rates of maternal morbidity among developed countries, defined as complications arising during pregnancy, childbirth, and the postpartum period. These complications range from ectopic pregnancy and miscarriage to maternal sepsis and eclampsia. When considering both maternal mortality and morbidity rates, however, it becomes clear the problem is much more significant and varied. Maternal morbidity and mortality rates in the United States are higher than our developed international counterparts. When looking at the difference between these values, there is also significant variation whether taken as absolute values or proportions. This may suggest a focus on a single maternal health metric across countries fails to account for genetic and socioeconomic heterogeneity between countries. Places such as Denmark tend to be more genetically homogeneous and have lower levels of socioeconomic inequality than places such as the United States. Due to this, factors such as genetic predisposition to cardiovascular disease and diabetes and other factors that may contribute to increased rates of cesarean sections among certain populations may have differential impacts on maternal morbidity and mortality based on the population of a country.
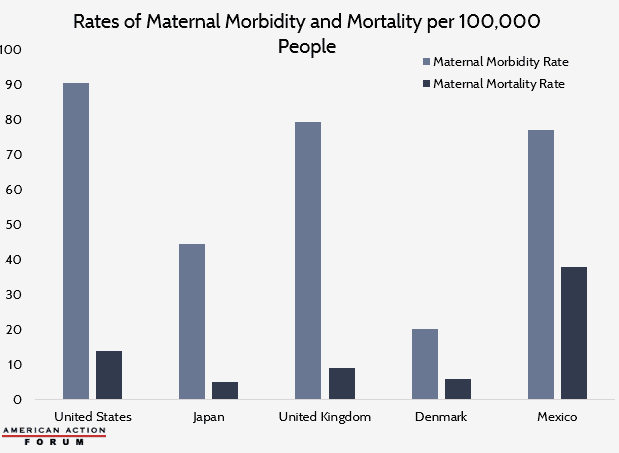
Data are obtained from Humanprogress.org
From Team Health
Daily Dish: CBO on Pelosi and Drugs – Douglas Holtz-Eakin, AAF President
Title 1 of H.R. 3 is a bad idea. Period. But the concern is that people will conclude it is not too bad.
Worth a Look
Kaiser Health News: Patients Eligible For Charity Care Instead Get Big Bills
Axios: The opioid epidemic will cost the U.S. as much as $214 billion in 2019