Weekly Checkup
May 20, 2022
Medicare at 60: Playing Musical Chairs with Sources of Coverage
President Biden embraced both a “public option” and lowering the Medicare eligibility age as part of his presidential campaign. Like most of this administration’s health policy agenda, however, these proposals have disappeared from the public discourse over the last year and a half. But this week, the Congressional Budget Office (CBO) released an analysis of lowering the Medicare eligibility to age 60, and there are some interesting takeaways and important caveats.
CBO’s top line numbers are relatively straightforward. Lowering the Medicare age to 60 would increase the federal deficit by $155 billion over six years (2026-2031), add 7.3 million people to the Medicare program, reduce the number of people in employer-sponsored insurance (ESI) by 3.2 million, move 1.8 million people from Medicaid to Medicare, and shrink the uninsured population by about 400,000 in 2031 relative to CBO’s baseline projections. So here are a few observations.
First, all of this is something of a fantasy. That’s not a criticism – prognosticating is hard. Yet CBO’s current baseline was released in July 2021 and made what were in hindsight overly optimistic assumptions about how the economy would recover from the pandemic. CBO will be coming out with an updated baseline soon, one that should better account for a less rosy than hoped for economic outlook. This analysis certainly would have been more useful if modeled against baseline assumptions tied more closely to reality.
Second, the deficit predictions seem plausible and are in line with an analysis the American Action Forum (AAF). AAF projected last fall that lowering Medicare eligibility to 60 would increase the deficit by $380 billion over 10 years, and by about $211 billion over the same six-year period as CBO’s estimate.
Third, expanding Medicare won’t meaningfully impact the number of Americans who are covered by insurance; instead, in CBO’s analysis, it merely shuffles around those who already have coverage. This is a recurring theme in recent policy proposals supposedly aimed at expanding coverage.
Fourth, building on the previous point, while much ink is spilled on the roughly 28 million Americans who remain without insurance coverage (though not always without coverage options), coverage-related policy proposals seem increasingly aimed not at increasing coverage, but consolidating it. Expanding Medicare, lifting the income limits on premium tax credits, and making them more generous all work to reduce the number of Americans enrolled in ESI and unsubsidized non-group coverage. Those aged 60–64 wouldn’t have to forsake their ESI but failing to sign up for Part B and Part D when they become eligible does the run the risk of incurring future penalties. Additionally, CBO expects that many small employers will drop insurance coverage for those newly eligible for Medicare, removing the choice of whether to stay in ESI or move to Medicare.
Policies that primarily move people from private health insurance to federal programs are effectively a backdoor approach to single payer. It might not be one single federal program, but if ultimately everyone is covered through a patchwork of federal programs, that produces largely the same outcome. In the final analysis, adding $155 billion to the deficit in order to play insurance coverage musical chairs doesn’t make a lot of practical sense.
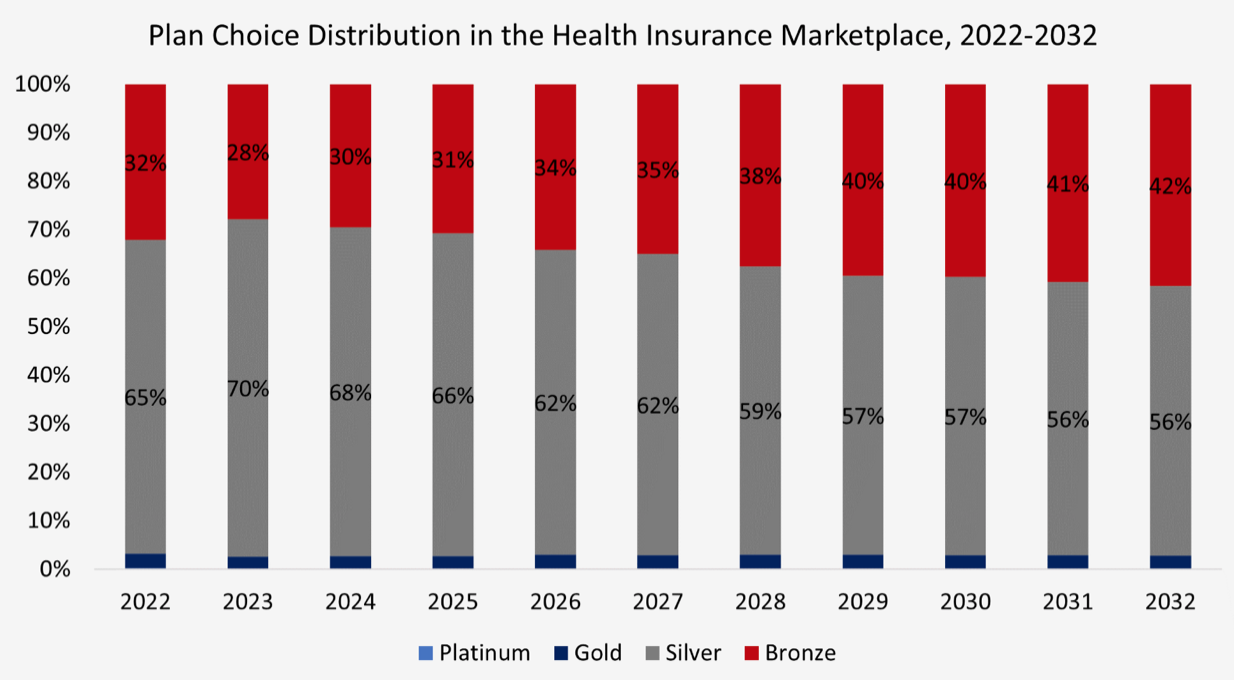
Chart Review: Plan Choice Distribution in the Health Insurance Marketplace, 2022-2032
Margaret Barnhorst, Health Care Policy Fellow
Earlier this week, the American Action Forum’s Center for Health and Economy (H&E) published its annual baseline estimates, which include 10-year projections of health insurance coverage, federal budgetary impacts, plan choice, and premiums for Americans under the age of 65, based on current law. As premiums and health care costs rise over the next decade, and consumers with less-generous subsidies adjust to higher premiums, H&E estimates that plans chosen in the Health Insurance Marketplace will shift toward lower cost options. As shown in the chart below, Silver plans will continue to make up the majority of the Marketplace throughout the budget window as cost-sharing benefits are only available for Silver plans in the Marketplace, though Silver plan enrollment as a percentage of all Marketplace plan selections will diminish. In 2022, 65 percent of all Marketplace plan selections were Silver, 32 percent were Bronze, roughly 3 percent were Gold, and less than 0.2 percent were Platinum. Plan selections for higher-cost Gold and Platinum plans will see roughly no change over the next decade, but as time passes and premiums rise, Silver plan enrollment will fall to 56 percent of all Marketplace plan selections in 2032, while Bronze plan enrollment will rise to 42 percent.