Weekly Checkup
November 4, 2022
The Best-laid Plans (and Premiums)
On November 1, open enrollment for the Affordable Care Act’s (ACA) Marketplace plans began (for most states and the federal exchanges)—and with that came the release of all the details and data about plan year (PY) 2023 premiums that health policy wonks need to keep themselves busy for weeks. Fortunately for readers, I’ve written a briefinsight covering the major top-line points about the PY23 premiums, which you can find here. Below, I’ll be summarizing the broad points of that insight.
In a reversal of a trend ongoing since 2019, Marketplace premiums increased this year. Before receiving the enhanced Advanced Premium Tax Credits (APTCs), all metal tiers across a range of scenarios saw premium increases, with Bronze plans, benchmark plans, and Silver plans all seeing increases ranging from around 4–5 percent. Gold plan premiums saw very minor increases, less than 1 percent, while Platinum plan premiums jumped by roughly 11–13 percent depending on the beneficiary scenario. None of this should be particularly surprising: Health care inflation is rising, with no plateau in sight. Plans need to account for the higher costs caused by increasing labor costs and higher service utilization rates.
Those are scenarios before the enhanced APTCs kick in, however. Once the enhanced APTCs are applied, some individuals will see their net premiums drop. For example, a family of four with a household income at 250 percent of the federal poverty level (FPL) will be paying 47 percent less than last year for the lowest-cost plan premium after APTCs. Yet this pattern doesn’t hold true for everyone. Across all HealthCare.gov enrollees, the average lowest-cost premium in PY23 will be 3 percent higher than in PY22, even after taking APTCs into account. Still, premiums across the board are lower than in PY19.
How did the ACA Marketplace manage to keep increases so low on the consumer side? The usual way: massive government subsidies. As a refresher, the American Rescue Plan Act temporarily dropped the percent of total household income that could be spent on premiums before becoming eligible for subsidies (in the form of APTCs) to 8.5 percent while expanding eligibility for APTCs to individuals making over 400 percent of the FPL. Those changes were then extended through 2025 by the Inflation Reduction Act, because there is nothing so permanent as a temporary government program. The Congressional Budget Office estimates that the enhanced APTCs will cost around $62 billion from 2023–2025. These artificially low premiums will be difficult for private insurers to compete with, potentially leading to more people leaving the private insurance market for cheaper rates on the exchanges. Of course, the premiums aren’t actually cheaper: Some of the costs have just been further shifted to the taxpayer. Until Congress decides to implement policies that will actually decrease health costs, we can expect to see the pattern of higher prices leading to higher taxpayer-funded subsidies of ACA Marketplace plans to continue well into the future.
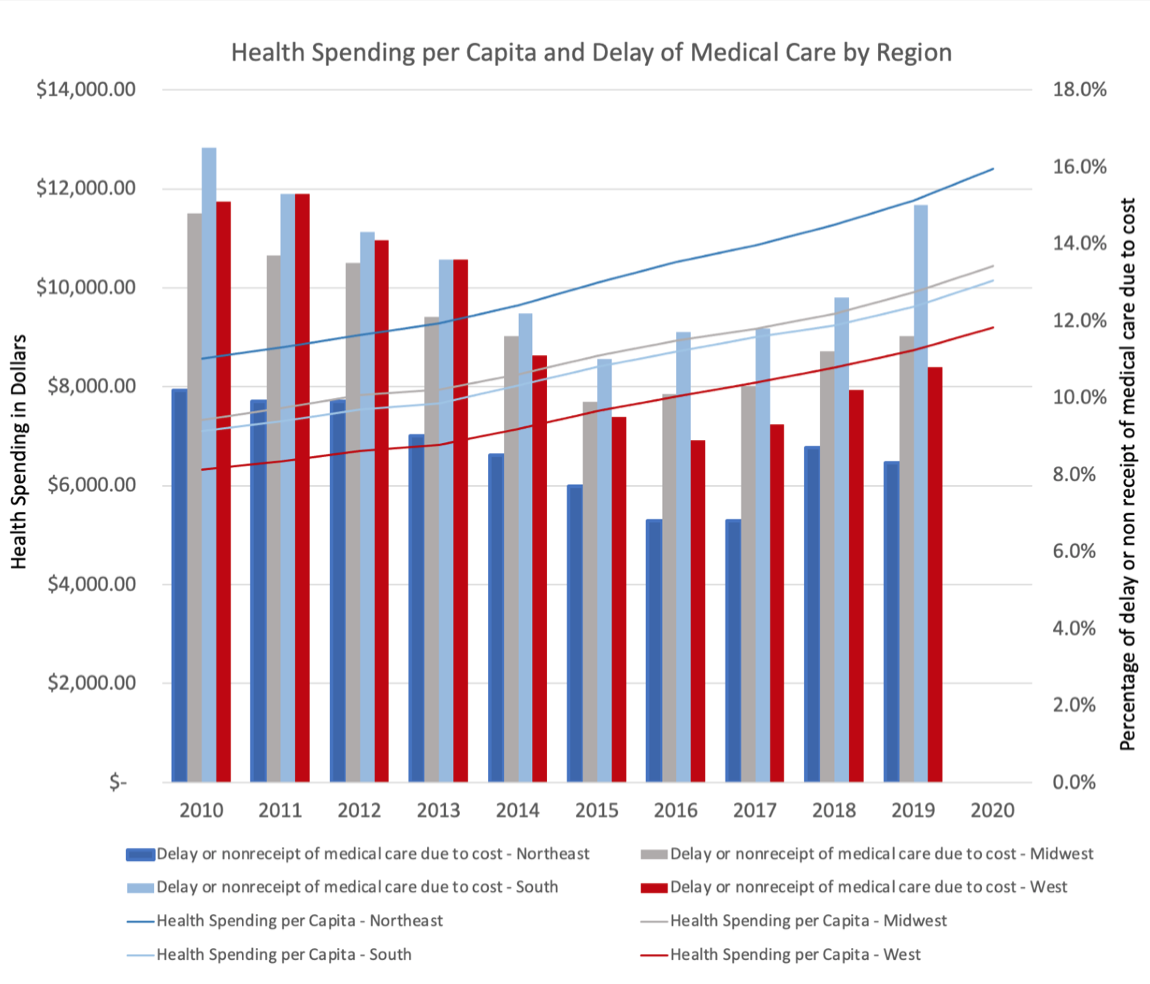
Chart Review: Health Spending and Delays in Care
Danielle Bartolotta, Health Care Policy Intern
When faced with less money to cover rising health care costs, many Americans across all income levels choose to delay care. As seen in the chart below, however, while health spending has risen steadily since 2010, the percentage of individuals delaying care due to rising costs did not increase for the first half of that decade. From 2010–2015, the percentage of people delaying care due to cost decreased, despite increasing health costs. Yet for the period 2015–2019, health spending and the percentage of those delaying care both increased. Of note, there is significant regional variation in the percentage of individuals who delay care. While the South and Midwest regions experienced their lowest incidence of delay in care in 2015, the West and Northeast did not experience similar lows until 2016 and 2017, respectively.
Data Sources: KFF State Health Facts Health Care Expenditures per Capita by State of Residence and NCHS National Health Interview Survey