Weekly Checkup
June 18, 2021
What Is the Status of the Pandemic?
This week Novavax announced that its COVID-19 vaccine is 90 percent effective at preventing infection after two doses and 100 percent effective at preventing moderate to serious cases and death in trials. The response in the United States appears to have largely been a collective yawn. All in all, it’s starting to feel like the pandemic is over, so another super-effective new vaccine isn’t hugely exciting. But as with many things, national averages mask variation, and even then the United States is hardly representative of the wider world. So just where are we in the fight against COVID-19? Let’s consider.
In late January, we began including a COVID-19 tracker at the end of the Weekly Checkup. The idea was to provide some measure for evaluating the state of the pandemic. Since January 27 we’ve tracked the 7-day average for new COVID-19 cases, newly fully vaccinated individuals, and COVID-19 deaths using daily figures collected by the Centers for Disease Control and Prevention (CDC). The numbers show about what you would expect. On January 27, there were 159,320 new cases, 334,691 individuals newly fully vaccinated, and 3,174 deaths. These figures were the high-water mark for new cases and deaths and the low-water mark for newly vaccinated. Wednesday of this week, as shown in the table below, the CDC reported a low (for our tracker) of 11,717 new cases and 282 deaths. There is nothing particularly surprising in those data points; overall COVID-19 cases are declining nationally, as are deaths. We’ve also known that after a rapid increase in vaccination rates between January and mid-April, the number of new fully vaccinated individuals has been steadily declining. But the drop in newly fully vaccinated from May 19—1,016,020—to June 16—459,717—is striking. In the last month, week-over-week vaccination rates have dropped by roughly 55 percent.
Overall, the U.S. numbers look good, though the country is unlikely to meet President Biden’s target of 70 percent vaccinated by the Fourth of July holiday. But as is often the case, national averages hide variation. For example, while 72 percent of Vermont residents have received at least one dose of vaccine, only 35.2 percent of Mississippi residents have had their first shot. Similarly, new cases of COVID-19 for the week ending June 13 increased by 101 percent over the previous week in Missouri, by 44.7 percent in Texas, and 41.5 percent in Arkansas. Of note, Vermont, the state with the highest rate of vaccinations, saw the second-highest spike in new cases, a 59 percent increase over the previous week. The total number of new cases in Vermont, however, was only 68 or 10.9 per 100,000 compared to 73.6 per 100,000 in Missouri. On the other end of the spectrum, new cases decreased by 47.1 percent in Washington, DC, 34.1 percent in Illinois, and 31.5 percent in Michigan.
In addition to variation across states and even localities, the global pandemic outlook varies widely from country to country. In England, where the new Delta variant has become the dominant virus strain, nationwide restrictions were extended for another month, and India last week saw the highest 24-hour death toll of the pandemic even as total new cases seem to be stabilizing and decreasing.
Amid all the variation, there are questions about what comes next for the United States. The country is returning to “normal” as vaccination rates increase, but vaccine hesitancy or even opposition is higher among the remaining unvaccinated population, meaning continuing vaccination gains will be harder to achieve. With new variants spreading and vaccination rates across the United States far from uniform, the improving national picture may belie a less rosy reality in particular states and regions.
Chart Review: Obesity in the United States
Jake Griffin, Health Care Policy Intern
The obesity epidemic in the United States has been attributed to many causes, including increases in both inexpensive, calorie-dense foods and sedentary lifestyles. From 1999-2000 through 2017-2018, obesity prevalence in the United States increased from 30.5 percent to 42.4 percent, according to data in a National Center for Health Statistics February 2020 data brief. As the chart below shows, there has been a steady increase in both Americans’ perceived ideal weight and self-reported actual weight between 1990-2020. Despite this continual increase in Americans’ weights, the percentage of Americans reporting as overweight or obese has declined from 48 percent in 1990 to 41 percent in 2020. These data suggest there is an increasingly large gap between how Americans perceive their weight in relation to the obesity scale, and where their weight actually falls on the obesity scale. The shift in Americans’ perception of what is considered a healthy weight and is considered overweight or obese may be to blame for this discrepancy. Future efforts to tackle the obesity epidemic will need to ensure that Americans have a fact-based understanding of where their weight falls on the obesity scale.
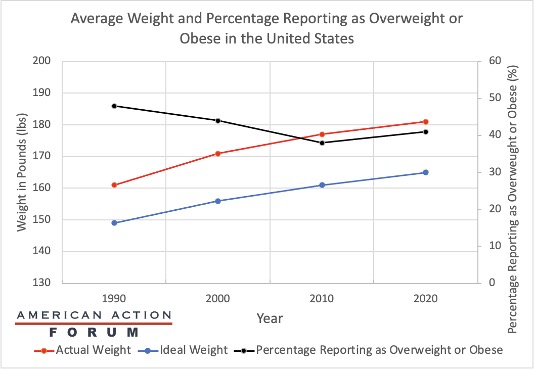
Sources: National Center for Health Statistics and Gallup
Tracking COVID-19 Cases and Vaccinations
Jake Griffin, Health Care Policy Intern
To track the progress in vaccinations, the Weekly Checkup will compile the most relevant statistics for the week, with the seven-day period ending on the Wednesday of each week.
| Week Ending: | New COVID-19 Cases: 7-day average | Newly Fully Vaccinated: 7-Day Average | Daily Deaths: 7-Day Average |
| 16-Jun-21 | 11,717 | 459,717 | 282 |
| 9-Jun-21 | 14,420 | 683,785 | 360 |
| 2-Jun-21 | 14,936 | 490,837 | 347 |
| 26-May-21 | 22,365 | 781,802 | 431 |
| 19-May-21 | 28,042 | 1,016,020 | 515 |
| 12-May-21 | 34,894 | 1,214,944 | 563 |
| 5-May-21 | 45,440 | 1,415,008 | 591 |
| 28-Apr-21 | 52,140 | 1,455,950 | 618 |
| 21-Apr-21 | 60,964 | 1,479,080 | 635 |
| 14-Apr-21 | 68,347 | 1,746,080 | 642 |
| 7-Apr-21 | 63,938 | 1,576,381 | 627 |
| 31-Mar-21 | 63,949 | 1,365,848 | 738 |
| 24-Mar-21 | 56,852 | 962,341 | 748 |
| 17-Mar-21 | 53,393 | 1,022,564 | 892 |
| 10-Mar-21 | 54,263 | 952,217 | 1,163 |
| 3-Mar-21 | 61,230 | 910,522 | 1,425 |
| 24-Feb-21 | 64,520 | 840,314 | 1,788 |
| 17-Feb-21 | 74,021 | 740,781 | 1,942 |
| 10-Feb-21 | 100,190 | 696,945 | 2,389 |
| 3-Feb-21 | 129,398 | 481,038 | 2,739 |
| 27-Jan-21 | 159,320 | 334,691 | 3,174 |
Sources: Centers for Disease Control and Prevention Trends in COVID-19 Cases and Deaths in the US, and Trends in COVID-19 Vaccinations in the US
Note: The U.S. population is 332,428,783.
From Team Health
Health and Economy Baseline Estimates
The Center for Health and Economy has released its updated baseline predictions for insurance coverage, the federal budget, and the premium landscape.
Worth a Look
Axios: HHS to invest $3 billion for antiviral pills against COVID-19
Reuters: Britain extends approval for rapid COVID test after U.S. rebuke