Weekly Checkup
June 23, 2023
You’re Not on the List: PBM Drug Exclusions
The Senate Finance Committee released bipartisan legislation that would prohibit pharmacy benefit managers (PBMs) from making profits on the price of a drug as connected to discounts, rebates, or other fees. Instead, PBMs would be required to charge plan sponsors a flat dollar amount, an attempt to disconnect PBM profit incentive from a drug’s price. Several congressional committees, including the Senate Committee on Health, Education, Labor & Pensions, have also proposed bipartisan transparency solutions intended to illuminate PBM business practices with their clients, plan sponsors. While these proposals are designed to incentivize PBMs to include more low-cost drugs in their formularies, they are unlikely to directly benefit patients.
If Congress’ proposed reforms fail to achieve the desired results, it may be that legislators don’t fully understand the role PBMs play in the prescription drug chain. PBMs are third-party administrators that work on behalf of plan sponsors to provide pharmacy benefits to beneficiaries, which includes designing a prescription drug formulary, creating a network of pharmacies for beneficiaries to visit, and reimbursing pharmacies for dispensing and purchasing a drug. In other words, PBMs work for plan sponsors with the objective of saving them money through negotiations with drug manufacturers.
To date, states have led the way on new PBM regulations – but that has resulted in a costly and onerous patchwork of reporting requirements. Moreover, these state laws have not lowered the prices patients pay at the pharmacy counter.
None of this is to say that Washington shouldn’t work to increase transparency to ensure PBM activity doesn’t harm patients. For example, drug exclusion lists determined by PBMs – in which they recommend to plan sponsors a standard formulary which may exclude certain products – may limit patients’ choice at the pharmacy counter and raise costs. Of course, plan sponsors are not required to accept this formulary but may experience increased costs if they deviate from the recommendation. (PBMs are not shy about these lists, as CVS Caremark, Express Scripts and OptumRX post them publicly.) Adam Fein, CEO of the Drug Channels Institute, observed that from 2014–2022, a total of 1,357 unique medications faced exclusion for at least one year from one PBM. The chart below illustrates the increasing number of drug exclusions by PBMs since 2012.
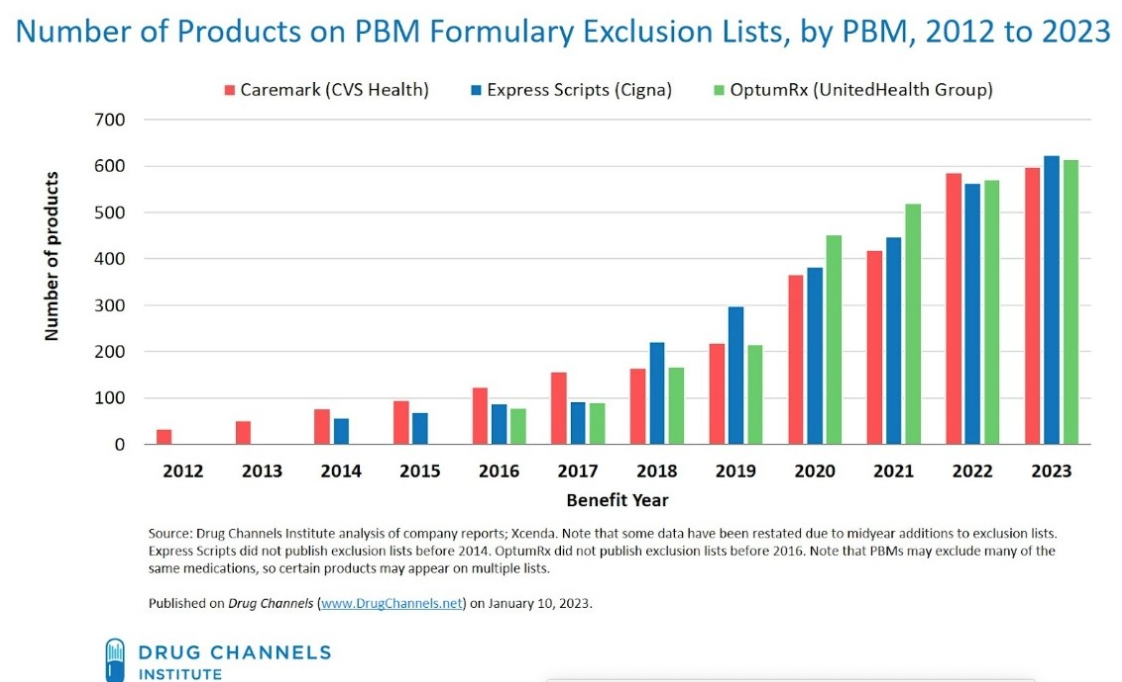
Are PBMs deciding that these drugs somehow aren’t cost-effective? That doesn’t seem to be the case. One study found that “cost-effectiveness does not correlate with a drug’s excluded or recommended status” on a PBM’s standard formulary. Moreover, the same study found that PBMs don’t necessarily even cover what would be considered the most cost-effective brand-name drug available. One explanation for these lists is that PBMs negotiate volume-based discounts (the more product sold, the greater the rebates) and may exclude products that do not necessarily offer the largest discount to the PBM or plan sponsor. But surely there’s more to this story.
For Congress to legislate effectively requires a better understanding of how PBMs’ standard formularies impact patients’ access to affordable medications. Legislation that mainly imposes new and costly financial regulations and contracting terms is unlikely to lower costs at the pharmacy counter.
Chart Review: Maternal Mortality Rate in California Versus the U.S. Rate
Sophia Marasco, Health Care Policy Intern
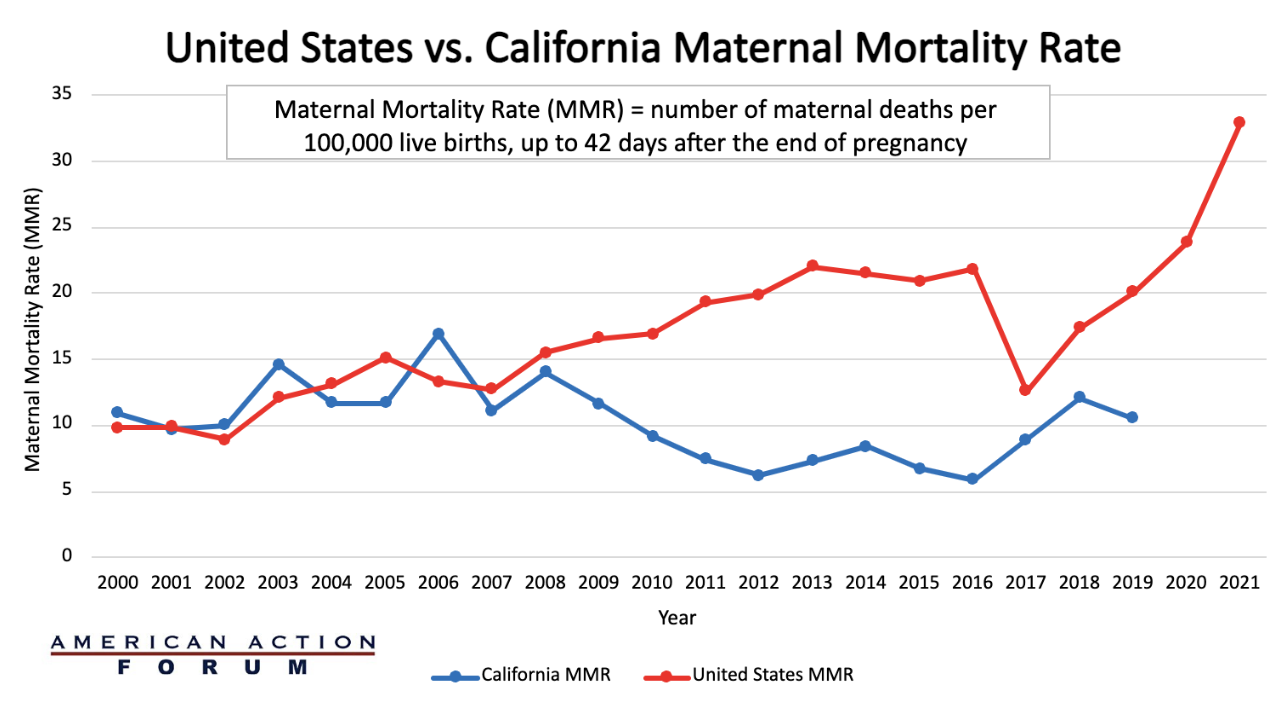
The United States maternal mortality crisis continues to worsen. As the chart below demonstrates, the U.S. maternal mortality rate (MMR) in 2021 was 32.9 deaths per 100,000 live births at 42 days post-pregnancy, compared to 17.4 in 2018, an increase of 89 percent. Moreover, when disaggregated by race, the MMR for non-Hispanic Black women was 69.9 per 100,000 in 2021 – 2.6 times the rate for non-Hispanic White women. Some state experiments have had notable success in reducing the MMR. California, for example, in 2006 initiated the Maternal Quality Care Collaborative(CMQCC) a “collaboration between hospitals, clinicians, state agencies, insurers, patient and public groups, and other stakeholders that required four key components: linking public health surveillance and proactive action; mobilizing collaborative public and private partnerships; creating a data system with low administrative burden to support improvements; and establishing multi-stakeholder interventions that connect providers with relevant health services.” As the chart below demonstrates, over the next decade, California’s MMR declined 65 percent. Further research will be necessary to determine what elements from this successful state program can be applied on a larger scale.
For more information on the CMQCC case study: Maternal Mortality in the United States
Sources: CDC, ICD-10 cause of death classification for obstetric deaths (codes A34, O00-O95, O98-O99), California death certificate data (1999-2013), and California pregnancy status errata file (2014-2019).
*No MMR data available from California since 2019, and the United States since 2021.