


Research
May 26, 2016
Union Membership and Economic Growth
Executive Summary
For more than three decades, union membership has steadily declined in the United States. What does this mean for the U.S. economy and all of its workers? To answer this question, we analyze the economic implications of union membership across all 50 states and the District of Columbia. In particular, we estimate the impact of union membership on real economic growth, job growth, average weekly earnings growth, total wage earnings growth, and business establishment growth. We test the impact of union membership on these economic indicators overall and for a range of business establishment sizes. Indeed, we find that union membership hinders economic growth, particularly for small and medium-size businesses. As a result, the decline in union membership likely increased economic, job, and earnings growth. In particular, our results indicate that the decline in the union membership rate from 2004 to 2013 benefited the United States with:
- Greater economic growth – an additional $115.9 billion in real economic output,
- Faster job creation – 393,189 additional jobs,
- Greater average worker earnings – an additional $6.08 per week in average earnings, and
- Greater total labor earnings – an additional $35.1 billion in total wage earnings.
Introduction
With union membership steadily declining since the 1980s, federal officials in recent years have issued decisions and regulations aimed to facilitate collective bargaining. These include the National Labor Relations Board’s (NLRB) decisions to shorten the union election process, allow for “micro” unions, and fundamentally change the definition of “joint-employer.” Meanwhile, the Department of Labor (DOL) is introducing the “Persuader Rule” which will make it more difficult for businesses to consult with outside legal experts when facing a union organizing campaign.
It is clear that policymakers and labor advocates are trying to reverse the more than three-decade decline in union membership and make collective bargaining far more prevalent in the United States. But, what are the macroeconomic implications of union membership? In this paper, we examine this question by analyzing the relationship between state union membership rates and state economic, job, average weekly earnings, total wage earnings, and business establishment growth rates. In short, we find that union membership restrains economic growth, job growth, and growth in worker pay. As a result, the overall decline in union membership between 2004 and 2013 may have been quite beneficial to workers and the economy. In particular, it led to at least an additional $115.9 billion in economic growth, 393,189 jobs, $6.08 in average weekly earnings, and $35.1 billion in total wage earnings.
In the following, we provide an overview of the long-term trends in union membership in the United States, discuss recent major regulatory changes enforced by the NLRB and DOL, describe the data and regression analysis we employ to examine the relationship between union membership and economic growth, and discuss our findings implications for economic, job, and wage growth.
Regulatory Changes that Facilitate Collective Bargaining
Over the last three decades, union membership has steadily declined in the United States. This trend is illustrated in Figure 1.
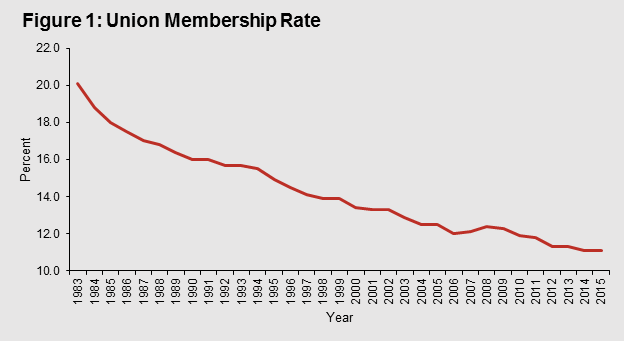
In 1983, 20.1 percent of all workers in the United States belonged to a union that negotiated wages and benefits on their behalf. By 2015, however, only 11.1 percent of all U.S. workers were union members. The decline has almost entirely been driven by a large decrease in private sector union membership. In 1983, union members accounted for 16.8 percent of private sector workers, and in 2015 they only accounted for 6.7 percent of workers. Public sector unions, meanwhile, remain quite prevalent among government workers. In 2015, 35.2 percent of government workers were union members, which is virtually unchanged from 1983.[1] Indeed, despite the prevalence of public sector unions in the U.S. government, labor unions today are not a major factor in the U.S. economy.
Facing this long-term trend, in recent years federal regulatory officials have implemented rule changes that facilitate collective bargaining. In particular, four major changes in labor regulations have occurred: workers can now organize in small or “micro-unions,” the required time frame for union elections is now much shorter, there is a new legal definition for “joint-employer” with regard to workers, and employers must now disclose funds paid to consultants or legal experts for advice when facing union organizing campaigns.
Micro-Unions
In 2011, the NLRB ruled that workers are allowed to organize in mini-bargaining units or micro-unions.[2] In other words, certain groups of workers within a business are now allowed to organize as their own unit. This can facilitate unionization because while traditional labor unions must get a majority approval from all workers at a company, micro-unions require support from far fewer employees. Initially after the NLRB ruling went into effect, there were signs that this regulation led to more union elections and a higher win rate in 2014. However, since micro-unions by their very definition are small, they did not appear to successfully grow the number of union members in the labor market.[3]
Representation-Case Procedures Rule
Taking effect in 2015, the NLRB’s Representation-Case Procedures rule made drastic changes to the union election process to give unions more tools to win elections. Among the many changes the NLRB made, employers must now provide unions with personal information of their workers, such as personal email addresses and phone numbers.[4] In addition, the rule substantially speeds up the election process. Prior to the rule, since 2010 an election took place an average of 38 days after the employer received a copy of the petition.[5] Under the rule, however, an election can occur in as little as 10 days after the employer receives a copy of the petition.[6] As a result, employers now have less time to make their case and it is easier for unions to win elections.
Joint Employers
In 2015, the NLRB fundamentally altered the legal definition of “joint employer” so that workers are more frequently identified as working for two separate companies. As a result, companies that utilize contractors and the franchise business model are now subject to more lawsuits and aggressive union campaigns. Since 1984 until 2015, the NLRB had held a firm as a joint employer only if it exercised direct control of employees in another business. For example, hiring, firing, wage, and hours decisions constituted direct control. This is not the case in franchise models, as all these tasks are left to the independent franchisee owner, not the franchisor. However, the NLRB reversed course. In a case known as “Browning-Ferris,” the NLRB formally broadened the definition of “joint-employer” so that a company could be considered a “joint-employer” if it has an indirect impact on another company’s workers’ employment and pay.[7] NLRB General Council Richard Griffin has already started using this new definition to take formal action against franchises. It issued 13 complaints involving 78 labor practice charges against McDonald’s USA and several McDonald’s franchisees, labeling them joint employers.[8]
Persuader Rule
Most recently, the DOL finalized its so-called “persuader” rule, which requires that businesses disclose any outside legal advice they receive when facing a union organizing campaign.[9] Moreover, the person providing the advice has to disclose all labor relations advice or services. This means that the outside legal adviser must report not only the “persuader” activities at a certain company, but possibly also all labor relations activities for any company. Many fear that this new requirement undermines attorney-client privilege. As a result, instead of disclosing their relationships, labor lawyers may simply decide to not provide “persuader” advice to any company that is facing a union organizing campaign.[10] Smaller businesses that do not have in-house lawyers will likely be subject to more collective bargaining agreements.
Methodology
In this paper, we estimate the relationship between state union membership rates and annual growth rates of various economic indicators, including real Gross Domestic Product (GDP), employment, average weekly earnings, total wage earnings, and business establishments. We examine this relationship for a range of business establishment sizes.
Data
Most of the data we use come from the Bureau of Labor Statistics (BLS)[11] with the exception of the real GDP growth rates, which originate from the Bureau of Economic Analysis (BEA).[12] We also employ state level home price data from the Freddie Mac House Price Index[13] and population,[14] education,[15] and state and local government finances data[16] from the Census Bureau. Our data set includes observations on all 50 states and the District of Columbia from 2004 to 2013.
Empirical Model
We utilize panel data to conduct a series of fixed effects regressions that assess the relationship between union membership rates and growth rates in various economic indicators – annual real GDP growth, job growth, average weekly earnings growth, total wage earnings growth, and business establishment growth—both overall and for a range of business establishment sizes.
We first perform a series of regressions to analyze the link between union membership and each economic indicator overall. Specifically, in these regressions we estimate the relationship between state union membership rates and the overall state annual growth rates in real GDP, jobs, average weekly earnings, total wage earnings, and business establishments from 2004 to 2013.
We also perform a series of regressions to estimate the relationship between union membership rates and annual growth rates in jobs, average weekly earnings, total wage earnings, and business establishments for each business size category in the BLS’s Quarterly Census of Employment and Wages. Specifically, we examine how state union membership rates relate to each of these economic factors for businesses with under 5 employees, 5 to 9 employees, 10 to 19 employees, 20 to 49 employees, 50 to 99 employees, 100 to 249 employees, 250 to 499 employees, 500 to 999 employees, and 1,000 employees or more.
These regressions are very similar to the first series of regressions, with one major difference: to examine the impact of union membership by business size, we pool the economic indicator data (i.e. jobs) for all business establishment sizes under one variable and insert categorical binary variables that indicate which business size is being examined. For instance, when estimating the impact of union membership on employment growth in establishments with under 5 workers, the binary variable representing that business category equals 1 and all other business binaries equal 0. We also include variables that interact each of those binary variables with the union membership rate in order to measure the impact of the union membership rate on the economic indicator in each business size category. As a result, for any particular business size, the union membership variable and the interaction term for that business size together capture the total effect of union membership on growth in employment, average weekly earnings, total wage earnings, and business establishments.
After evaluating the results of the model including business sizes, to more precisely isolate the relationship between union membership and job growth and total wage earnings growth, we estimate two more models that consolidate the business sizes into broader categories. First, for employment we consolidate business sizes into three categories – under 20 employees, 20 to 99 employees, and 100 employees or more. Second, for total wage earnings we consolidate business sizes into two categories – under 250 employees and 250 or more employees.
Finally, in each model, we control for several other state level variables that may influence economic growth, wage growth, business growth, and job growth. These include the natural log of the Freddie Mac House Price Index, the natural log of population, the percentage of the 25 years and older population with a bachelor’s degree or higher, and the natural log of local and state spending as a percentage of nominal GDP. We include the Freddie Mac House Price Index in order to account for the effect of the Great Recession, which took place from 2007 to 2009 and significantly lowered home prices during the time period we are analyzing. Additionally, the regression contains both state and year effects. The use of state effects controls for characteristics that vary across states, but not over time, and the use of year effects controls for factors that vary over time, but not by state. The year effects serve as an additional control for the macroeconomic forces during the 2004 to 2013 period we examine. We also cluster our standard errors to control for any analysis errors that may be correlated with the states over time as well as potential heteroscedasticity present in our data.
Results
Overall, we find statistically significant evidence that an increase in union membership is associated with a decline in state real GDP growth rate, job growth rate, average weekly earnings growth rate, and total wage earnings growth rate. In general, the impact of union membership is more harmful for workers in smaller business establishments than those in larger ones. Meanwhile, each of our tests on the relationship between union membership and the growth in the number of business establishments yields statistically insignificant results. So while we find that workers suffer from higher unionization, unions impact business growth minimally.
GDP
We find statistically significant evidence that union membership is negatively associated with economic growth. Table 1 illustrates the result for the impact of state union membership rates on state GDP growth rates.
Table 1: Union Membership and Real GDP Growth[17]
|
Business Size |
Real GDP Growth |
| All Sizes |
-0.253* |
| *Significant at 5% Level | |
For every one-percentage point increase in the union membership rate, a state’s real GDP growth rate decreases by 0.25 percentage points. To put this in perspective, in 2013 state real GDP grew 1.28 percent on average. If the average union membership rate increased by one percentage point, then the state average real GDP growth rate would have declined to 1.03 percent. This result is not surprising to us because the same trend occurs in the raw data. Average compounded annual real GDP growth in states where union membership declined from 2004 to 2013 was 0.13 percentage points faster than the average in states where union membership rose.
Employment
Table 2 contains the results for the relationship between union membership and job growth for the entire labor force and for each business establishment size category.
Table 2: Union Membership and Employment Growth by Business Establishment Size
| Business Size |
Employment Growth |
| All Sizes |
-0.105* |
| Under 5 |
-0.107 |
| 5 to 9 |
-0.116 |
| 10 to 19 |
-0.135 |
| 20 to 49 |
-0.158† |
| 50 to 99 |
-0.143† |
| 100 to 249 |
-0.143 |
| 250 to 499 |
-0.135 |
| 500 to 999 |
-0.120 |
| 1,000 or more |
-0.049 |
| *Significant at 10% Level | |
| †Jointly Significant at 10% Level | |
We find statistically significant evidence that an increase in union membership decreases job growth overall, in businesses with 20 to 49 employees, and in those with 50 to 99 employees. First looking at workers in all business sizes, the results indicate that a one-percentage point increase in the union membership rate is associated with a 0.11 percentage point decrease in the job growth rate. In 2013, employment in an average state grew 0.85 percent. The results indicate that had the average union membership rate increased one-percentage point, the average state job growth rate would have decreased to 0.74 percent. Again, this result matches the trend in the raw data. Average compounded annual job growth during this time period was 0.15 percentage points quicker in states where union membership declined than in states where it rose.
When examining employment growth in each business size, we find that a one-percentage point increase in the union participation rate is associated with a 0.16 percentage point decrease in the job growth rate in businesses with 20 to 49 employees and a 0.14 percentage point decrease in businesses with 50 to 99 employees. In the rest of the business establishment size categories, although the effects are statistically insignificant, they are still negative. This indicates that union membership may hamper job growth in those categories as well.
Looking over the results by business size, the statistically significant effects of union membership on job growth are centered on businesses with 20 to 99 employees. To yield more precise results, we next consolidate the business size categories and run another regression. In particular, we consolidate the data into three business size categories – under 20 employees, 20 to 99 employees, and 100 or more employees – to further evaluate this effect of union membership on job growth in medium-sized businesses. Table 3 contains the results from this new model.
Table 3: Union Membership and Employment Growth with Consolidated Business Sizes
| Business Size |
Employment Growth |
| Under 20 |
-0.148 |
| 20 to 99 |
-0.178† |
| 100 or more |
-0.144†† |
| †Jointly Significant at 5% Level | |
| ††Jointly Significant at 10% Level | |
This model appears to yield results that are indeed more precise, with larger magnitudes and higher degrees of statistical significance. For businesses with 20 to 99 employees we find statistically significant evidence that a one-percentage point increase in the union membership rate is associated with a 0.18 percentage point decline in the job growth rate. Our results also yield a statistically significant relationship for businesses with 100 or more employees, which the previous model did not. The coefficient indicates that a one-percentage point increase in the union membership rate is associated with a 0.14 percentage point decrease in the job growth rate in businesses with 100 or more employees.
Average Weekly Earnings
So when union membership rises, there is a decline in job growth. But, how do unions impact wage growth? Table 4 contains the results for the relationship between union membership and employee average weekly earnings growth.
Table 4: Union Membership and Average Weekly Earnings Growth by Business Size
| Business Size |
Average Weekly Earnings Growth |
| All Sizes |
-0.224* |
| Under 5 |
-0.137† |
| 5 to 9 |
-0.104 |
| 10 to 19 |
-0.084 |
| 20 to 49 |
-0.085 |
| 50 to 99 |
-0.082 |
| 100 to 249 |
-0.092 |
| 250 to 499 |
-0.076 |
| 500 to 999 |
-0.041 |
| 1,000 or more |
-0.073 |
| *Significant at 5% Level | |
| †Jointly Significant at 10% Level | |
We find statistically significant evidence that union membership is negatively associated with average weekly earnings growth for all workers and for those in businesses that have fewer than 5 employees. We estimate that for every one-percentage point increase in the state union membership rate, the average weekly earnings growth rate for all workers in the state declines by 0.22 percentage points and for workers in businesses with fewer than 5 employees it declines by 0.14 percentage points. Again, these results mirror the raw data: average compounded annual average weekly earnings growth was slightly quicker (0.03 percentage point) in states where union membership declined than in states where it increased. For business establishments with 5 or more employees, we did not find statistically significant evidence that union membership impacts average weekly earnings growth.
Total Wage Earnings
With evidence that unionization hampers weekly earnings growth and job growth, it should be no surprise that we also find substantial evidence that an increase in the union membership rate is associated with a decline in the total wage earnings growth rate. This means that as union membership rises, the growth rate of total income earned by all workers in a state decreases. The results for total wage earnings are illustrated in Table 5.
Table 5: Union Membership and Total Wage Earnings Growth by Business Size
| Business Size |
Total Wage Earnings Growth |
| All Sizes |
-0.201* |
| Under 5 |
-0.238† |
| 5 to 9 |
-0.215† |
| 10 to 19 |
-0.215† |
| 20 to 49 |
-0.242† |
| 50 to 99 |
-0.213† |
| 100 to 249 |
-0.222† |
| 250 to 499 |
-0.203 |
| 500 to 999 |
-0.126 |
| 1,000 or more |
-0.110 |
| *Significant at 10% Level | |
| †Jointly Significant at 10% Level | |
We find statistically significant evidence that an increase in a state’s union membership rate is associated with a decrease in the growth rate of total wage earnings for all workers in that state and particularly for those in small- and medium-size business establishments. For all workers, we find that a one-percentage point increase in the union membership rate is associated with a 0.20 percentage point decline in the total wage earnings growth rate.
When examining the relationship between union membership and total wage earnings growth for each business establishment size, we find statistically significant evidence that an increase in the union membership rate is associated with declines in total wage earnings growth for workers in all businesses with fewer than 250 employees. The relationship between union membership and total wage earnings growth for workers in business establishments with 250 or more workers is consistently negative, but statistically insignificant. As in the other cases, these results are consistent with trends in the raw data. In particular, in states where union membership declined, average compounded annual total wage earnings growth was 0.17 percentage points higher than it was in states where union membership grew.
Just like in our analysis on job growth, in this section there is a distinct division in the results by business establishment size: we find statistically significant evidence that union membership is negatively related to total wage earnings for workers in all businesses with fewer than 250 workers, but not for businesses with 250 or more workers. Given these findings, to yield more precise results we next build a new regression model in which we consolidate the business establishment data into only two business size categories – those with fewer than 250 employees and those with 250 or more employees. As illustrated in Table 6, this model yields statistically significant negative relationships for both business size categories.
Table 6: Union Membership and Total Wage Earnings Growth with Consolidated Business Sizes
| Business Size |
Total Wage Earnings Growth |
| Under 250 |
-0.333† |
| 250 or more |
-0.280†† |
| †Jointly Significant at 1% Level | |
| ††Jointly Significant at 5% Level | |
In the consolidated business establishment model we find that a one-percentage point increase in the union membership rate is associated with a 0.33 percentage point decrease in the total wage earnings growth rate for all workers in businesses with fewer than 250 employees and a 0.28 percentage point decrease in the total wage earnings growth rate for workers in businesses with 250 or more employees. Again, consolidating the business establishment sizes yields greater precision as the results are both larger in magnitude and have greater statistical significance.
Business Establishments
Table 7 contains the results for the relationship between the union membership rate and the growth rate in the number of business establishments.
Table 7: Union Membership and Business Establishment Growth by Business Size
| Business Size |
Business Growth |
| All Sizes |
-0.042 |
| Under 5 |
-0.113 |
| 5 to 9 |
-0.104 |
| 10 to 19 |
-0.122 |
| 20 to 49 |
-0.143 |
| 50 to 99 |
-0.134 |
| 100 to 249 |
-0.125 |
| 250 to 499 |
-0.129 |
| 500 to 999 |
-0.138 |
| 1,000 or more |
-0.016 |
In this case, although each effect is negative, we did not find any statistically significant evidence that an increase in the union membership rate limits the growth in the number of business establishments in a state. So even though the results indicate that an increase in unionization harms the growth of jobs and worker earnings, they also illustrate that unions do not substantially harm business growth.
Implications
We consistently find that union membership has negative economic effects on real GDP, jobs, and wages. This suggests that the steady decline in union membership since the 1980s has had positive effects on the economy by growing real GDP, jobs, average weekly earnings, and total wage earnings. In this section, we apply our results to the year-to-year changes in union membership rates in each state and the District of Columbia throughout the time period we study in our regression analysis, 2004 to 2013. Overall, between 2004 and 2013 the union membership rate in the United States declined 1.2 percentage points. 22 states experienced an increase in the union membership rate and 28 states and the District of Columbia experienced a decline. In states that experienced a rise in union membership, we calculate the decline in each economic indicator that our results suggest. Likewise, in states that experienced a decline in union membership, we apply our findings to calculate the resulting growth in each economic indicator.
Real GDP
The results imply that overall the change in union membership between 2004 and 2013 led to an additional $115.9 billion in economic growth in the United States. Table 8 contains the implications for each state.
Table 8: Changes in Real GDP Resulting from Changes in Union Membership Rates from 2004 to 2013 by State
| State |
Real GDP ($ Millions) |
||
| Total |
115,876.49 |
Continued |
|
| Alabama |
-861.9 |
Montana |
-950.5 |
| Alaska |
-3,032.4 |
Nebraska |
657.1 |
| Arizona |
-2,309.5 |
Nevada |
-7,072.6 |
| Arkansas |
793.1 |
New Hampshire |
-635.3 |
| California |
-21,599.7 |
New Jersey |
5,928.2 |
| Colorado |
3,763.2 |
New Mexico |
-834.8 |
| Connecticut |
-2,683.2 |
New York |
18,502.8 |
| Delaware |
1,275.1 |
North Carolina |
-3,793.0 |
|
District of Columbia |
6,174.9 |
North Dakota |
1,035.6 |
| Florida |
4,142.7 |
Ohio |
15,307.0 |
| Georgia |
18,735.0 |
Oklahoma |
-1,250.6 |
| Hawaii |
801.0 |
Oregon |
-1,104.3 |
| Idaho |
84.9 |
Pennsylvania |
9,832.0 |
| Illinois |
12,075.4 |
Rhode Island |
-302.0 |
| Indiana |
1,885.5 |
South Carolina |
-2,623.6 |
| Iowa |
-5,683.4 |
South Dakota |
400.0 |
| Kansas |
3,752.4 |
Tennessee |
8,571.0 |
| Kentucky |
683.0 |
Texas |
-2,043.7 |
| Louisiana |
10,586.0 |
Utah |
612.3 |
| Maine |
-425.8 |
Vermont |
-830.6 |
| Maryland |
-10,139.3 |
Virginia |
8,233.0 |
| Massachusetts |
-10,041.1 |
Washington |
-369.3 |
| Michigan |
29,308.7 |
West Virginia |
774.8 |
| Minnesota |
7,110.9 |
Wisconsin |
11,449.2 |
| Mississippi |
-911.0 |
Wyoming |
481.8 |
| Missouri |
12,417.4 |
In states where union membership increased between 2004 and 2013, the resulting decline in real GDP ranged from $302 million in Rhode Island to $21.6 billion in California. Meanwhile among the states that had a decrease in union membership, the real GDP rose by between $84.9 million in Idaho and $29.3 billion in Michigan. The economic growth from the states with a decline in union membership outweighed the economic decline in the states with an increase in union membership.
Employment
The results indicate that the overall decline in union membership between 2004 and 2013 led to an additional 393,189 jobs in the U.S. labor market. Table 9 contains the employment implications for each state.
Table 9. Changes in Employment Resulting from Changes in Union Membership Rates from 2004 to 2013 by State[18]
| State |
Employment |
||
| Total |
393,189 |
Continued | |
| Alabama |
-2,920 |
Montana |
. |
| Alaska |
-5,931 |
Nebraska |
2,121 |
| Arizona |
-7,800 |
Nevada |
-23,906 |
| Arkansas |
2,837 |
New Hampshire |
-2,121 |
| California |
-56,095 |
New Jersey |
15,518 |
| Colorado |
11,252 |
New Mexico |
-2,503 |
| Connecticut |
-6,620 |
New York |
44,399 |
| Delaware |
3,249 |
North Carolina |
-11,748 |
| District of Columbia |
11,984 |
North Dakota |
3,358 |
| Florida |
14,800 |
Ohio |
52,856 |
| Georgia |
59,679 |
Oklahoma |
-4,049 |
| Hawaii |
2,351 |
Oregon |
-3,248 |
| Idaho |
310 |
Pennsylvania |
33,090 |
| Illinois |
35,991 |
Rhode Island |
-967 |
| Indiana |
6,532 |
South Carolina |
-9,412 |
| Iowa |
-18,987 |
South Dakota |
1,362 |
| Kansas |
12,984 |
Tennessee |
29,786 |
| Kentucky |
2,419 |
Texas |
-5,594 |
| Louisiana |
32,527 |
Utah |
2,091 |
| Maine |
-1,613 |
Vermont |
-3,128 |
| Maryland |
-26,528 |
Virginia |
23,544 |
| Massachusetts |
-28,063 |
Washington |
-971 |
| Michigan |
101,910 |
West Virginia |
2,777 |
| Minnesota |
23,590 |
Wisconsin |
41,358 |
| Mississippi |
-3,374 |
Wyoming |
. |
| Missouri |
44,090 |
In states where union membership increased between 2004 and 2013, the resulting decline in employment ranged from 967 in Rhode Island to 56,095 in California. Meanwhile, among the states where union membership declined, employment rose by between 310 in Idaho and 101,910 in Michigan. It should be noted that with the decline in auto manufacturing, Michigan was among the hardest hit states during the recession. Our results indicate that the decline in union membership facilitated the state’s economic recovery.
Average Weekly Earnings
Our results suggest that the 2004 to 2013 overall decline in union membership nationwide translated to average weekly earnings increasing by $6.08.[19] The average weekly earnings for each state are in Table 10.
Table 10. Changes in Average Weekly Earnings from Changes in Union Membership Rates from 2004 to 2013 by State
| State |
Average Weekly Earnings ($) |
||
| Total |
6.08 |
Continued | |
| Alabama |
-3.30 |
Montana |
-15.01 |
| Alaska |
-52.30 |
Nebraska |
4.46 |
| Arizona |
-6.90 |
Nevada |
-42.30 |
| Arkansas |
4.70 |
New Hampshire |
-8.13 |
| California |
-10.00 |
New Jersey |
11.65 |
| Colorado |
12.20 |
New Mexico |
-6.65 |
| Connecticut |
-12.30 |
New York |
16.10 |
| Delaware |
19.75 |
North Carolina |
-6.45 |
|
District of Columbia |
77.35 |
North Dakota |
19.02 |
| Florida |
3.96 |
Ohio |
21.65 |
| Georgia |
35.16 |
Oklahoma |
-5.68 |
| Hawaii |
8.03 |
Oregon |
-4.27 |
| Idaho |
0.94 |
Pennsylvania |
13.41 |
| Illinois |
15.84 |
Rhode Island |
-4.60 |
| Indiana |
4.60 |
South Carolina |
-10.08 |
| Iowa |
-25.49 |
South Dakota |
6.32 |
| Kansas |
20.50 |
Tennessee |
23.50 |
| Kentucky |
2.74 |
Texas |
-1.30 |
| Louisiana |
36.66 |
Utah |
3.49 |
| Maine |
-5.40 |
Vermont |
-21.19 |
| Maryland |
-28.00 |
Virginia |
16.76 |
| Massachusetts |
-25.31 |
Washington |
-0.87 |
| Michigan |
56.03 |
West Virginia |
7.89 |
| Minnesota |
21.24 |
Wisconsin |
30.86 |
| Mississippi |
-5.72 |
Wyoming |
10.11 |
| Missouri |
35.14 |
Where union membership increased between 2004 and 2013, average weekly earnings declined by between 87 cents in Washington and $52.30 in Alaska. In the states where union membership declined, average weekly earnings rose by between 94 cents in Idaho and $77.35 in the District of Columbia.
Total Wage Earnings
With the increase in real GDP, employment, and average weekly earnings, the overall decline in union membership also led to an additional $35.1 billion in total wage earnings from 2004 to 2013. The change in total wage earnings in each state is illustrated in Table 11.
Table 11. Changes in Total Wage Earnings from Changes in Union Membership Rates from 2004 to 2013 by State
| State |
Total Wage ($ Millions) |
||
| Total |
35,098.8 |
Continued | |
| Alabama |
-229.2 |
Montana |
-245.6 |
| Alaska |
-602.7 |
Nebraska |
160.2 |
| Arizona |
-670.0 |
Nevada |
-1,997.0 |
| Arkansas |
206.6 |
New Hampshire |
-202.3 |
| California |
-6,076.8 |
New Jersey |
1,761.1 |
| Colorado |
1,098.8 |
New Mexico |
-188.2 |
| Connecticut |
-803.9 |
New York |
5,459.2 |
| Delaware |
326.1 |
North Carolina |
-985.2 |
|
District of Columbia |
1,733.4 |
North Dakota |
307.9 |
| Florida |
1,198.9 |
Ohio |
4,470.6 |
| Georgia |
5,373.1 |
Oklahoma |
-325.5 |
| Hawaii |
185.1 |
Oregon |
-279.3 |
| Idaho |
22.5 |
Pennsylvania |
3,065.4 |
| Illinois |
3,621.9 |
Rhode Island |
-85.7 |
| Indiana |
527.1 |
South Carolina |
-708.9 |
| Iowa |
-1,488.3 |
South Dakota |
97.2 |
| Kansas |
1,043.4 |
Tennessee |
2,502.2 |
| Kentucky |
188.0 |
Texas |
-551.9 |
| Louisiana |
2,679.8 |
Utah |
166.7 |
| Maine |
-123.8 |
Vermont |
-245.7 |
| Maryland |
-2,642.5 |
Virginia |
2,301.0 |
| Massachusetts |
-3,376.0 |
Washington |
-98.2 |
| Michigan |
9,132.2 |
West Virginia |
207.3 |
| Minnesota |
2,293.1 |
Wisconsin |
3,378.4 |
| Mississippi |
-228.8 |
Wyoming |
99.3 |
| Missouri |
3,647.7 |
In states where union membership increased between 2004 and 2013, total wage earnings declined by between $85.7 million in Rhode Island and $6.1 billion in California. In states where union membership decreased, however, total wage earnings rose by between $22.5 million in Idaho and $9.1 billion in Michigan.
Interestingly when we use national figures reported by the BLS rather than add up each individual state, the resulting growth in each economic category becomes much larger. In particular, the BLS reports that from 2004 to 2013, the nationwide union membership rate declined 1.2 percentage points. Based on our results, this means that by 2013 the decline in unionization led to an additional $189.3 billion in real GDP, 577,348 jobs, $10.17 in average weekly earnings, and $53.4 billion in total wage earnings.
Conclusion
The recent decline in union membership rates provides us with the opportunity to evaluate how union participation impacts various aspects of our economy. The data clearly show that real GDP, employment, and wages all grow when fewer workers are involved with unions. This suggests that if the current downward trend in union participation continues, it would be beneficial—not harmful—for workers and the U.S. economy.
[1] “Table 3. Union affiliation of employed wage and salary workers by occupation and industry,” Bureau of Labor Statistics, Department of Labor, http://www.bls.gov/webapps/legacy/cpslutab3.htm
[2] Kris Maher & Melanie Trottman, “Unions Can Organize ‘Micro Units,’ Court Affirms,” The Wall Street Journal, August 16, 2013, http://blogs.wsj.com/washwire/2013/08/16/unions-can-organize-micro-units-appeals-court-affirms/
[3] Justin C. Sorrell, Howard M. Bloom, & Philip B. Rosen, “Unions Winning More Elections, but Facing Diminishing Returns,” National Law Review, November 2014, http://www.natlawreview.com/article/unions-winning-more-elections-facing-diminishing-returns
[4] “NLRB Representation Case-Procedures Fact Sheet,” National Labor Relations Board, https://www.nlrb.gov/news-outreach/fact-sheets/nlrb-representation-case-procedures-fact-sheet
[5] Timothy M. McConville, “Final NLRB ‘Ambush Election” Rule Will Boost Union Organizing,” National Law Review, January 2015, http://www.natlawreview.com/article/final-nlrb-ambush-election-rule-will-boost-union-organizing
[6] Mark A. Carter, “Ambushed: How the NLRB’s New Election Rule Harms Employers & Employees,” Testimony, Statement of the U.S. Chamber of Commerce, United States Senate Committee on Health, Education, Labor, and Pensions, February 2015, pg. 7, https://www.uschamber.com/sites/default/files/2-11-2015_-_chamber_testimony_on_ambush_elections_mark_carter_-_final_-.pdf
[7] “Browning-Ferris Industries of California, Inc. d/b/a BFI Newby Island Recyclery, and FRP-II, LLC. d/b/a Leadpoint Business Services,” National Labor Relations Board, https://www.nlrb.gov/case/32-RC-109684
[8] “NLRB Office of the General Counsel Issues Consolidated Complaints Against McDonald’s Franchisees and their Franchisor, McDonald’s, USA, LLC as Joint Employers,” Office of Public Affairs, National Labor Relations Board, December 19, 2014, https://www.nlrb.gov/news-outreach/news-story/nlrb-office-general-counsel-issues-consolidated-complaints-against
[9] “Persuader Agreements: Ensuring Transparency in Reporting for Employers and Labor Relations Consultants,” United States Department of Labor, http://www.dol.gov/olms/regs/compliance/ecr/Persuader_OverviewSum_508_2.pdf
[10] Joseph Baumgarten, “Testimony of Joseph Baumgarten Before the Subcommittee on Health, Employment, Labor, and Pensions,” House Committee on Education and Workforce, April 2016, pg. 7, http://edworkforce.house.gov/uploadedfiles/testimony_baumgarten.pdf
[11] Wage, employment, and business establishment data come from the Bureau of Labor Statistics’ Quarterly Census of Employment and Wages, available at http://data.bls.gov/cgi-bin/dsrv?en.
[12] Real GDP data come from the Bureau of Economic Analysis with NAICS industry detail, available at http://www.bea.gov/iTable/iTable.cfm?reqid=70&step=1&isuri=1&acrdn=2#reqid=70&step=1&isuri=1.
[13] House Price Index Archive, Freddie Mac,http://www.freddiemac.com/finance/fmhpi/archive.html
[14] Census Bureau, http://www.census.gov/
[15] 2003 statewide education estimates are from the Current Population Survey, which are made available at the Census Bureau,http://www.census.gov/hhes/socdemo/education/data/cps/index.html
[16] State & Local Government Finances, Census Bureau, https://www.census.gov/govs/local/
[17] For real GDP, we only perform the analysis for all business sizes because there is no output data for specific business sizes.
[18] We are unable to calculate job estimates for Montana and Wyoming due to missing employment data.
[19] This average was calculated by weighting each state by real GDP.
