Weekly Checkup
September 13, 2019
Understanding the Latest Insurance Coverage Numbers
Earlier this week, the United States Census Bureau released its annual report on health insurance coverage in the United States. Headlining the report was the finding that the uninsured rate increased for the first time in years, from 7.9 percent in 2017 (25.6 million people) to 8.5 percent in 2018 (27.5 million people). While that topline finding was attention-grabbing, the many pieces resulting in that number deserve attention also. This edition of the Weekly Checkup highlights those figures that you might have missed.
First, while the number of uninsured people increased in 2018 by roughly 1.8 million people, the number of people insured only decreased by about 600,000. In other words, the other 1.2 million uninsured people can be attributed to population growth in one way or another.
Next, out of all the insurance sources—public or private—Medicaid saw the greatest attrition, as the Medicaid population decreased by roughly 2 million. The report did not venture to give a reason why, but one could easily point to various state policies that are leading to enrollment decreases. For example, states began seeking to implement work requirements in 2018.
These specific policies are likely not to blame for the bulk of the drop, as only Arkansas had implemented work requirements by the end of 2018, resulting in an 18,000 person reduction in the Medicaid population. Individual states’ policies aside, the biggest reason why Medicaid enrollment decreased is that the number of people below the Federal Poverty Level (FPL) has decreased—by 1.3 million. Furthermore, the number of people between 100 and 138 percent of the FPL decreased by about 1 million. If these numbers are added together, it explains the 1.9 million drop in Medicaid enrollment: As the economy improves, people become ineligible for Medicaid.
An exodus from Medicaid because of higher incomes would cause us to expect increased enrollment in private insurance, yet that was not the case, as both individual and employer-sponsored coverage saw decreases in the number of people insured. In the private-insurance market, the individual market took the biggest hit, as it saw a decrease of 650,000 people. This drop is particularly noteworthy given that the uninsured rate is higher across all income levels above 100 percent of the FPL, including for those who qualify for exchange subsidies. Why the decrease? Well, 2018 was the year that recorded the largest premium increases in the individual market since the year the Affordable Care Act was implemented, as the average benchmark plan in the exchanges increased by 36 percent.
Finally, at the same time that Medicaid and private marketplace coverage saw decreasing numbers of people insured, the number of people insured through Medicare increased by about 1.5 million. To explain this increase, the Census Bureau cited a growth in the number of people aged 65 and older.
The key takeaway from all of these figures is that while improving the economy is good, more jobs and increased wages don’t necessarily lead to decreases in the uninsured. Unless premiums and, more important, the underlying health care costs are addressed, Americans will continue to face challenges in the health insurance marketplace.
Chart Review
Andrew Strohman, Health Care Data Analyst
As Congress returns, a central issue of debate is drug pricing—particularly for insulin. Primarily prescribed for those suffering from type 1 diabetes, insulin injections are a life or death necessity for these individuals. Recent news articles have highlighted the increasing cost of insulin and the resulting inability of many patients to afford the quantities they need. Nevertheless, deaths from Type 1 Diabetes have been declining in the United States and other developed countries, even as the prevalence gradually increases. According to the Global Health Data Exchange, the death rate from type 1 diabetes in the United States decreased from 5.4 to 3.7 per 100,000 people between 1990 and 2017, while the prevalence rate increased from 472 to 527 per 100,000. As the chart below shows, Canada, the United Kingdom, and Denmark exhibit similar trends (dotted lines are death rates; solid lines are prevalence). While these findings likely have complex explanations, it may be prudent to further evaluate whether or not insulin’s increasing price tag correlates with issues in domestic access.
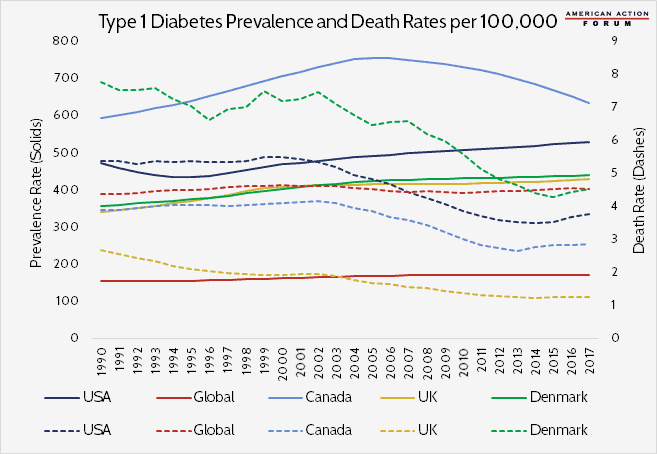
Data obtained from the Global Health Data Exchange
From Team Health
Maternal Mortality in the United States – Deputy Director of Health Care Policy Tara O’Neill Hayes and Carly McNeil
Maternal mortality has risen substantially in the United States over the last two decades, and a number of factors are to blame.
Medical Care Prices — It’s Not Just the Drugs – AAF President Douglas Holtz-Eakin
The recent rise in inflation is due in part to the rising cost of medical care, a useful reminder that more than just prescription drugs contribute to health care price pressures.
Worth a Look
Axios: CRISPR gene editing used to treat patient with cancer and HIV
New York Times: Nursing Homes Are a Breeding Ground for a Fatal Fungus