


The Daily Dish
April 18, 2023
Shelter Inflation – Is the End in Sight?
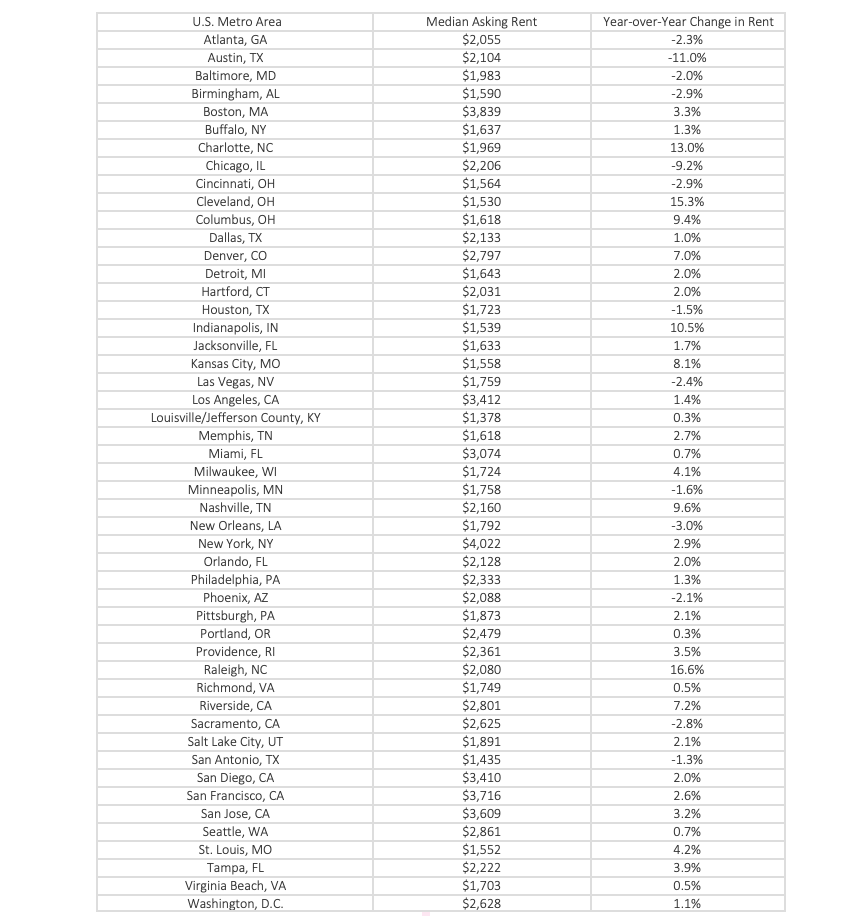
This headline was sure to grab attention: “Rental Market Tracker: U.S. Rents Post First Annual Decline in Three Years.” The news release was from Redfin, the real estate brokerage firm. The table from the release is reproduced at the bottom; it indicates that year-over-year changes in rent were negative in 13 of the 50 most populous metropolitan areas in the United States.
In contrast, four measures of shelter inflation from the official Consumer Price Index (CPI) produced by the Bureau of Labor Statistics (BLS) are shown below. Although it is probably a violation of the norms of civilized graphing to put four lines in one presentation, the most important fact jumps right out: There are no negative entries. Regardless of whether one looks at rents (blue and gray) or owner-equivalent rent (OER, the hypothetical rent a homeowner would charge herself monthly; orange and yellow), inflation is positive. If one looks at monthly inflation (at an annualized rate; blue and orange) or year-over-year inflation (gray and yellow), inflation is positive. Indeed, as has been frequently noted, year-over-year shelter inflation has yet to peak and begin descending.
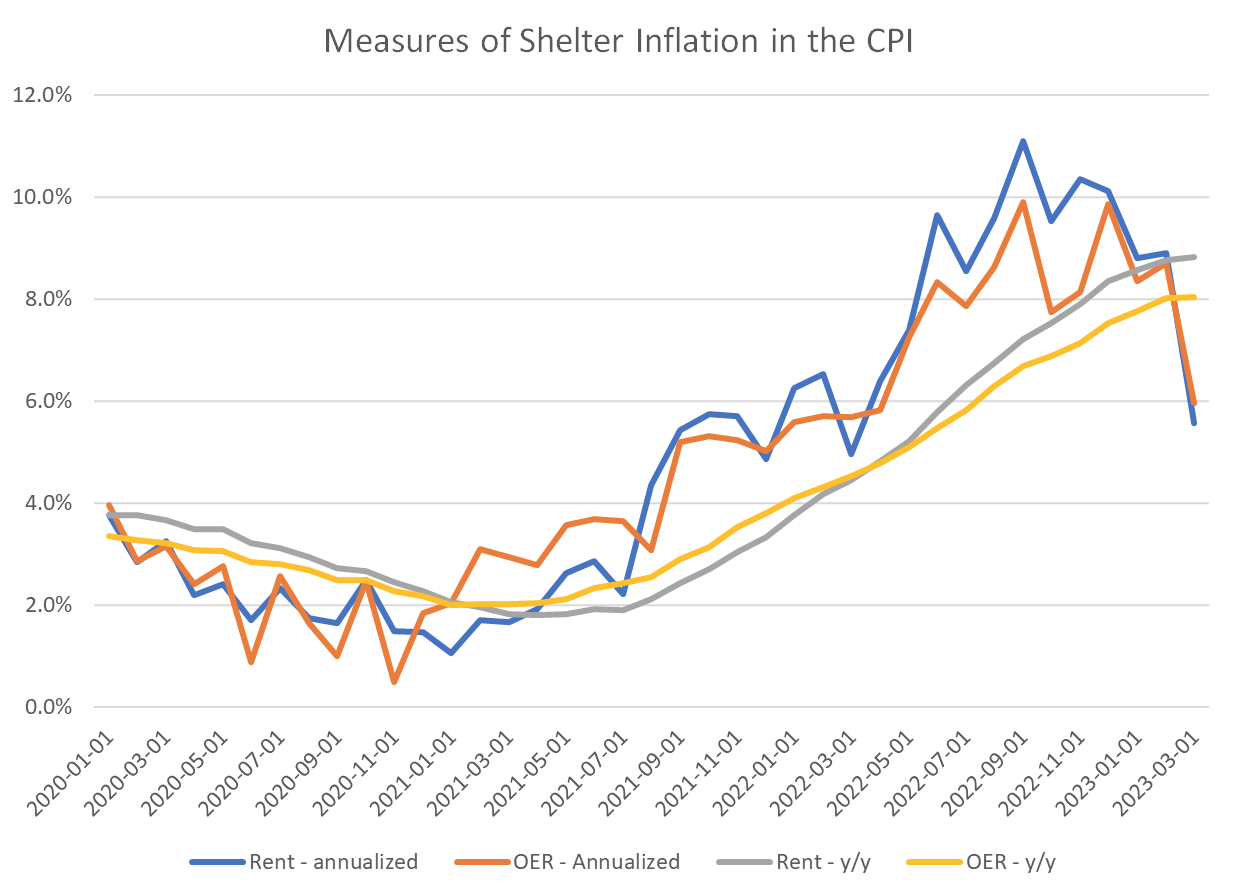
The obvious question is: What is going on here? The most obvious difference is that the Redfin report focuses on rental housing, while the official shelter data has both rental and homeowners. But, as the graph indicates, these tend to track closely, so that can’t be a big deal.
The second difference is that Redfin focused on the 50 most populous areas, while BLS constructs the CPI to be representative of all urban consumers.
But the most important difference is that Redfin displays the asking rent for a unit, while BLS measures the rent someone is actually paying. Some people may be paying the last month of a lease signed a year ago, but if the Redfin data are right, they will have the opportunity to sign a new lease for less in the month to come. That means that softness in the rental market translates into lower actual shelter inflation slowly over time. The CPI is correctly measuring what people actually pay for shelter, but one has to focus on new leases to get a feel for the future of shelter costs.
The other key feature of both the rental and owner-occupied markets is that supplies remain tight. That suggests the easing of price pressures comes from success in slowing the growth of demand – precisely the intent of Federal Reserve tightening.
The Redfin data are one more piece of evidence that the Fed is making progress, albeit slow and limited progress, in reducing inflation to its 2-percent target.
Median Asking Rents: March 2023
Fact of the Day
Across all rulemakings this past week, agencies published $1.1 billion in total costs and added 17,206 annual paperwork burden hours.
