








Insight
October 16, 2026
Assessing Medicare Part D 2027 Market Stability
Executive Summary
- The Centers for Medicare & Medicaid Services (CMS) released key information regarding Medicare prescription drug coverage (Part D) availability and pricing for calendar year 2027 plans; in its announcement, the agency characterized the market broadly as “stable,” citing modest changes in average monthly premiums and widespread beneficiary access to lower-cost basic Part D plans.
- A closer examination of the Part D market reveals a more complicated outlook, including continued declines in the number of stand-alone prescription drug plans (PDPs) and conventional Medicare Advantage prescription drug plans nationally; assuming beneficiaries remain enrolled in continuing or newly corresponding plans, this analysis also estimates a substantial increase in average monthly premiums among PDPs in 2027, as well as higher annual deductibles across both plan types.
- These trends have occurred amid significant market and regulatory pressures, most notably provisions implemented under the Inflation Reduction Act – which increased plan sponsors’ financial liability for prescription drug spending – as well as uncertainty about future drug utilization and costs; together with research documenting changes in drug formularies and cost-sharing arrangements, the findings in this analysis ultimately challenge CMS’ characterization of a broadly “stable” Part D market.
Introduction
On September 28, 2026, the Centers for Medicare & Medicaid Services (CMS) released the calendar year (CY) 2027 Part D landscape files – a repository containing key information regarding Medicare prescription drug coverage offerings for next year. The file identifies where Part D sponsors will offer various prescription drug plans and provides certain details on each plan’s benefit design, including monthly premiums and annual deductibles.
Although the cost of providing the basic Part D benefit is expected to increase by about 25 percent from 2026 estimates, CMS reported that the market for Medicare prescription drug coverage will “remain stable” in 2027. Specifically, the agency estimates that most of the roughly 66 million Medicare beneficiaries will have access to at least one basic Part D plan for $10.30 a month or less, while average monthly premiums for stand-alone prescription drug plans (PDPs) will increase by less than $1. CMS also projects monthly premium savings of more than $4 for beneficiaries enrolled in Medicare Advantage prescription drug plans (MA-PDs).
A closer examination of the Part D market reveals a more complicated outlook. The PDP market experienced a net 53-percent decrease in the number of plan offerings nationally between 2022 and 2026, with further reductions in 2027. Conventional MA-PD offerings have similarly declined in recent years, though growth in Special Needs Plans (SNPs) has largely offset net total losses in the broader MA-PD market. In addition to declining plan availability, this analysis estimates how average monthly premiums and annual deductibles will change in 2027, assuming beneficiaries remain enrolled in continuing or new geographically corresponding plans. The results show that average monthly premiums among stand-alone PDPs are estimated to increase by approximately 44 percent, while conventional MA-PD premiums decrease and average deductibles increase across both plan types.
These trends have occurred amid significant market and regulatory pressures affecting Part D plan sponsors. Most notably, provisions implemented under the Inflation Reduction Act (IRA) – including the elimination of beneficiary cost-sharing during the catastrophic coverage phase and the establishment of a limit on annual out-of-pocket (OOP) costs, and changes to federal reinsurance payments – have increased plan sponsors’ financial liability for prescription drug spending. Alongside uncertainty about future drug utilization and costs, recent research documents changes in various aspects of Part D benefit design, including drug formularies and cost-sharing arrangements. Taken together, this research and the analysis of recent landscape files ultimately challenge CMS’ characterization of a broadly “stable” Part D market.

How Is Medicare Part D Changing for 2027?
CMS’ release of the CY 2027 Part D landscape files provides detailed information on prescription drug plan offerings that Medicare beneficiaries will encounter in the coming year, including monthly premiums and annual deductibles. In July, the agency’s announcement of national bid information implied the expected total cost of providing the basic Part D benefit – the sum of plan-bid costs and federal reinsurance – would increase by approximately 25 percent from 2026. CMS also announced that the temporary premium stabilization demonstration subsidies and risk corridors granted to stand-alone PDP sponsors would conclude at the end of 2026. Despite these pressures facing Part D sponsors, CMS expects the market to “remain stable” in 2027. This analysis of recent landscape files, however, finds a continued decline in the number of Part D plan offerings nationally, in addition to higher average premiums among stand-alone PDPs and higher deductibles across all plan types.
Changes in Plan Offerings
The stand-alone PDP market experienced a 53-percent net reduction in total plan offerings nationally between 2022 and 2026 – falling from 766 to 360. The number of plans will decline further to 316 in 2027 (see Table 1). This market contraction is not uniform across the United States. While five states incurred no reduction in the number of PDPs in 2027, the other 45 states and the District of Columbia lost between one and four plans. Coverage options also declined among low-income subsidy (LIS) benchmark plans, which furnish basic Part D benefits without a monthly premium to certain low-income beneficiaries. These plans decreased from 88 nationally in 2026 to 63 in 2027, leaving 16 states with just one benchmark plan and, for the first time, three states without a PDP that qualifies for the LIS benchmark.
The MA-PD market has a more complicated trajectory over the same period. The total number of plan offerings – including both conventional MA-PDs and SNPs – increased modestly from 4,819 plans in 2022 to 5,094 in 2027. This relative stability in the total MA-PD market, however, reflects diverging trends among the two types of MA-PDs. Conventional offerings have declined nationally since reaching a peak of 3,851 in 2023, shrinking to 3,307 in 2026 and again to 3,156 for 2027. Among both conventional MA-PDs and SNPs, the observed changes in plan offerings also vary considerably across the country. For 2027, 32 states experienced a decrease in the number of conventional MA-PDs, with the largest reductions occurring across counties in Texas, Illinois, Ohio, and Minnesota. Meanwhile, 16 states experienced net increases. Changes in total SNP offerings – which are restricted to beneficiaries with certain medical, institutional, and financial needs – moved in the opposite direction, increasing across counties in 34 states and decreasing in 13 others.
Table 1: Overview of Medicare Part D Plan Offerings, 2022–2027

Source: Author’s analysis of CMS landscape files.
Note: Data for all plan types exclude offerings sanctioned by CMS and plans offered in U.S. territories. MA-PDs exclude SNPs, Private Fee-for-Service (PFFS), and Medical Savings Account (MSA) plans.
The CMS Part D Plan Crosswalk file provides additional detail on these underlying changes in the Part D market for 2027. Of the 360 PDPs offered nationally in 2026, 302 sponsors renewed for 2027, while 26 consolidated into 12 unique plans and 32 exited the market entirely. The PDP market also added two new plans in Florida and Hawaii for 2027. Reshuffling in the MA-PD market is considerably more varied. Of the more than 3,100 conventional MA-PD offerings in 2027, 1,835 plans renewed within the same service area, 528 renewed within a smaller service area, 210 expanded into a new service area, and 105 consolidated with one or more other MA-PDs. The approximately 500 remaining plans are new to Medicare beneficiaries in 2027 under both existing and initial Part D contracts. Collectively, these plan crosswalks indicate relatively stable market-wide counts of Part D offerings that can mask more significant changes in plan availability for individual Medicare beneficiaries.
Premiums and Deductibles
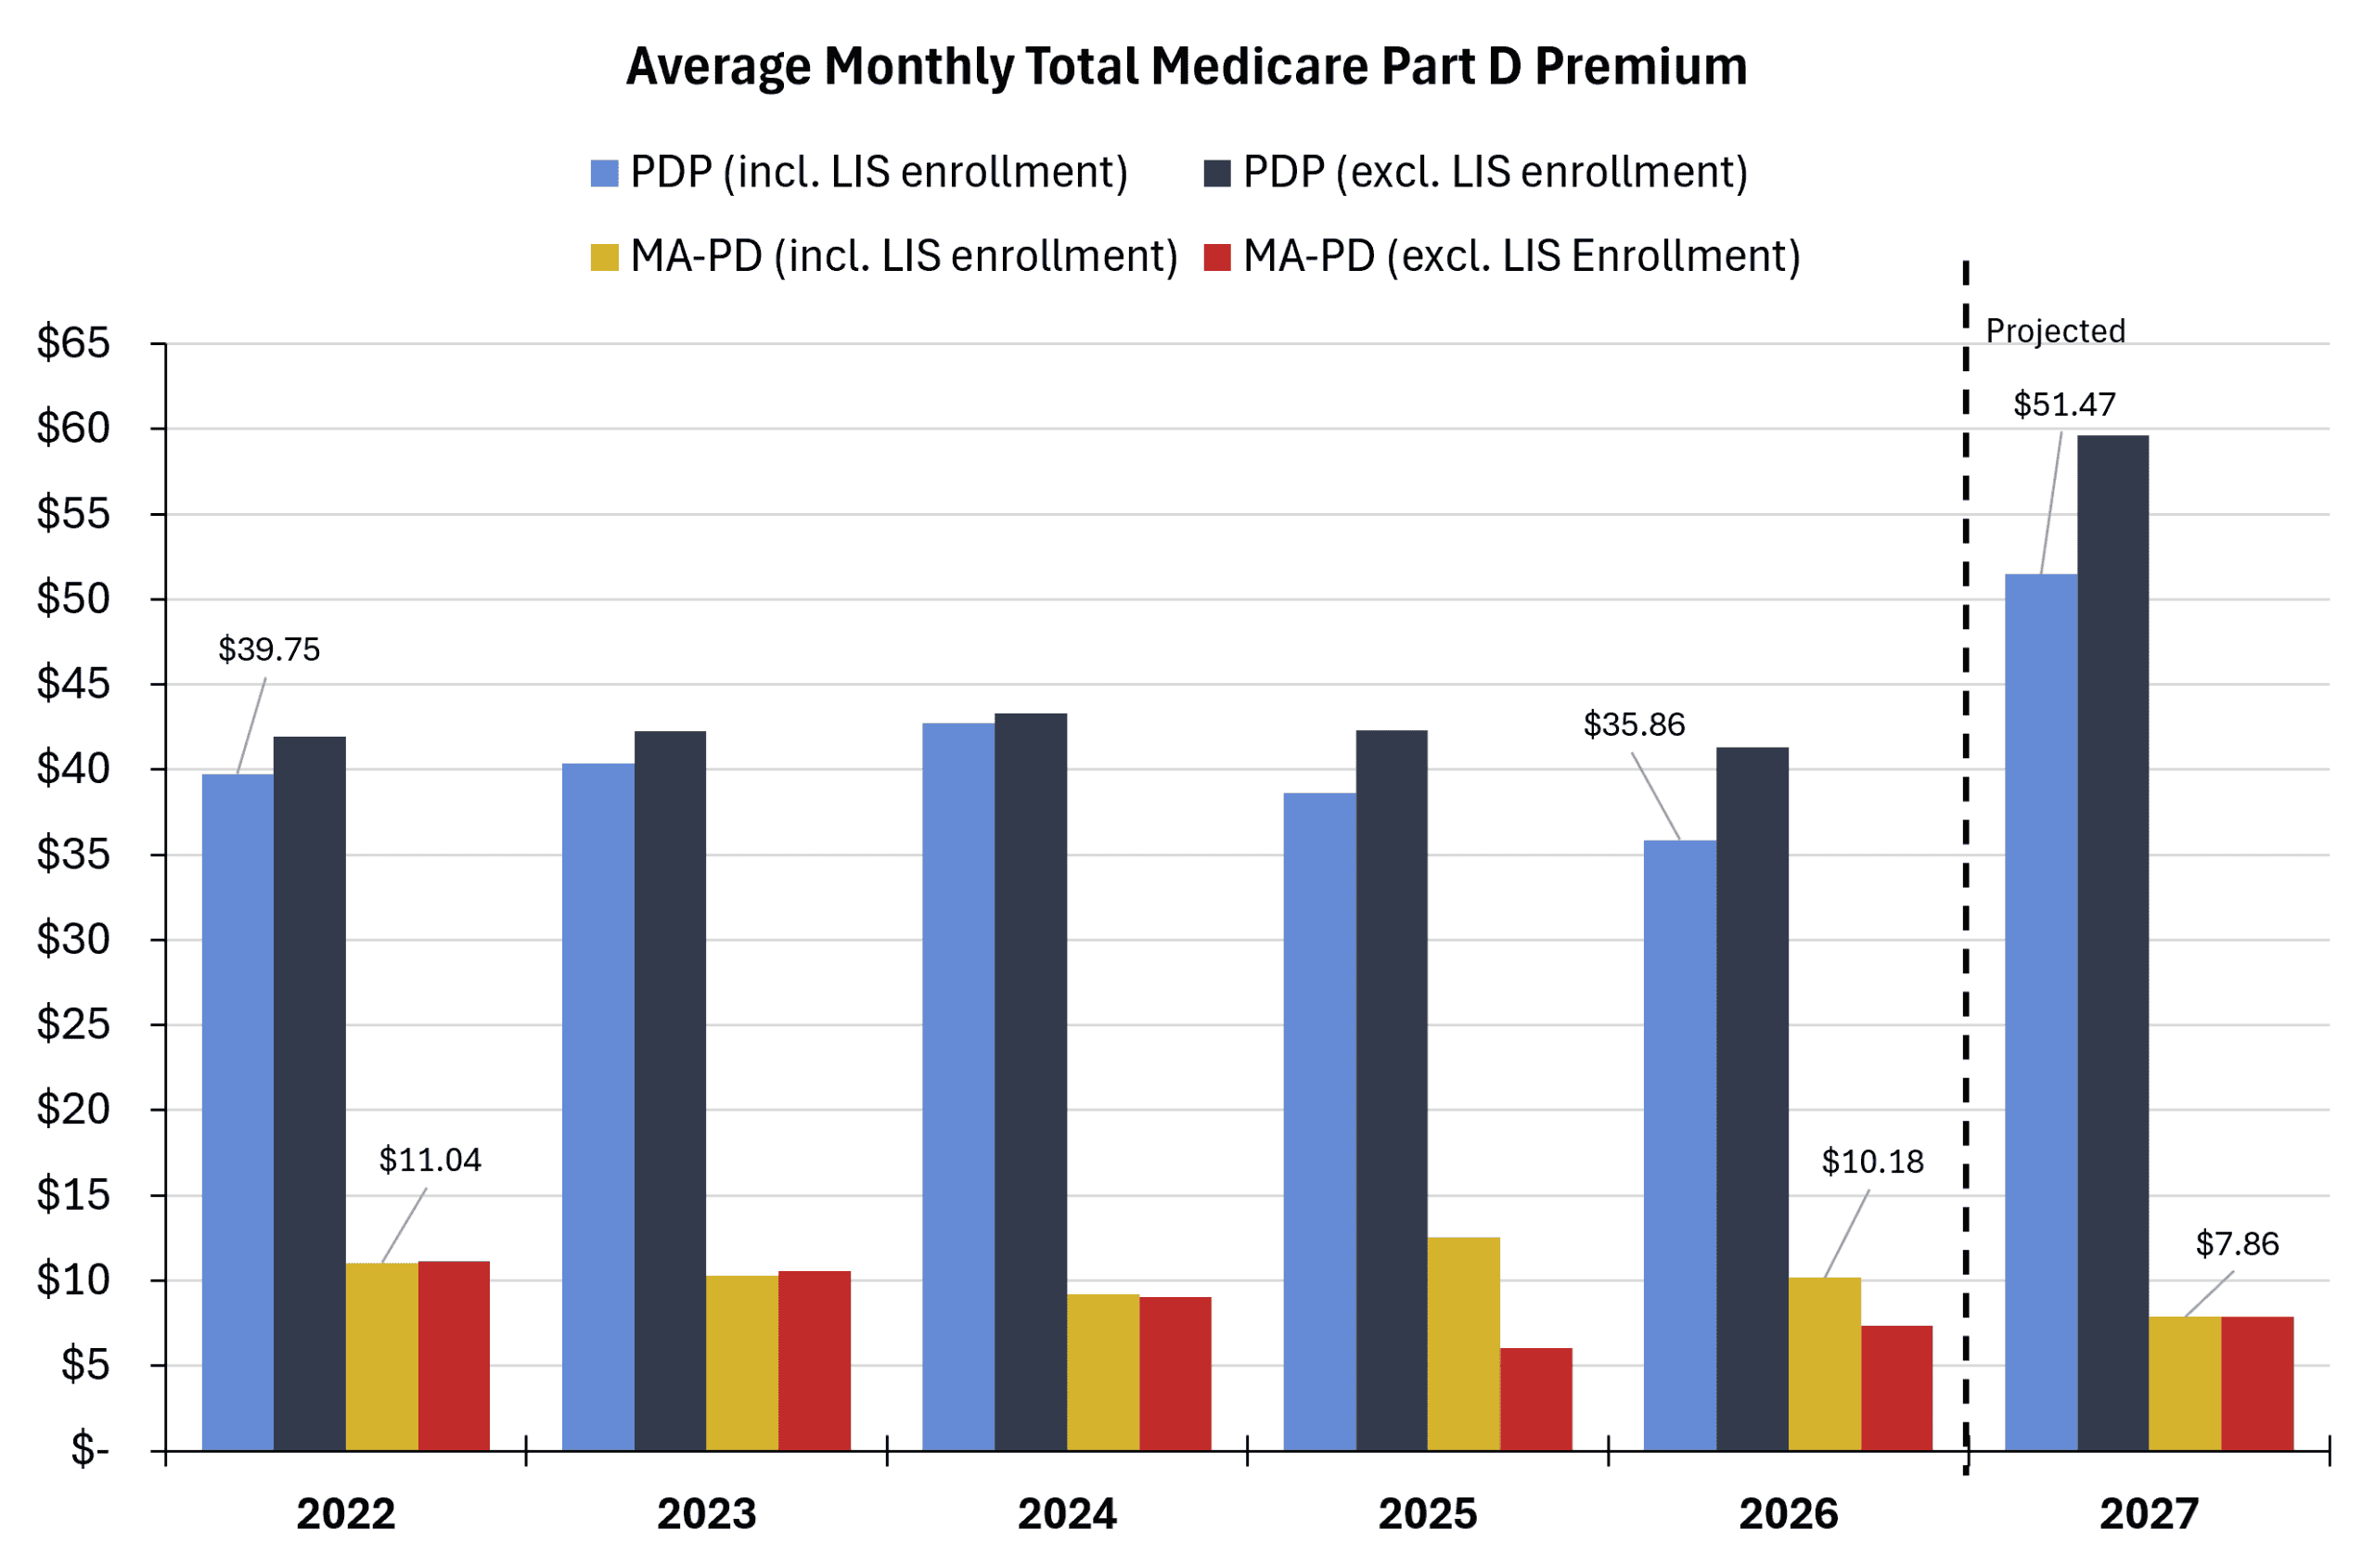
The amount Medicare beneficiaries pay in monthly premiums and out-of-pocket (OOP) costs toward their annual deductible often play an integral role in plan selection. Between 2022 and 2026, the enrollment-weighted average monthly premium of stand-alone PDPs decreased by roughly 10 percent, falling from $39.75 to $35.86. When excluding Medicare beneficiaries receiving the full or partial LIS, the decrease was much smaller at less than 2 percent over the same four-year period. The difference between these two enrollment groups may partly reflect the concentration of LIS beneficiaries in lower premium plans that qualify for the LIS benchmark. Conventional MA-PD average premiums are considerably lower, decreasing from $11.04 in 2022 to $10.18 in 2026. Without LIS enrollment, the conventional MA-PD average monthly premium observed a more sizable decrease of $3.75 over the same period.
This analysis estimates how average premiums will change for 2027 if beneficiaries remain enrolled in either continuing or newly corresponding plans renewed in the same service area. This estimate was calculated by combining the most recent plan-level enrollment data with the premiums beneficiaries would pay under those same plans next year if available. Using this approach, the estimated enrollment-weighted average monthly premium for stand-alone PDPs increases by about 44 percent to $51.47 in 2027. Excluding the LIS population, average premiums experience an even higher average premium increase (see Figure 1). Conventional MA-PDs, by contrast, are estimated to observe an average premium decrease of 23 percent, falling to $7.86 in 2027 when measuring total enrollment.
Figure 1: Estimated Average Monthly Medicare Part D Premiums, 2022–2027
Source: Author’s analysis of CMS landscape, enrollment, and plan crosswalk files.
Note: Average monthly premiums are enrollment-weighted using the most recent plan-level enrollment data for each year. Data for both plan types exclude offerings sanctioned by CMS and plans offered in U.S. territories. MA-PDs exclude SNPs, PFFS, and MSA plans.
These estimates of average monthly premiums do not fully capture the actual premium changes individual beneficiaries will encounter next year. Following CMS’ announcement ending the Part D Premium Stabilization Demonstration, The Wall Street Journal reported that federal officials expected around 25 percent of all stand-alone PDP enrollees see their Part D premiums “stay flat” or decrease in 2027. The article also noted that the officials expected that 30 percent of PDP beneficiaries would face premium increases of less than $10, while the remaining 45 percent of enrollees would endure increases largely in the range of $11 to $20 a month. CMS plan and enrollment data generally confirm the first claim that one in four PDP beneficiaries will experience flat or lower monthly premiums next year. The remaining 75 percent of beneficiaries, however, will see a wide range of premium increases. Forty percent of beneficiaries will face increases greater than $1 but less than $10 a month, 13 percent with increases between $10 and $20 a month, and 24 percent will see increases exceeding $20 a month. This suggests that a substantial share of Medicare beneficiaries that remain enrolled in the same plan for 2027 may encounter larger premium increases than earlier projections indicated.
Deductibles
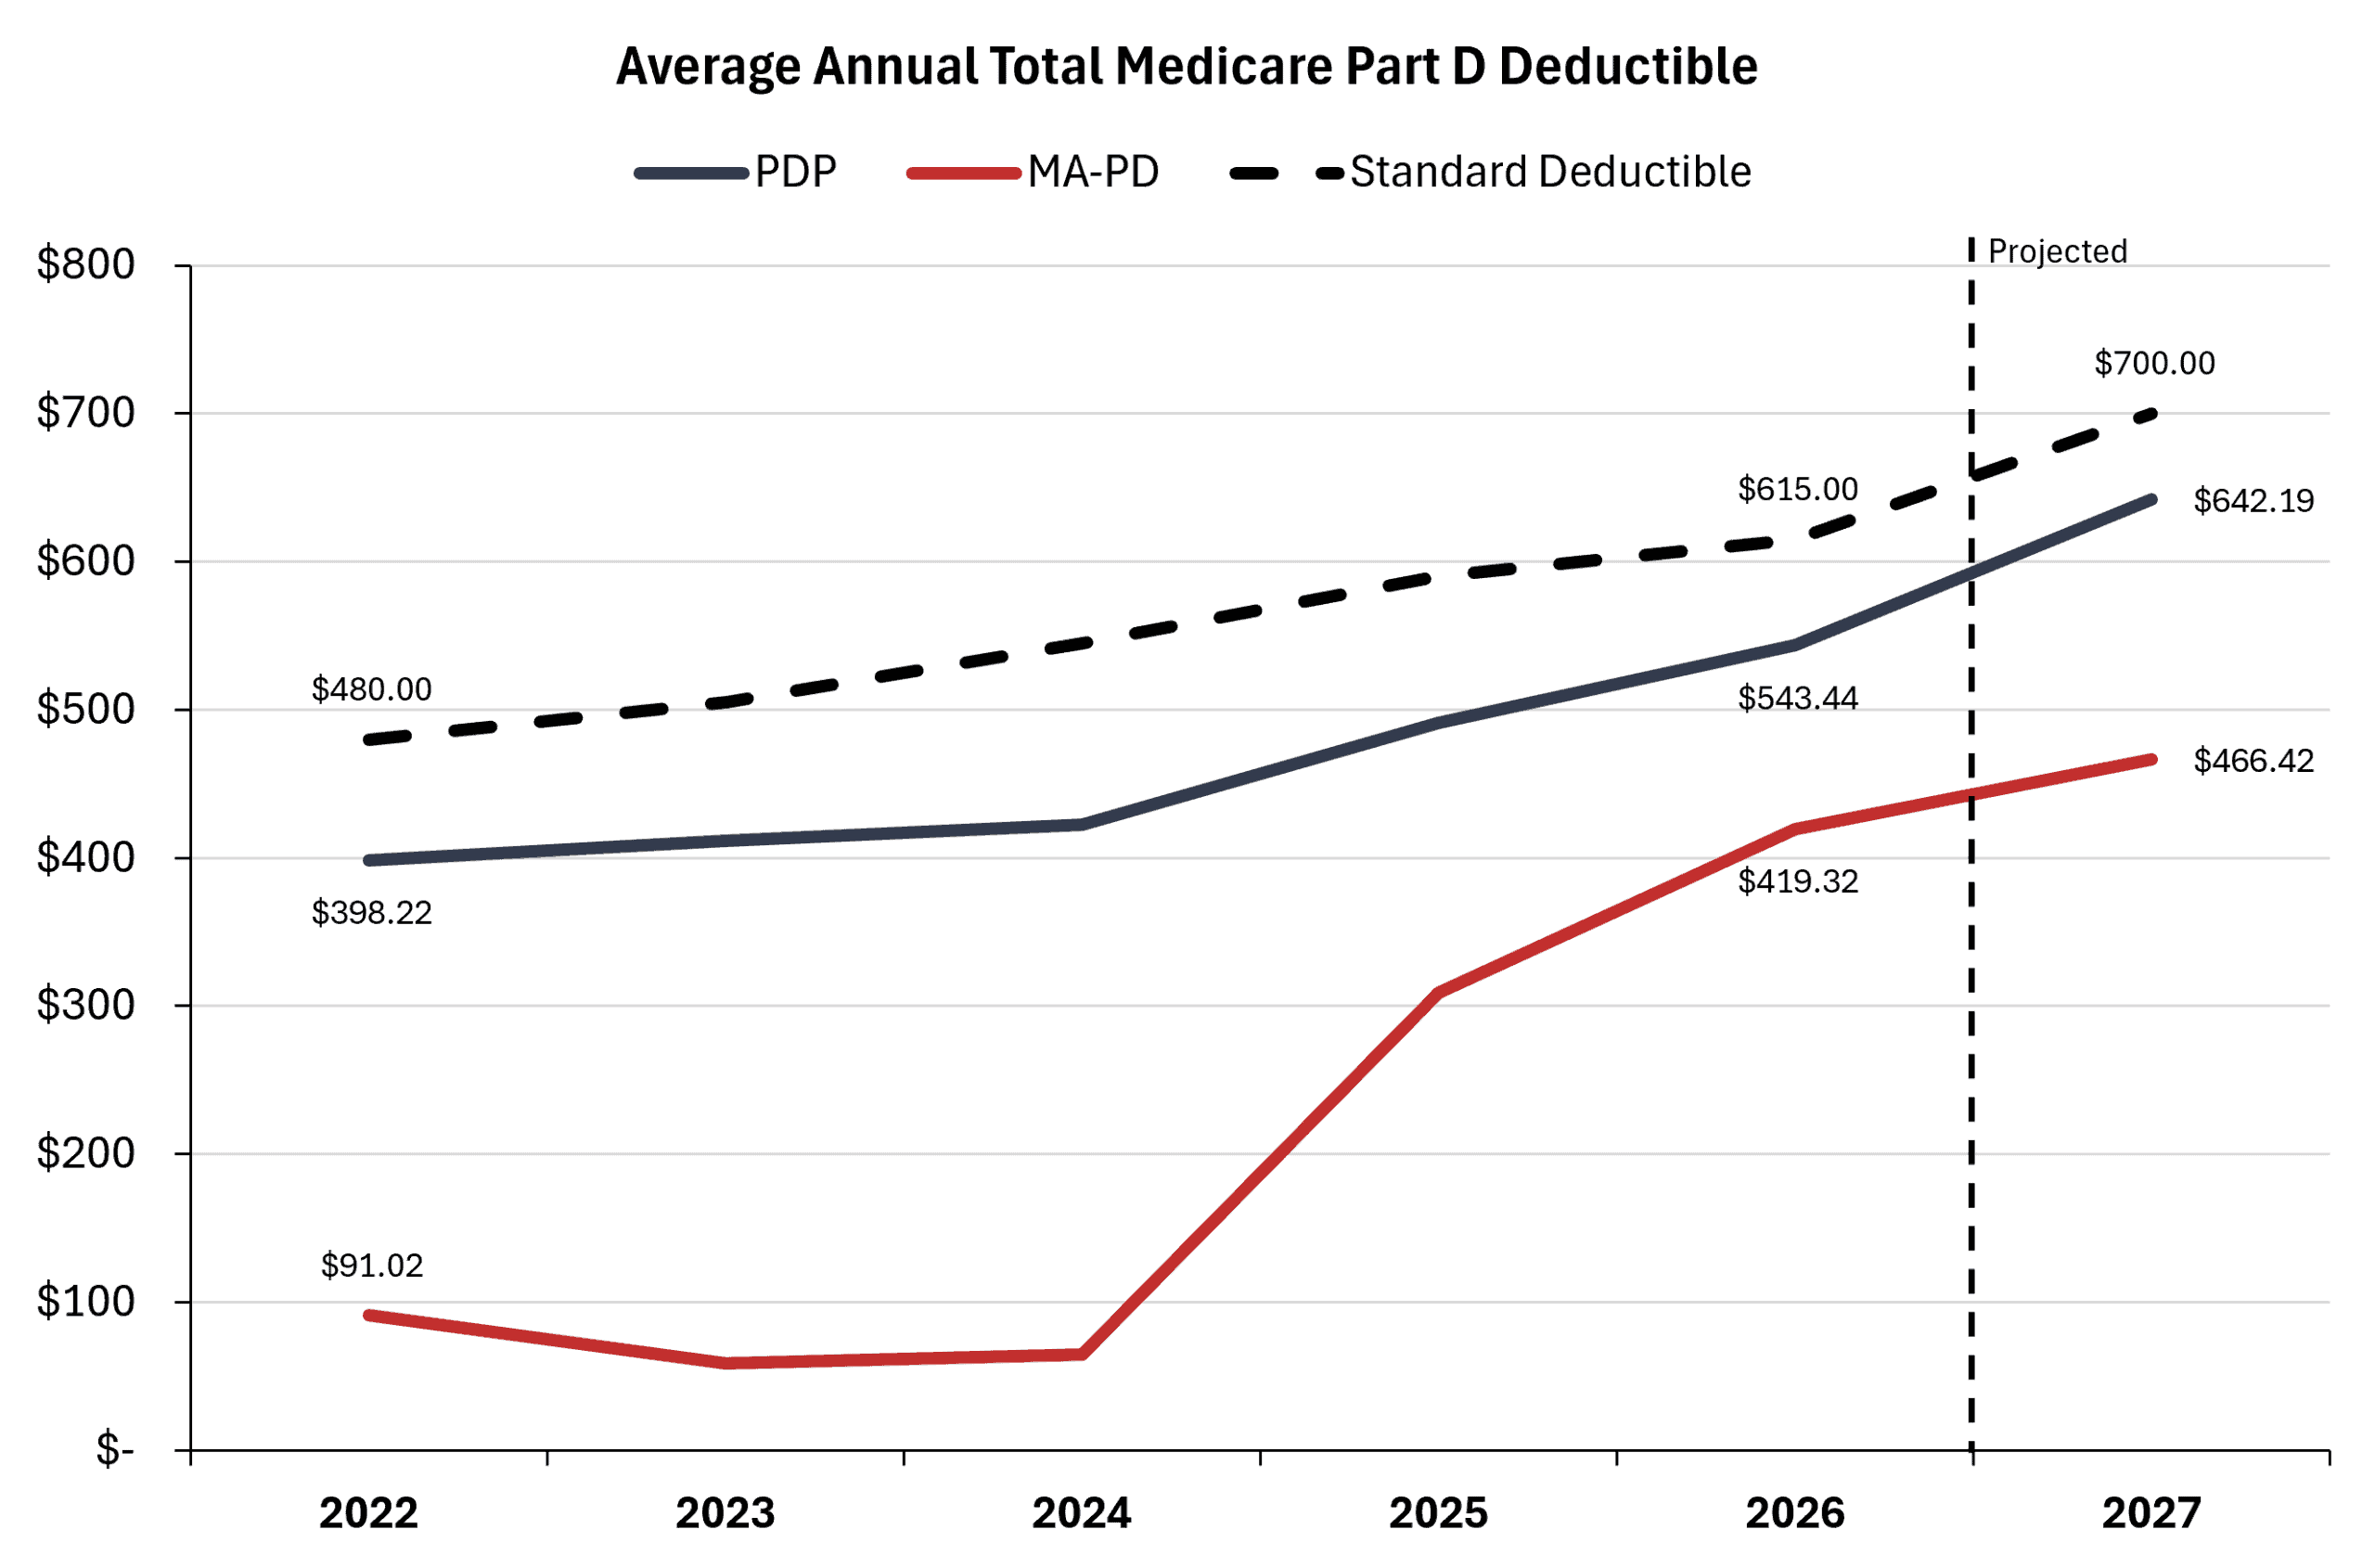
Annual deductibles, or the amount beneficiaries pay for prescription drugs OOP before their initial coverage phase begins, show a different trend from premiums. While the CMS press release on Part D market stability does not allude to changes in average Part D deductibles for next year, they are nonetheless a critical aspect of benefit design. Over the past four years, the enrollment-weighted average annual deductible for stand-alone PDPs grew by more than 36 percent, climbing from $398.22 in 2022 to $543.44 in 2026. More notably, the average annual drug deductible among conventional MA-PDs more than tripled over the same period, accelerating from $58.90 in 2024 to the current average of $466.42 in 2026 (see Figure 2). These trends are partially reflected in Table 1 above, which demonstrates how the number of both stand-alone PDPs and conventional MA-PDs providing drug coverage without an annual deductible has increasingly made up a smaller portion of total plans.
Figure 2: Estimated Average Annual Medicare Part D Deductible, 2022–2027
Source: Author’s analysis of CMS landscape, enrollment, and plan crosswalk files.
Note: Average annual deductibles are enrollment-weighted using the most recent plan-level enrollment data for each year. Data for both plan types exclude offerings sanctioned by CMS and plans offered in U.S. territories. MA-PDs exclude SNPs, PFFS, and MSA plans.
Using the same approach to determine average premiums for 2027, this analysis estimates that the enrollment-weighted average annual drug deductible for stand-alone PDPs will increase by more than 18 percent next year. At $642.12, this estimate is about $58 below the standard Part D deductible, once again reflecting how sponsors have narrowed enhanced plan features. Among conventional MA-PD offerings, the average deductible is estimated to increase by just over 11 percent in 2027, climbing to $466.42, but still significantly below the $700 standard Part D deductible. Continuing the trend in 2027, the number of Part D plans providing initial drug coverage without a deductible declined to just three among stand-alone PDPs and to 305 among conventional MA-PD sponsors. These changes suggest all Part D sponsors – particularly those offering conventional MA-PDs – have become less willing or able to maintain deductibles significantly below the basic benefit, and that relatively stable premiums can coincide with meaningful shifts in other components of Part D coverage.
Shifting Conditions Affecting Medicare Part D Sponsors
The data reflected above, including estimates for 2027, generally point to significant adjustments made by Part D plan sponsors. Although individual plan exits and consolidations are expected under normal market forces, the recent trends and irregularities in plan premiums, deductibles, and other benefit features may largely be the result of shifting regulatory conditions. Over the past four years, policymakers implemented several consequential reforms aimed at limiting or redistributing Part D costs across beneficiaries, plan sponsors, drug manufacturers, and the federal government. The Inflation Reduction Act (IRA) aimed to reduce the amount Medicare beneficiaries paid for drug coverage by eliminating cost-sharing in the catastrophic phase and establishing an annual limit on total OOP spending. At the same time, the IRA redesign reduced federal reinsurance payments and greatly increased the share of prescription drug spending borne by Part D plan sponsors. These changes have exposed Part D sponsors to more spending that was previously financed mostly through reinsurance payments, which created a stronger incentive for plans to narrow benefits and manage drug utilization.
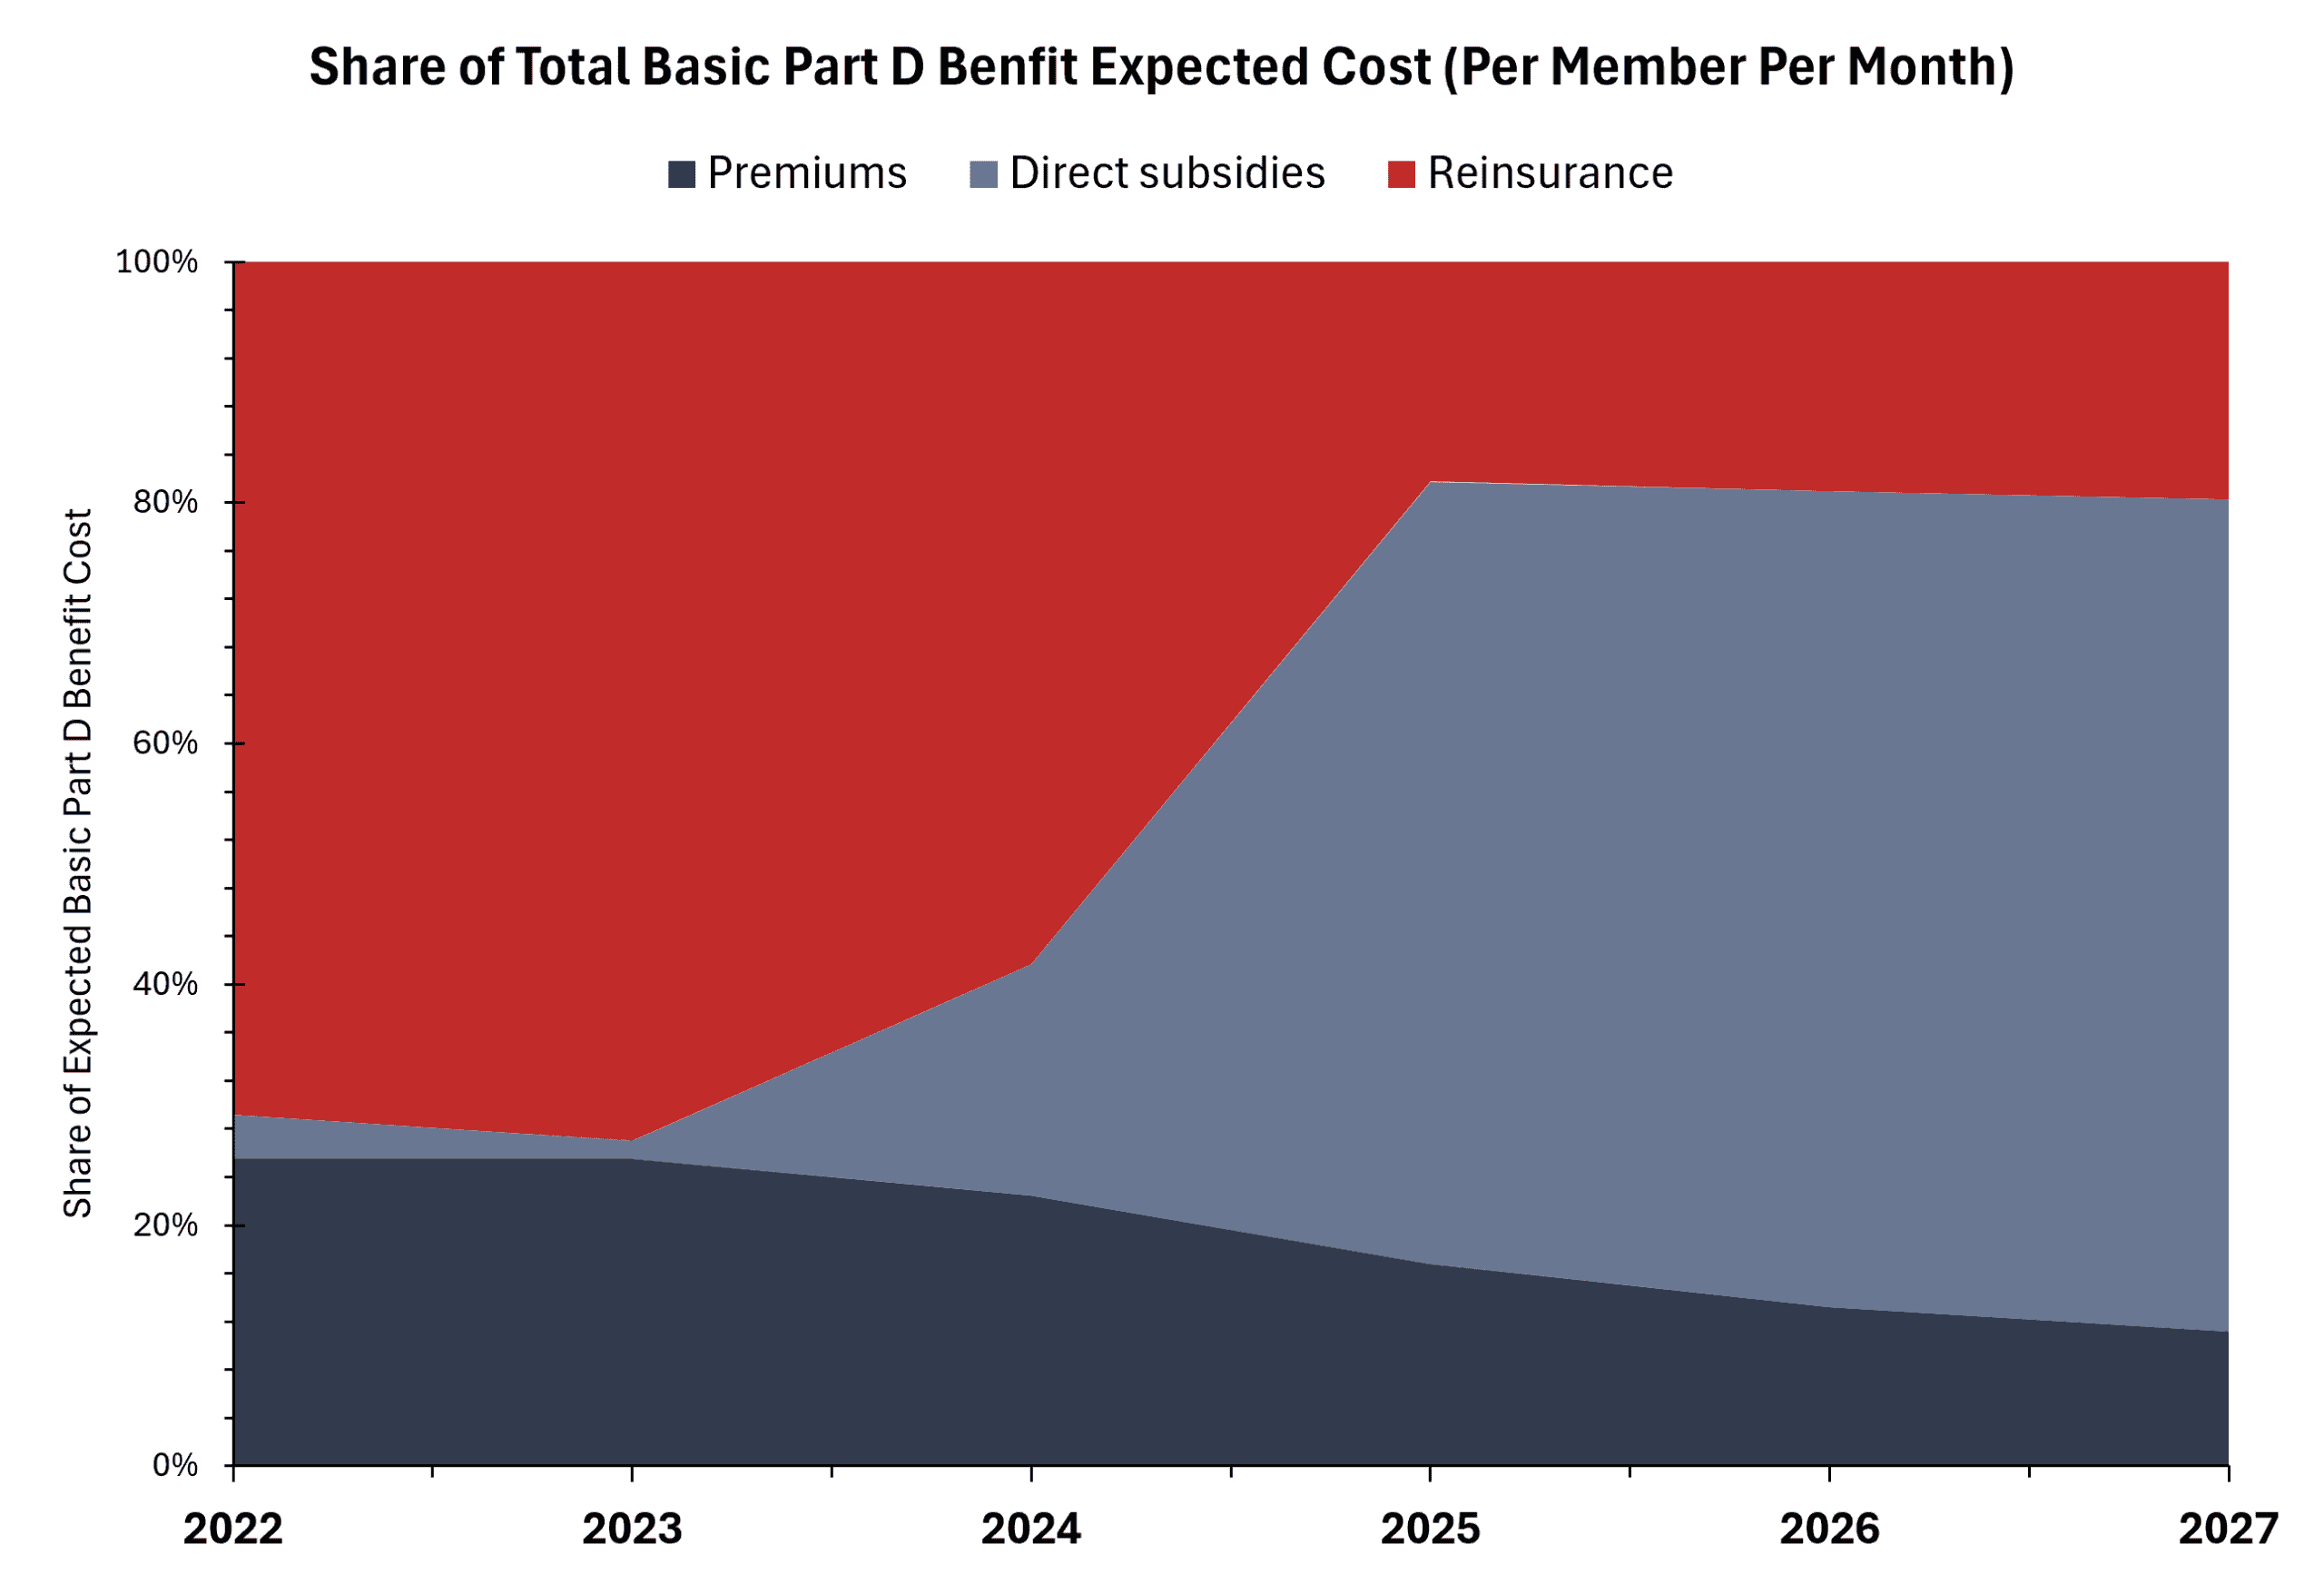
While heightened plan liability would be expected to result in higher premiums, the IRA also imposed a 6-percent cap on the annual growth of the base beneficiary premium. This provision restricts how quickly individual plans can adapt even when the underlying bids increase. As the Congressional Budget Office pointed out in a recent letter, this also meant that federal subsidies absorbed a greater share of prescription drug costs (see Figure 3). CMS also introduced the aforementioned premium stabilization demonstration in 2025 to provide additional subsidies (and greater risk corridors) to stand-alone PDPs through 2027 after large increases in national plan bids. Although CMS is ending the demonstration at the end of the year, the direct subsidies and limits on annual premium increases were successful in keeping PDP premiums stable following the Part D redesign. MA-PDs – who did not receive these temporary premium subsidies – continued to use rebate dollars to buy down premiums and other beneficiary costs.
Figure 3: Share of Total Basic Part D Benefit Costs, 2022–2027
Source: CMS’ annual Part D bid announcements; MedPAC
Shifts in prescription drug utilization following the Part D redesign have also added uncertainty about future drug spending. Several studies, including one cited in the most recent Medicare Payment Advisory Committee (MedPAC) report to Congress, note Part D plans observed higher-than-expected pharmacy costs for brand-name and specialty drugs such as GLP-1s. Beyond having capped OOP spending, beneficiaries in enhanced benefit plans have an even greater incentive to spend on prescription drugs, as these beneficiaries ultimately pay less in the initial coverage phase than those enrolled in less generous basic Part D plans. These provisions have greatly increased the share of Medicare beneficiaries that hit the catastrophic coverage phase, including those that reach the point of no cost-sharing early in the calendar year. Additional recent research suggests that existing Part D risk-adjustment methods – designed to adjust Medicare payments to plans based on the beneficiaries underlying health status – may not fully capture the recent trends in drug spending and utilization, as the model is calibrated with historical medical diagnoses and claims data.
Faced with greater financial liability for drug spending under provisions implemented under the IRA, and the greater-than-expected utilization of high-cost drugs in recent years, Part D plan sponsors have adjusted their coverage designs in ways that are not fully captured in premiums and deductibles alone. Most notably, Part D plans have largely switched to co-insurance style coverage (as opposed to fixed co-payments) for certain tiers in their drug formularies. One recent study noted that the share of stand-alone PDPs employing co-insurance in 2025 increased to around 83 percent, while the share of MA-PDs using co-payment for initial coverage of medications in less preferred formularies tiers dropped from 94 percent in 2024 to just 37 percent in 2025. These changes are significant because co-insurance cost-sharing structures are generally more expensive to the beneficiary at the point of service.
Formulary restrictions and utilization management represent another important component of Part D plan adjustments. With greater incentives to contain costs under the redesign, sponsors may have more reason to limit access to medications through formulary exclusions, prior authorization, step therapy, and quantity limits. Although current research is limited on how Part D insurers have responded to the IRA and other pressures with formulary restrictions and utilization management, some studies observe several trends pointing to less generous stand-alone PDP and MA-PD offerings over time. Such findings are also largely consistent with increases in annual deductibles shown above.
Conclusion
Although CMS characterizes the Medicare Part D market as broadly “stable” in advance of the open enrollment period for the 2027 plan year, observed changes in plan availability and beneficiary costs suggest a more complicated outlook. Since 2022, the number of stand-alone PDP and conventional MA-PD offerings nationally has declined by approximately 59 percent and 14 percent, respectively. In addition to declining plan availability, this analysis estimates an average premium increase of about 44 percent for stand-alone PDPs in 2027, while conventional MA-PD premiums decrease by roughly 23 percent and average annual deductibles increase across both plan types.
These trends have occurred amid significant market and regulatory pressures affecting Part D plan sponsors. Most notably, provisions implemented under the IRA have greatly increased plan sponsors’ financial liability for prescription drug spending, alongside uncertainty about future drug utilization and costs. Recent research also documents changes in various aspects of Part D plan benefit design, including drug formularies and cost-sharing arrangements. Taken together, this research and the analysis of recent landscape files challenge CMS’ characterization of a broadly “stable” Part D market.