








Insight
October 28, 2026
President Trump’s Steel and Aluminum Tariffs: 1.0 vs. 2.0
Executive Summary
- Over two terms, the Trump Administration has imposed increasingly high steel and aluminum tariffs with the promise of greater domestic employment and production within these industries; in practice, these tariffs have delivered neither a job nor production boom but have delivered higher prices – and foreign retaliation with far wider economic damages.
- Following President Trump’s comparatively moderate first-term steel and aluminum tariff hikes, his second-term’s 50-percent tariff regime has dramatically worsened the impact; these tariffs have resulted in the loss of an estimated 228,000 full-time jobs, driven an estimated 67-percent increase in one bellwether steel price in the last year alone, and increased estimated tariff costs by over 400 percent for steel and 700 percent for aluminum between 2024 and 2025.
- This insight reviews the history of President Trump’s steel and aluminum tariffs in his first and second terms, discusses the economic impacts these tariffs have had over time, and looks ahead to what the future may hold.
Introduction
Over two terms, the Trump Administration has imposed increasingly high steel and aluminum tariffs with the promise of greater domestic employment and production within these industries; in practice, these tariffs have delivered neither a job nor production boom but have delivered higher prices – and foreign retaliation with far wider economic damages.
Following President Trump’s comparatively moderate first term steel and aluminum tariff hikes, his second-term’s 50-percent tariff regime has dramatically worsened the impact. These tariffs have resulted in the loss of an estimated 228,000 full-time jobs, led to an estimated 67-percent increase in one bellwether steel price in the last year alone. Additionally, they have increased estimated tariff costs by over 400 percent for steel and 700 percent for aluminum between 2024 and 2025.
This insight reviews the history of President Trump’s steel and aluminum tariffs in his first and second terms, discusses the economic impacts these tariffs have had over time, and considers prospects for shifts in policy.
Overview of U.S. Steel and Aluminum Industry
The United States is one of the world’s largest steel producers, manufacturing about 82 million metric tons of steel products in 2025. In the same year, it consumed roughly 98 million metric tons of steel, of which about 23 million was imported. As the world’s largest steel importer, the United States imported steel from 79 countries and territories in 2025, including top producers such as Canada, Brazil, and Mexico. In 2025, it imported 4.4 million metric tons of crude and semi-fabricated aluminum products and produced only 660 thousand metric tons of primary aluminum products.
The U.S. steel manufacturing process is more advanced those of most developing countries. Approximately 70 percent of U.S. steel production uses electric arc furnace technology, as opposed to the traditional blast oxygen furnaces—which is less efficient and much more carbon-intensive.
New U.S. construction projects account for about 40 percent of annual steel consumption. Key industries that consume steel and aluminum products are construction, packaging, autos, appliances, and aviation. Recently, data center construction has become the main driver boosting the demand for steel in the country.
Trump 1.0 Steel and Aluminum Tariffs and the World’s Responses
In March 2018, President Trump imposed a 25-percent tariff on imported steel and a 10-percent tariff on imported aluminum. These tariffs initially covered close to $16 billion in steel imports and roughly $9 billion in aluminum imports, including various “derivative” products made from either metal. The administration later expanded the tariffs in January 2020 by applying the same 25 percent steel and 10 percent aluminum rates to 13 additional categories of derivative products, including certain nails, wires, automobile stampings, and other manufactured articles containing steel or aluminum.
President Trump imposed tariffs under Section 232 of the Trade Expansion Act of 1962, which allows the president to restrict imports deemed a threat to national security. Supporters argued that foreign governments subsidized production, creating overcapacity that threatened the U.S. industrial base; these measures would protect industries vital to national security.
The administration initially granted exemptions to Argentina, Australia, Brazil, Canada, Mexico, South Korea, and the European Union while negotiations continued. Argentina, Australia, and Brazil later reached alternative arrangements with the United States and received long-term exemptions. South Korea secured a permanent exemption from the steel tariff in exchange for an absolute quota equal to 70 percent of its average steel exports to the United States from 2015–2017, although its aluminum exports remained subject to the tariff. The administration granted exemptions to Canada and Mexico in May 2019 as part of negotiations surrounding the United States-Mexico-Canada Agreement (USMCA).
As shown in Table 1, major U.S. trade partners responded with a combination of retaliatory tariffs, World Trade Organization (WTO) challenges, and appeals for exemptions or quotas. Overall, the international response to Section 232 tariffs did not remain confined to the metals sector, leading to damaging retaliation against U.S. agriculture, consumer, and manufacturing markets.
Table 1. Major Trade Partners’ Responses to Trump 1.0 Steel and Aluminum Tariffs
|
Trade |
Response |
| China | China responded in April 2018, with retaliations worth approximately $3 billion. Covering $2 billion in U.S. agriculture exports, imposing a 25-percent tariff on eight products and a 15 percent tariff on 120 products, including pork, fruit, wine, ginseng, and tree nuts. China continued to push back on U.S. measures, and its response to the steel and aluminum tariffs soon became part of the much broader U.S.-China trade war. |
| Canada | Canada imposed retaliatory tariffs in July 2018 on 231 products, applying a 25-percent tariff to certain steel products and a 10-percent tariff to other U.S. goods. |
| Mexico | Mexico imposed tariffs of between 15–25 percent on products such as pork, cheese, potatoes, fruit, cranberries, and whiskey. Agriculture accounted for approximately 79 percent of Mexico’s retaliation package, reflecting an effort to place pressure on politically influential U.S. farming regions. Both countries removed their countermeasures in May 2019 after the United States lifted its steel and aluminum tariffs, helping clear the way for the approval of the USMCA. |
| European Union | European Union initiated a WTO dispute and imposed approximately $3.3 billion in retaliatory tariffs on prominent U.S. goods — products such as motorcycles, bourbon, and other goods closely associated with particular U.S. industries and states — with rates ranging from 10–50 percent. In 2021, the Biden Administration replaced the tariffs on European metals with a tariff-rate quota, and the EU suspended its retaliatory measures. |
Trump 2.0 Steel and Aluminum Tariffs and the World’s Responses
Soon after President Trump took office in 2025, he revived and expanded the steel and aluminum tariffs first imposed in 2018. In February 2025, the administration raised the aluminum tariff from 10–25 percent and eliminated all country exemptions, tariff-rate quotas, and product exclusions. The revised tariffs were expanded to include additional derivative products and took effect on March 12, 2025.
In June 2025, the administration doubled the steel and aluminum tariff rates to 50 percent. The United Kingdom (UK) was able to maintain a 25-percent rate under its bilateral agreement, while tariffs on most derivatives applied solely to foreign metal content. In August 2025, the administration launched the Section 232 “inclusions process,” adding over 400 additional Harmonized Tariff Schedule (HTS) classifications and expanding the number of downstream manufactured products subject to the tariffs. After widespread concerns over affordability began to rise, the administration altered the structure of its metal tariffs to simplify compliance by creating “buckets” of products based on their metal content.
Most recently, on July 20, 2026, President Trump announced an investment incentive program to boost domestic aluminum production. Companies making approved onshoring plans and domestic investments in U.S. primary aluminum facilities can import specified aluminum volumes at a reduced 25-percent tariff, rather than the standard 50-percent rate, provided meaningful construction begins by January 20, 2029.
As shown in Table 2, U.S. trade partners responded to the second Trump Administration’s tariffs with immediate retaliatory tariffs on U.S. exports, unlike the negotiation strategy deployed by most partners during the first term.
Table 2. Major Trade Partners’ Responses to Trump 2.0 Steel and Aluminum Tariffs
|
Trade Partner |
Response |
| China | China folded the steel and aluminum dispute into the broader U.S.-China trade war rather than responding with a metals-specific package. Through three rounds of retaliation between February and April 2025, China expanded tariffs until all U.S. imports were covered, with bilateral tariff rates briefly reaching 145 percent on Chinese goods and 125 percent on U.S. goods before both sides agreed to reduce rates under the Geneva Truce. |
| Canada | Canada responded immediately with 25 percent tariffs on $29.8 billion in U.S. goods, including steel, aluminum, and other consumer products. By September 2025, Canada had removed most consumer-goods retaliation while maintaining tariffs on U.S. steel, aluminum, and automobiles as leverage ahead of the 2026 USMCA review which has now not been renewed. |
| India | India stopped short of imposing new tariffs. Instead, it twice notified the WTO of proposed retaliation, increasing the value of its planned duties from $1.91 billion to $3.82 billion after the U.S. tariff increase, but ultimately held the measures in reserve while negotiating a bilateral trade agreement with Washington. |
| European Union | The EU initially responded to the president’s second-term metal tariffs by announcing a return of suspended 2018 and 2020 countermeasures alongside a second package targeting roughly $18–26 billion in U.S. exports. Those measures were repeatedly delayed as negotiations progressed and were ultimately suspended after the United States and EU reached a July 2025 framework to cap most U.S. tariffs on EU goods at 15 percent.
On July 1, 2026, the EU levied quota-based tariffs on steel imports, which would allow duty-free import of 18.3 million tons of steel annually. Steel imports that exceed the quota will be subject to a 50-percent tariff. Notably, the steel tariffs stack on top of the EU’s carbon border adjustment mechanism, the bloc’s environmental regulation that levies a tax on imported steel and aluminum products based on their carbon emissions. |
| Others | The UK, Japan, and South Korea chose negotiation over retaliation. The UK secured a temporary 25-percent tariff rate while broader trade talks continued, and Japan and South Korea focused on broader trade frameworks and investment commitments rather than countermeasures, even though their steel and aluminum exports largely remained subject to the Section 232 tariffs. |
Impact of the Tariffs
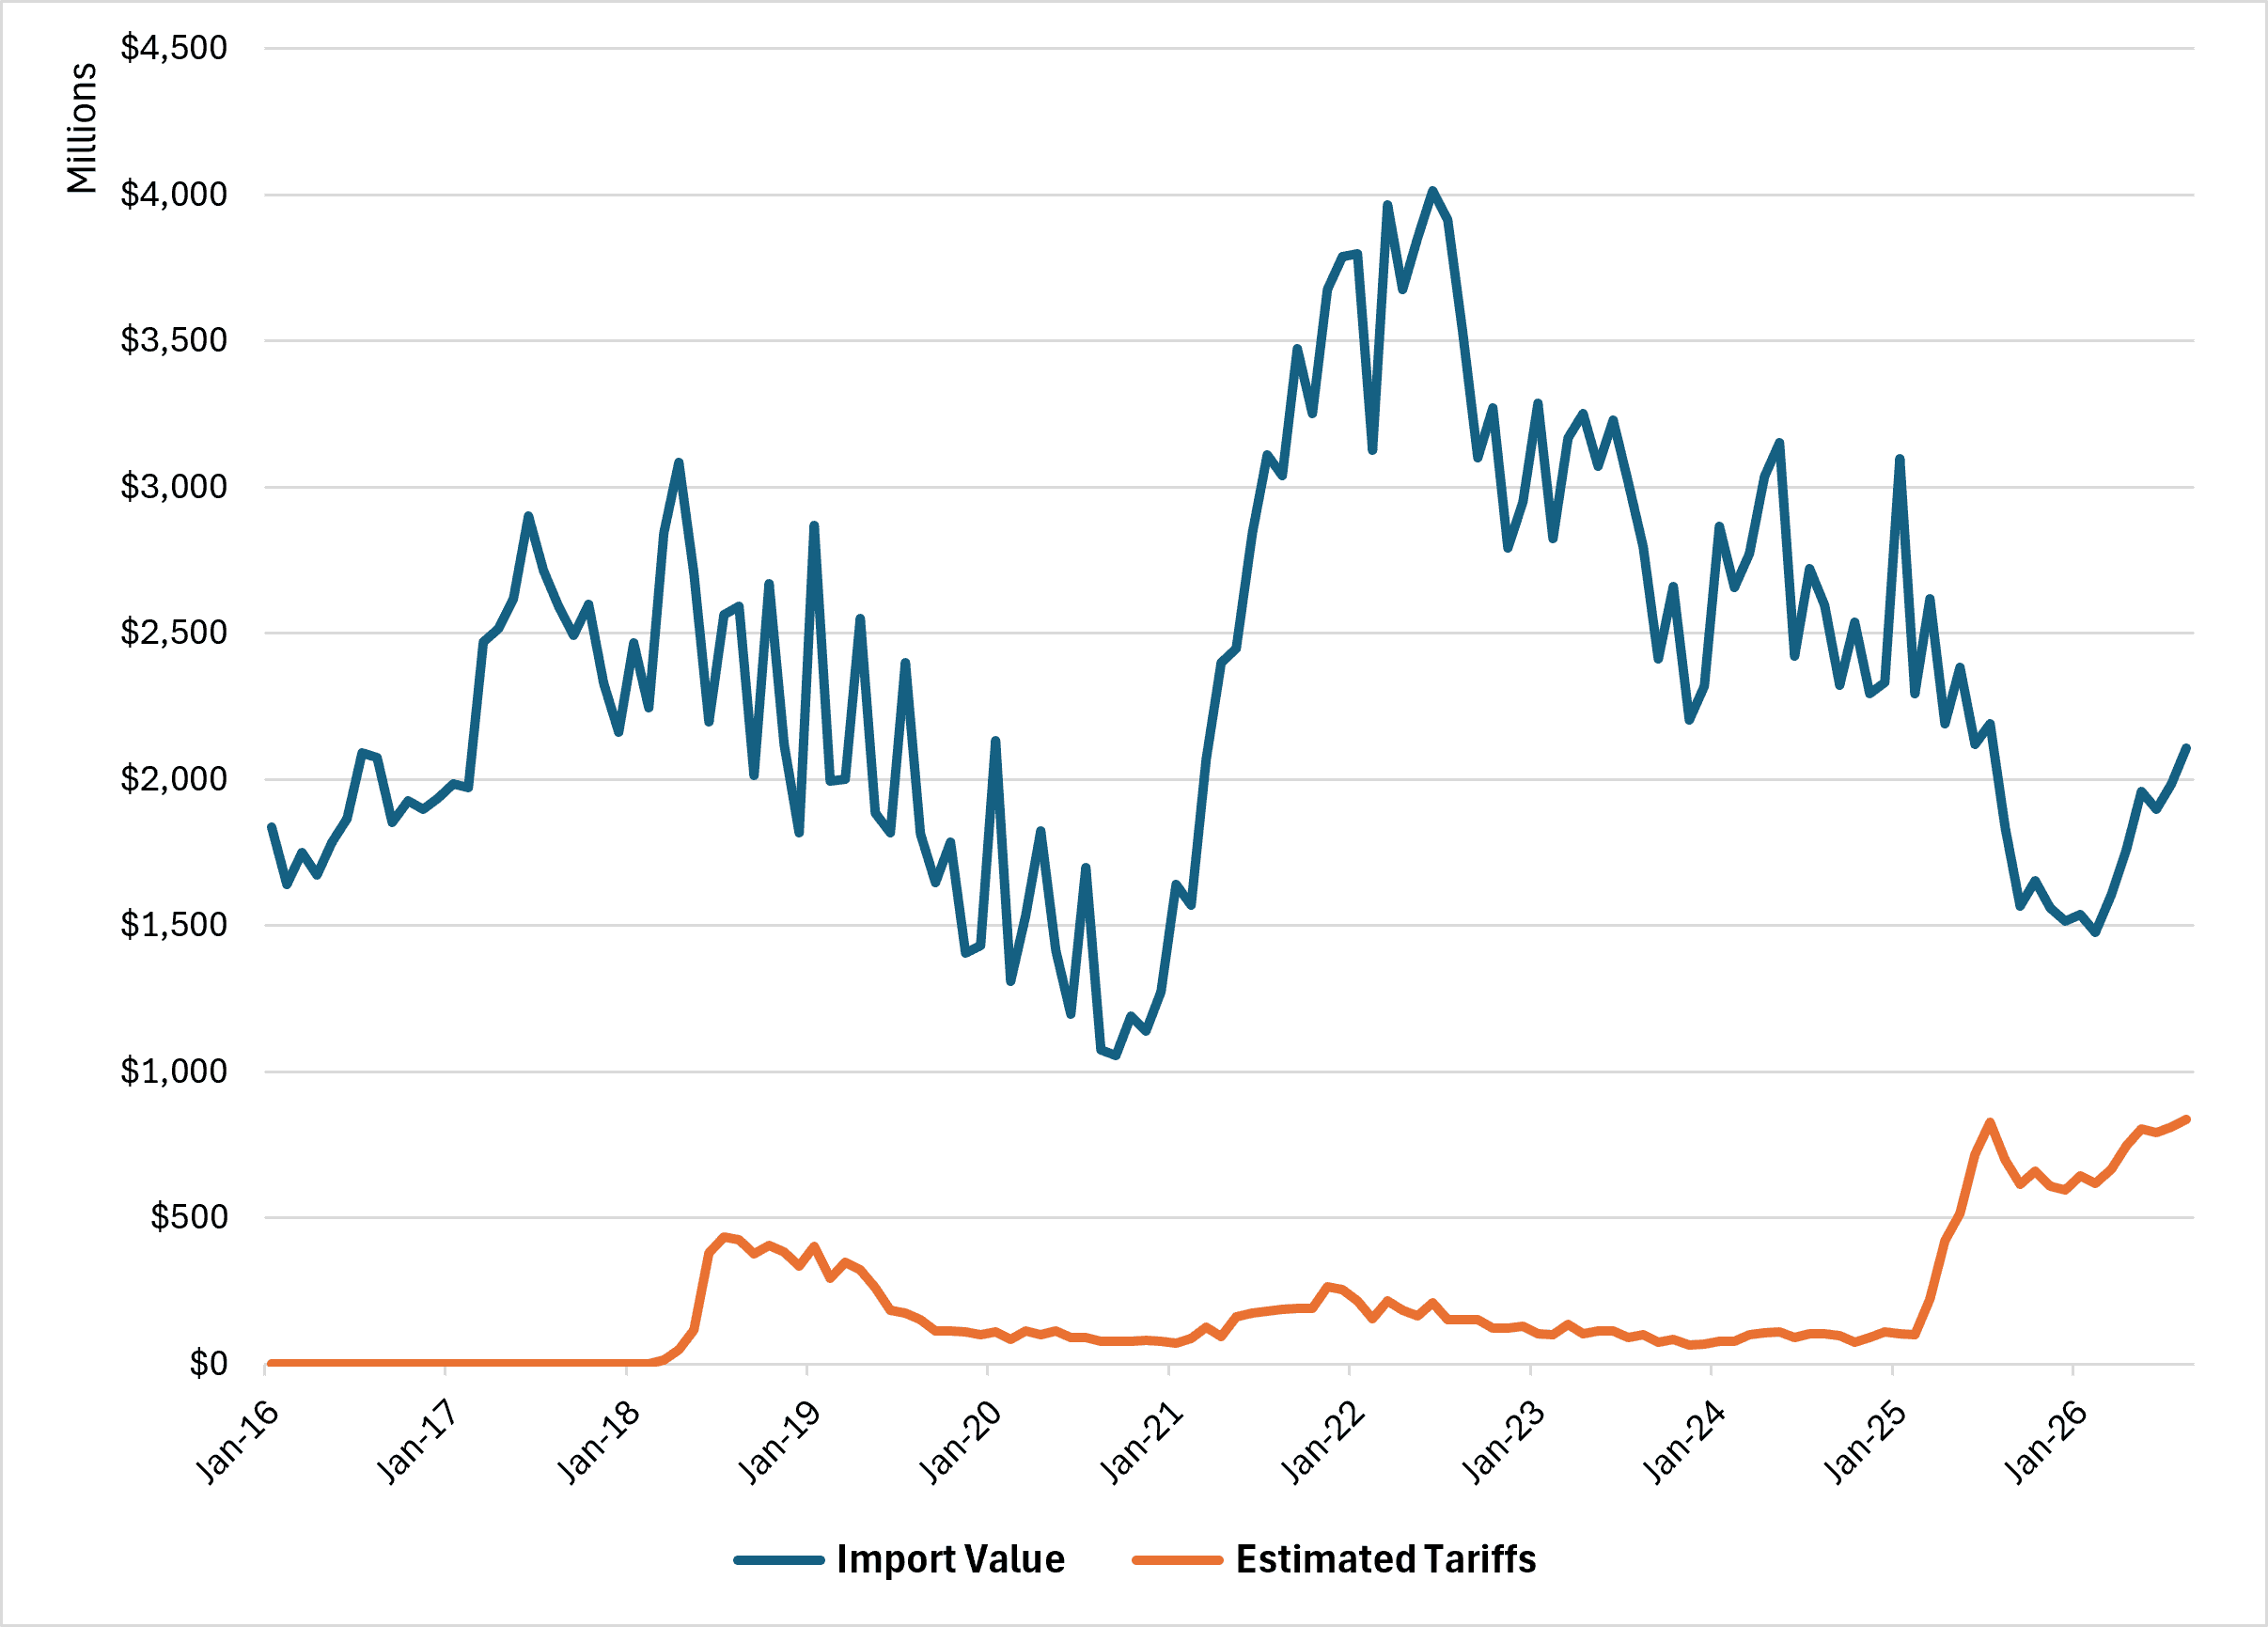
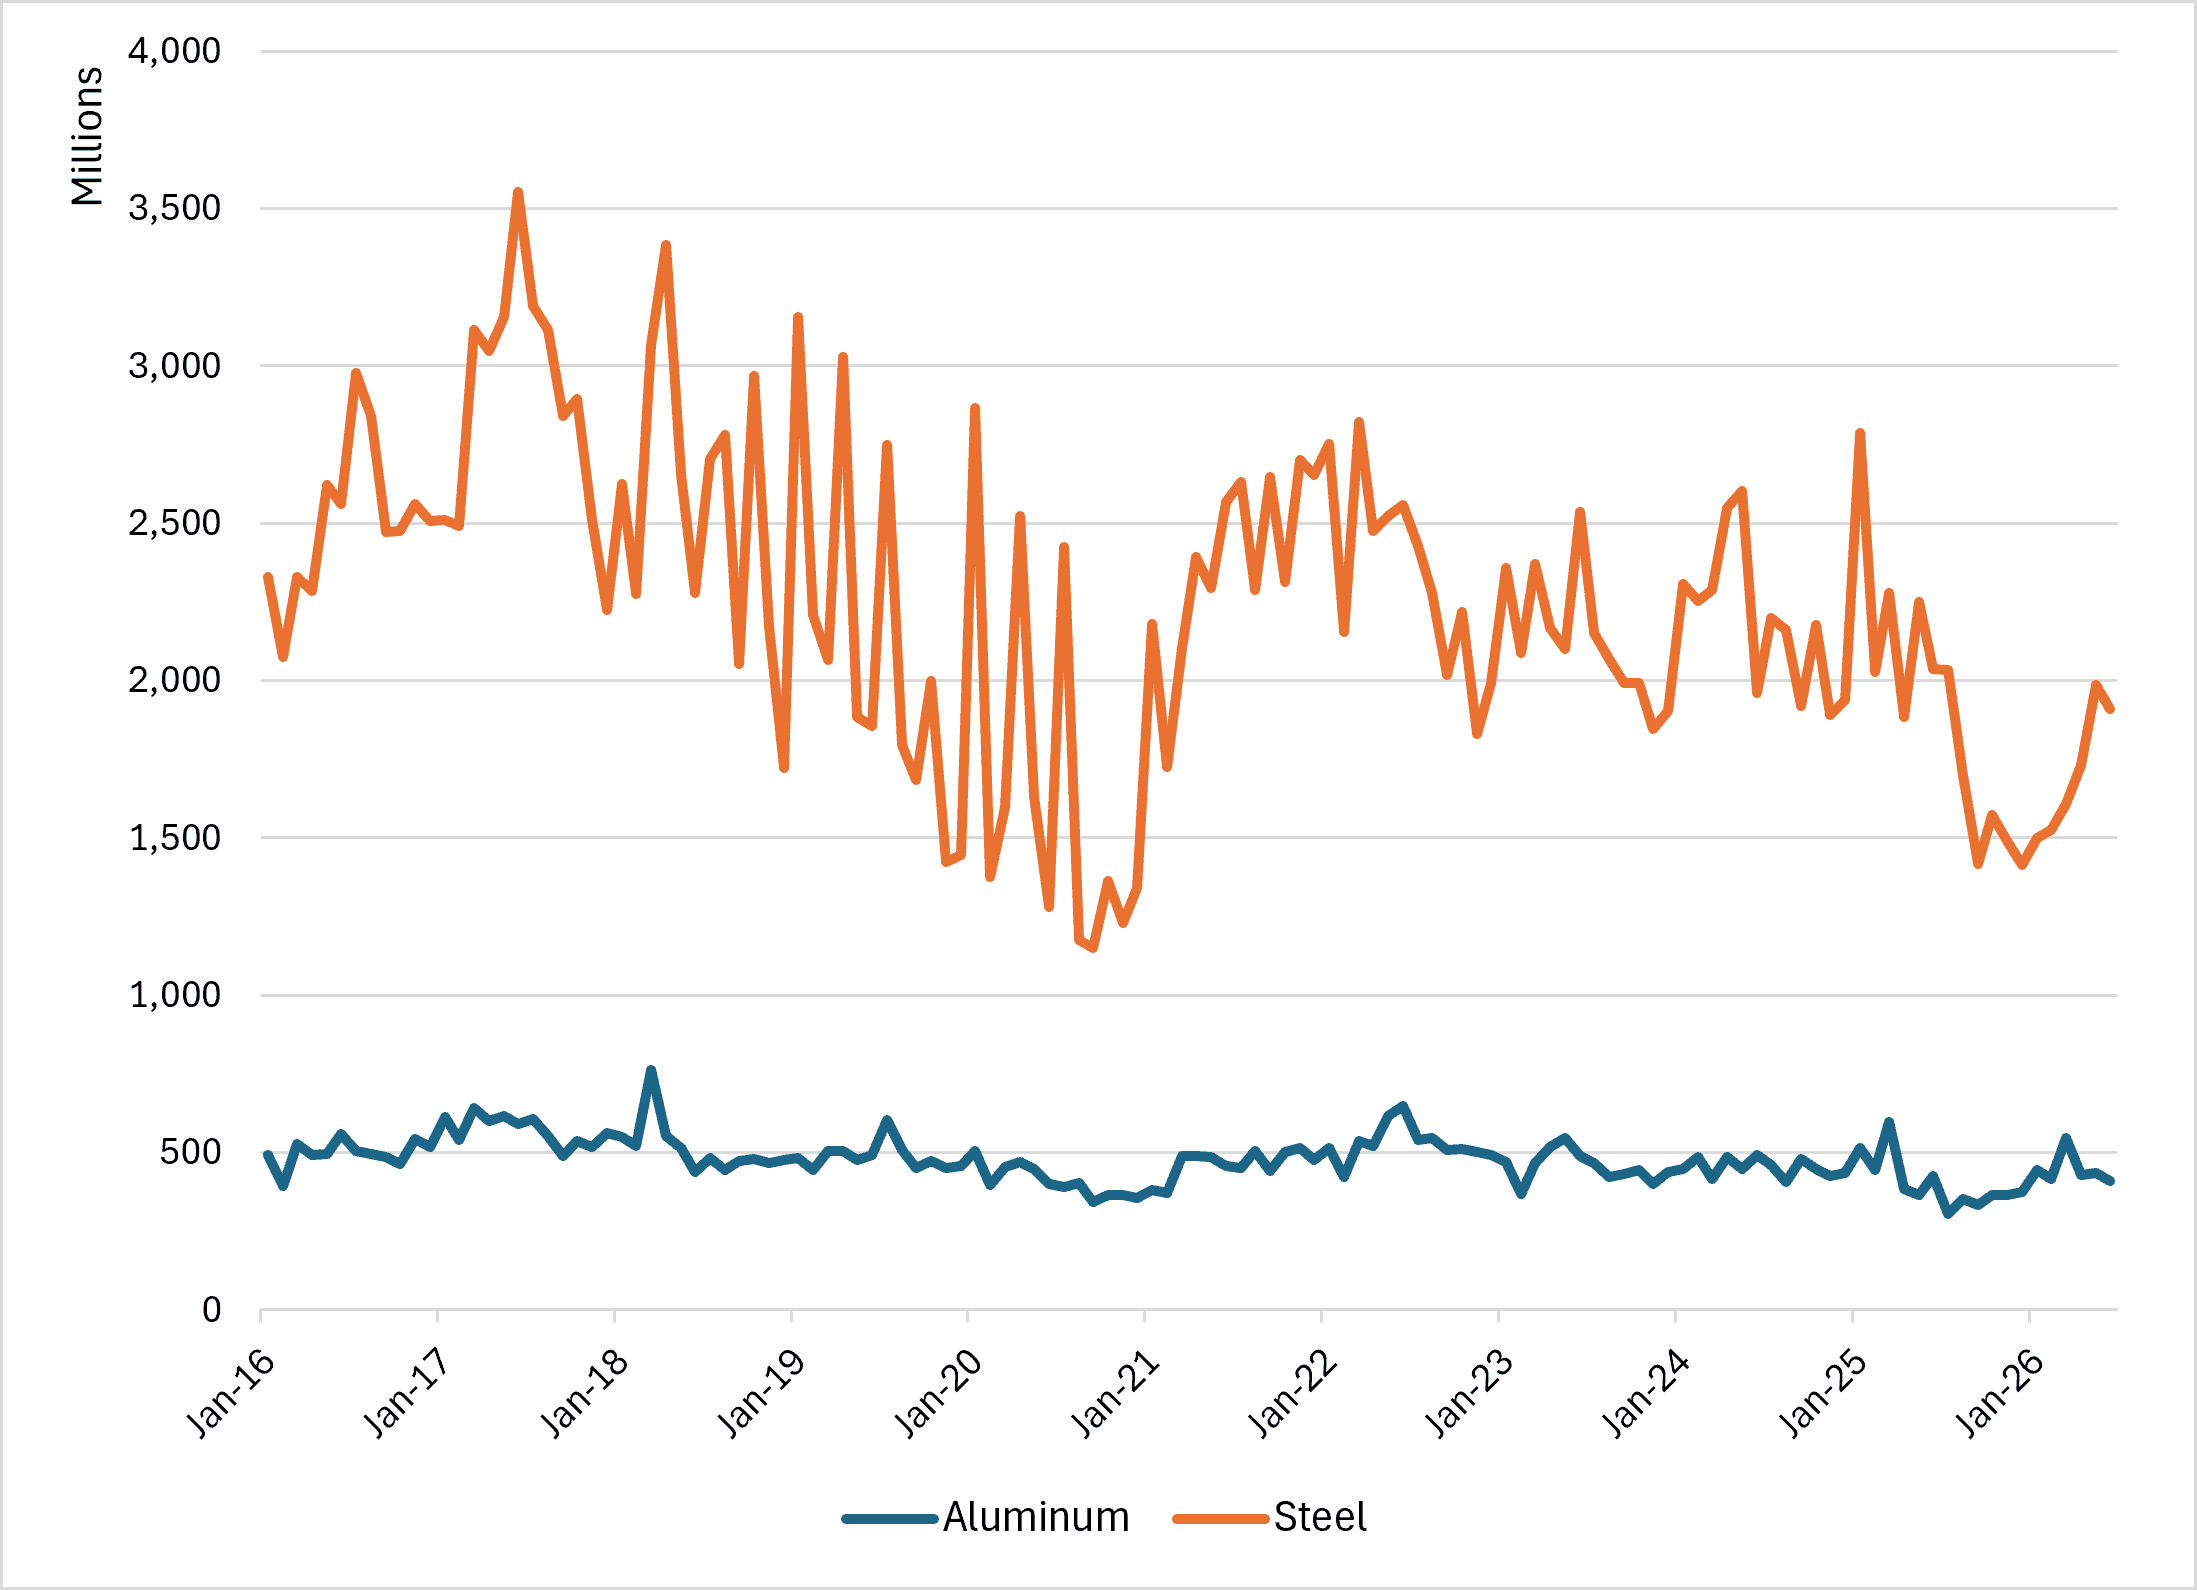
The United States imports tens of billions of dollars’ worth of steel, aluminum, and derivative products annually. Imports of steel mill products have generally declined over the past decade, rising substantially during the Covid-19 pandemic due to bottled up demand, import price inflation, and higher global steel prices. In 2025, U.S. imports of steel totaled roughly $25 billion, a 21-percent decrease compared to 2024 (See Figure 1). In the first half of 2026, the value of steel imports is down 30 percent compared to the same period in 2025, and nearly 40 percent compared to 2024. Looking solely at the weight of imported steel in kilograms, the picture remains the same, as imports are down 23 percent in the first half of 2026 (See Figure 3).
As also shown in Figure 1, the estimated impact of tariffs on steel imports greatly increased under both Trump Administrations. In 2025, estimated tariff costs rose over 400 percent compared to 2024, with the average effective tariff rate rising from 3.6 to a little more than 24 percent. In the first half of 2026, the average effective tariff rate is right around 40 percent. This is a significant uptick even compared to President Trump’s first wave of tariffs during his first term as the average effective tariff rate sat around 11 percent in 2019 and slowly fell as more carveouts were made with trade partners.
Figure 1: U.S. Imports of Steel and Estimated Tariffs
 Source: The United States International Trade Commission
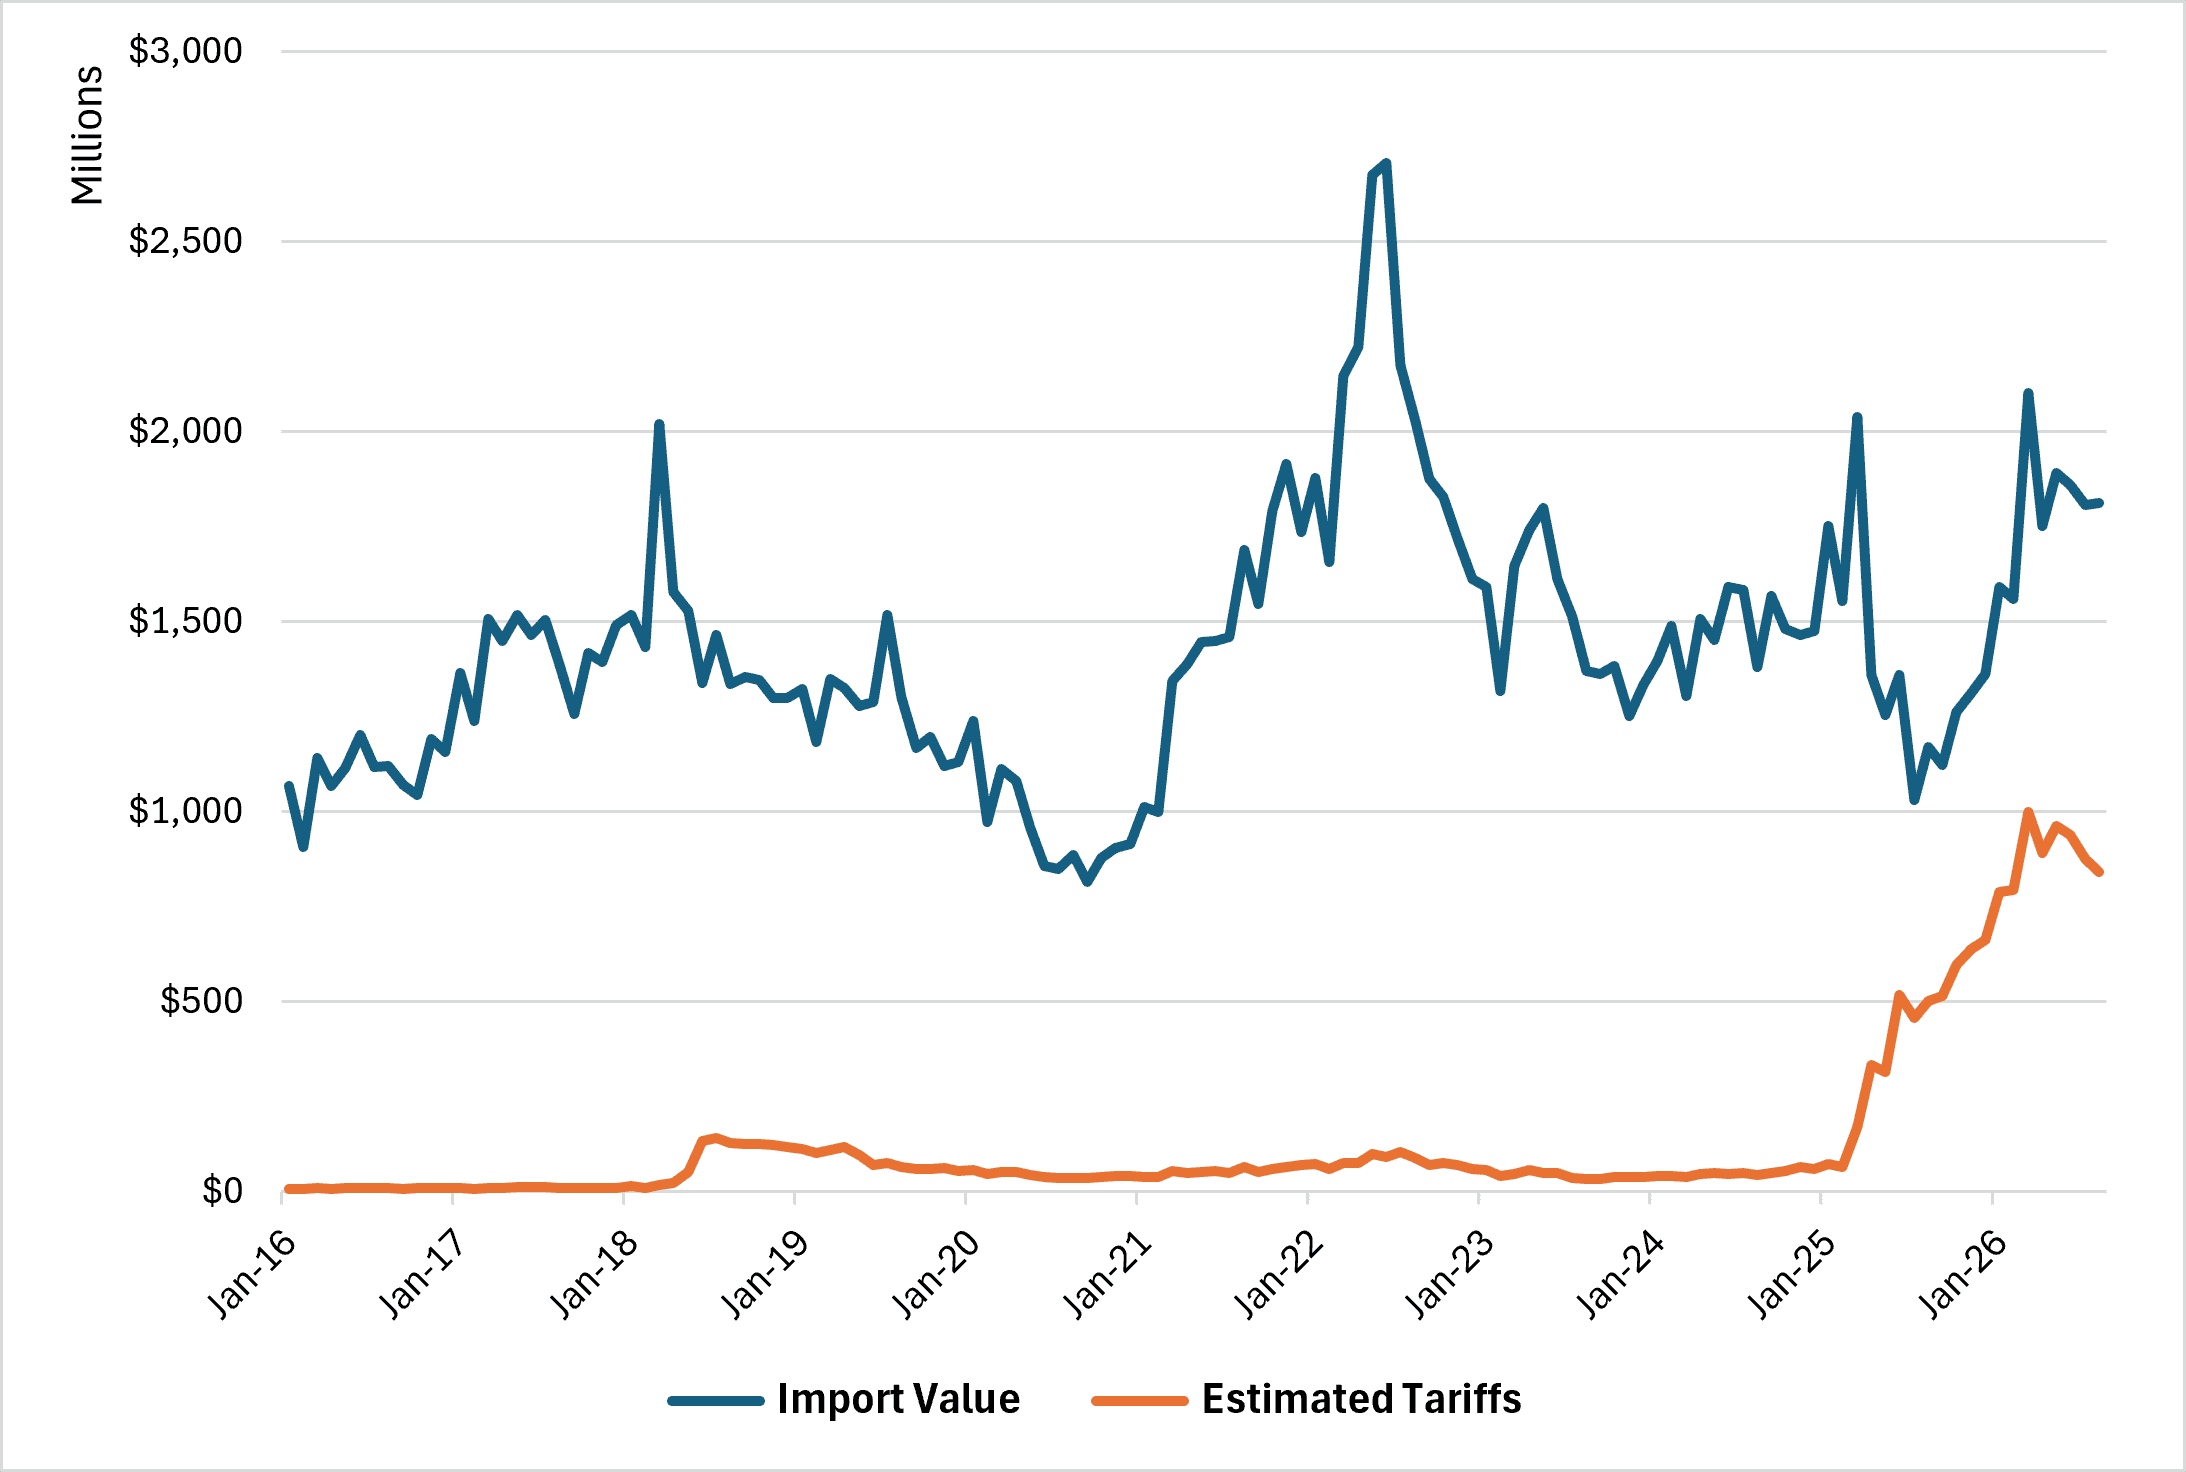
In 2025, aluminum imports fell to $16.5 billion from $17.7 billion in 2024, a 6-percent decline (see Figure 2). In the first half of 2026, the value of aluminum imports rose by 15 percent compared to the same time in 2025, and 23 percent compared to 2024. Looking at the weight of imports in kilograms, however, imported aluminum is down roughly 2 percent in the first half of 2026.
As displayed in Figure 2, the total aluminum tariff bill has risen sharply during the second Trump Administration. In 2025, estimated tariff costs rose over 700 percent compared to 2024, with the average effective tariff rate rising from 3.3 percent to a little more than 29 percent. In the first half of 2026, the average effective tariff rate hit 49.9 percent; it has declined slightly in July and August. This marks a drastic increase in tariff rates for imported aluminum as the average effective rate was between 5.8–6.5 percent from 2018 to 2019, falling as agreements were struck with trade partners.
Figure 2: U.S. Imports of Aluminum and Estimated Tariffs
 Source: The United States International Trade Commission
Figure 3: U.S. Imports of Steel and Aluminum (Kilograms)
 Source: The United States International Trade Commission
The Section 232 steel and aluminum tariffs implemented in 2018 sought to strengthen domestic metal production by reducing reliance on imports and encouraging domestic investment. In reality, economists found that the tariffs produced mixed economic outcomes. While they provided some protection for domestic producers, they also raised input costs for downstream manufacturers and generated only modest gains in U.S. production.
As shown in Figure 4, the Tax Foundation estimated that the Section 232 tariffs from 2018 to 2021 increased imported steel prices by 22.7 percent and aluminum prices by 8.0 percent, contributing to modest increases in domestic prices and passing most of the tariff cost onto U.S. importers. As a result, steel imports declined by 24.0 percent and aluminum imports by 31.1 percent. Although the tariffs provided some protection for domestic producers, their impact on domestic output was relatively modest, increasing steel production by 1.9 percent and aluminum production by 3.6 percent annually.
Figure 4: Estimates of the Section 232 Tariffs’ Effects From 2018 to 2021
|
Steel |
Aluminum |
|
| Change in Imports |
-24% |
-31.1% |
| Change in Production |
+1.9% |
+3.6% |
| Change in Imported Price |
+22.7% |
+8.0% |
| Change in Average Price |
+2.4% |
+1.6% |
| Change in Domestic Price |
+0.7% |
+0.9% |
Source: Tax Foundation: “How the Section 232 Tariffs on Steel and Aluminum Harmed the Economy”
Despite these industry-level gains, the broader economic effects were negative. Section 232 steel and aluminum tariffs are estimated to have reduced long-run U.S. GDP by 0.2 percent, reduced the capital stock by 0.2 percent, and eliminated the equivalent of approximately 228,000 full-time jobs (according to the data as of July 2026), while having little measurable effect on pre-tax wages.
As steel and aluminum prices increased, those metals became less competitive against potential alternatives, offsetting many of the gains realized by domestic metal producers. Higher metal prices affected downstream industries that rely on steel and aluminum as production inputs, contributing to an estimated $3.4 billion annual reduction in output across the economy between 2018 and 2021, with the construction and automotive sectors experiencing the largest impacts.
The second Trump Administration largely reversed the negotiated framework established after the original Section 232 tariffs. The 2025 expansion removed many country-specific exemptions and limited the use of tariff-rate quotas by restoring broader application of Section 232 duties across trading partners. The administration also expanded Section 232 coverage to hundreds of derivative steel and aluminum products and initiated a Section 232 investigation into copper imports, signaling a broader use of national security authorities to protect domestic metals industries. While the administration claims these measures will further encourage domestic manufacturing and investment in steel, aluminum, and copper production, the higher tariffs are also expected to increase production costs for downstream manufacturers that rely heavily on these metals as production inputs.
These changes reflect a shift away from negotiated quota arrangements toward a more uniform tariff regime in President Trump’s second term, increasing compliance requirements for importers while reducing the flexibility previously afforded under bilateral agreements.
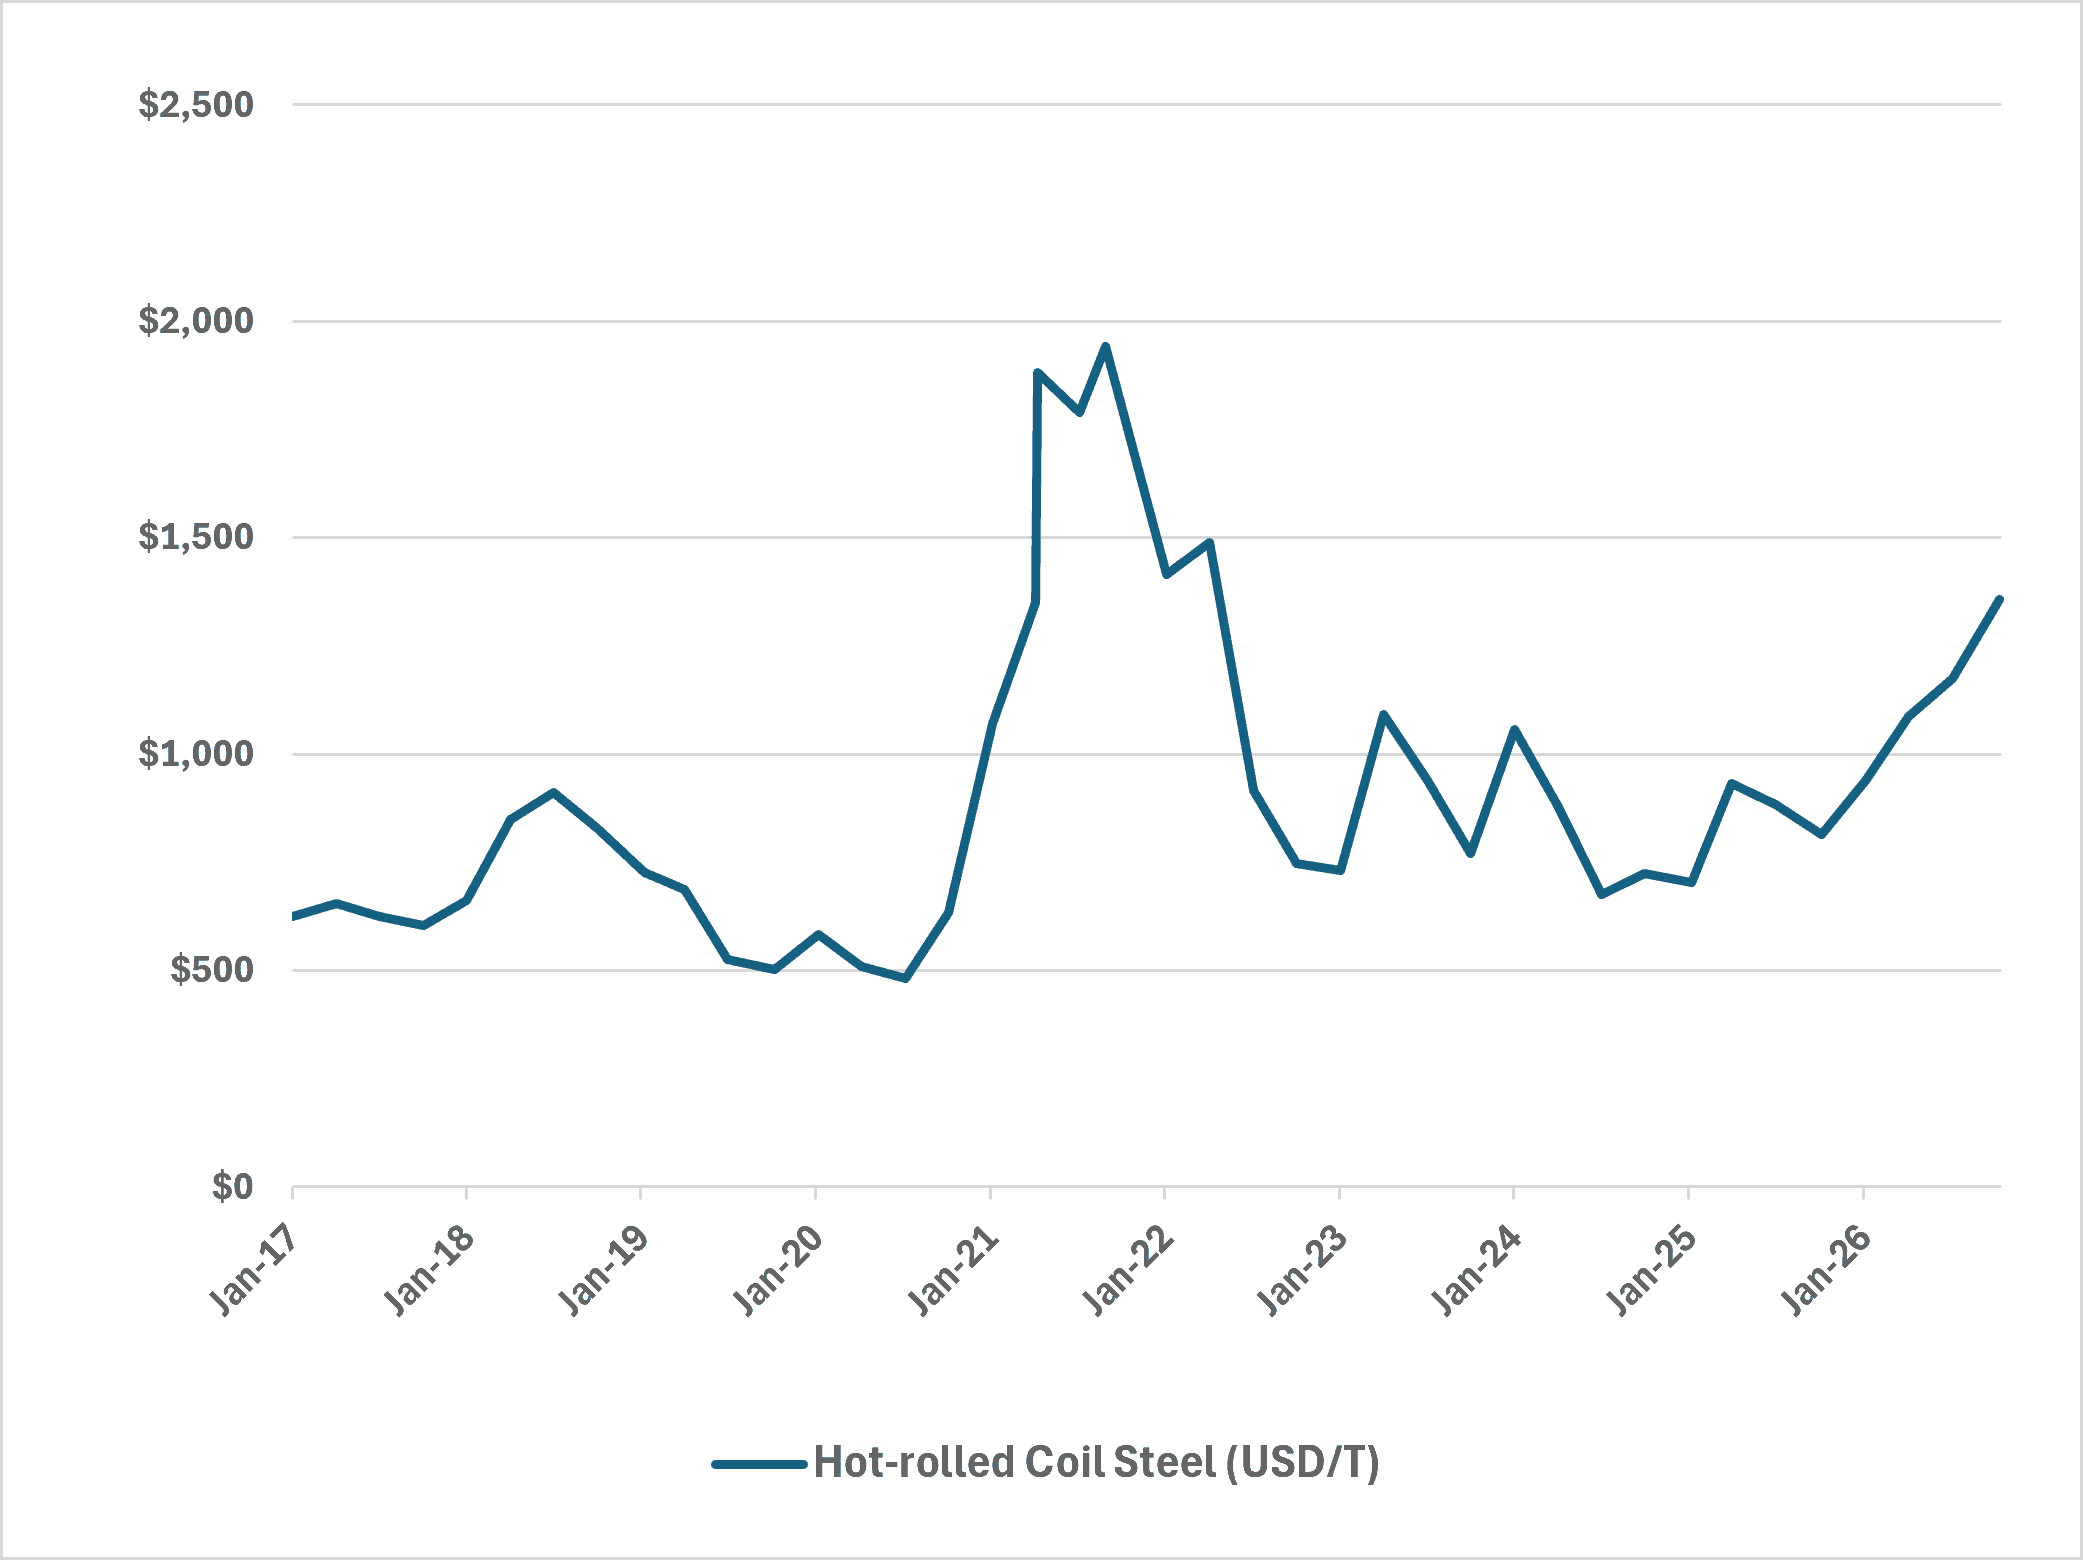
Figure 5: Price of Hot-rolled Coil Steel (Steel Product Benchmark)
Source: Trading Economics
As shown in Figure 5, U.S. steel prices recently reached a four-year high at $1,357 per short ton for hot-rolled coil steel in October 2026 (a widely used steel product benchmark), a 67-percent year-over-year jump. This was largely driven by President Trump’s significant second-term steel and aluminum tariffs. The last time U.S. steel prices spiked to similar levels was between 2021 and 2022. This previous spike was under different circumstances, however, as it was a result of pandemic-era inflation and a surge in demand while supply continued to remain constrained.
Looking Ahead
While steel and aluminum tariffs have changed in scale and scope since President Trump’s first term in office, it appears they are here to stay for the foreseeable future. The administration has offered few exemptions or lower rates for allied nations, even closely integrated trade partners such as Canada and Mexico. The most plausible scenario is that steel and aluminum tariffs see added exemptions and slightly lower rates attached to USMCA negotiations – as long as both Canada and Mexico agree to maintain a high tariff wall of their own against foreign metals. (There is speculation that recent U.S.-Canada negotiations may result in a tariff rate as low as 15 percent for Canadian steel.)
Furthermore, just as the Biden Administration lowered the average effective tariff rates for each metal via a tariff-free quota system, a future administration may follow a similar trajectory. The most likely trade partners to receive a quota would be South Korea, Japan, the UK, Australia, and Argentina due to the historic precedent of past quotas. The EU and Brazil also previously held tariff-rate quotas, although they are currently less likely to receive any relief due to fraught relations.