Insight
April 9, 2018
A Closer Look at the Final 2018 Open Enrollment Report
On April 3, 2018, the Centers for Medicare and Medicaid Services released a report with enrollment data on the 2018 individual market.[1] When open enrollment ended in December, there were about 11.8 million plan selections, roughly 470,000 less than 2017, and premiums for selected plans had increased by 30 percent. More is going on, however, underneath the top-line numbers.
Results of the Significant Increases in Benchmark Premiums
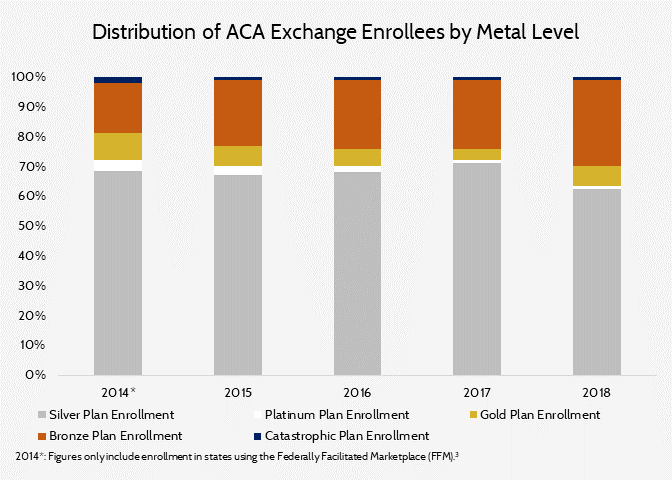
Entering into the 2018 open enrollment period, many speculated over how consumers in the Affordable Care Act’s (ACA) individual marketplaces would react to premium increases. More precisely, in the absence of cost-sharing reduction payments to insurers, benchmark Silver plan premiums saw an average increase of 36 percent across all rating areas, while the average lowest-cost Bronze and Gold plans saw premium increases of 20 percent. This disparity resulted in many rating areas offering Gold plans at a lower price than the benchmark Silver plan. As the benchmark plan for a rating area is used to determine the premium tax credit in that area, some projected that more consumers would opt for plans in other metal levels, attracted to either the plan’s much lower premium (in the case of Bronze plans) or for increased cost sharing (with a Gold plan).
Shuffling of Enrollment
Many enrollees did, in fact, decide against purchasing Silver plans in 2018, opting instead for Gold or Bronze plans. Gold enrollment increased by 68 percent and Bronze enrollment increased by 20 percent while Silver enrollment decreased by roughly 15 percent.[2]
Notably, the number of consumers who enrolled without receiving financial assistance has remained roughly constant, at about 2 million, despite average premiums for this cohort topping out at $522 per month. Because they bore the full brunt of premium increases, consumers ineligible for subsidies likely also face a limited number of financially viable insurance options. One piece of evidence is seen in the table below.

In 2016 and 2017 unsubsidized enrollment in Silver plans outpaced unsubsidized enrollment in Bronze plans by about 100,000 individuals in federally facilitated marketplaces.[3] In 2018, however, over 200,000 more unsubsidized enrollees purchased Bronze plans than Silver. This fact indicates that high Silver premiums served to push many subsidy-ineligible consumers into Bronze plans.
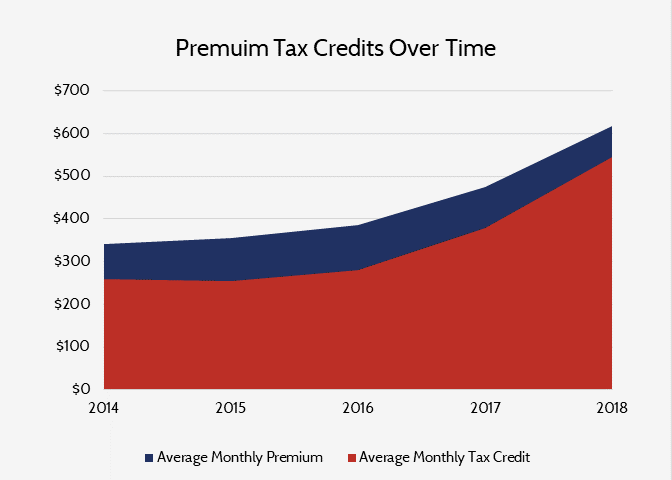
An Increase in Federal Tax Credit Spending
Premium increases in the exchanges are not only hurting consumers, but they are also becoming increasingly costly for the federal government. The ACA tax credit structure prevents those eligible for subsidies from paying premiums that are more than a certain percentage of their income, with the federal government paying for any excess above the threshold. As a result, the 30 percent increase in paid premiums for 2018 has turned into a 43 percent increase in subsidies for each eligible individual. Furthermore, the increase in subsidies will mean that federal spending on tax credits in 2018 will increase by roughly $17.8 billion, should the number of insured individuals receiving subsidies remain constant throughout 2018.
Looking Forward
Since its beginning, the ACA’s individual marketplace has struggled to provide affordable insurance options, especially to those ineligible for subsidies. Yet the market continues on, propped up by over $60 billion in premium tax credits from the federal government. Premiums have increased by over 60 percent over the last two years, the risk pool is getting older (29 percent of enrollees are now 55 or older), and competition among insurers is decreasing. Nevertheless, as long as the subsidy structure remains in place, people who are eligible will continue to have the means to purchase insurance through the individual marketplace. In the meantime, those ineligible for subsidies will suffer and taxpayers will continue to pay for increasing premiums.
[1] https://www.cms.gov/Newsroom/MediaReleaseDatabase/Fact-sheets/2018-Fact-sheets-items/2018-04-03.html
[2] https://www.cms.gov/Newsroom/MediaReleaseDatabase/Fact-sheets/2017-Fact-Sheet-items/2017-03-15.html
[3] Historical data for the ACA accessed at: https://aspe.hhs.gov/historical-research