Insight
April 1, 2020
EPA, DOT Finalize SAFE Vehicles Rule
EXECUTIVE SUMMARY
- The Safer, Affordable Fuel-Efficient Vehicles rule finalized by the Department of Transportation and the Environmental Protection Agency is the largest deregulatory action of the Trump Administration to-date, with estimated savings of nearly $200 billion.
- The rule modifies an Obama-era rule that would have increased vehicle fuel standards by 5 percent year-over-year, lowering that stringency to 1.5 percent annual increases for model years 2021-2026.
- This shift in standard levels means, among other things, a significant reduction in technology costs – and thus vehicle prices – but also potential reductions in cumulative fuel savings due to a less fuel-efficient fleet.
INTRODUCTION
The Department of Transportation (DOT) and the Environmental Protection Agency (EPA) (collectively, the agencies) finalized the most anticipated deregulatory action of the Trump Administration on March 31. The Safer, Affordable Fuel-Efficient (SAFE) Vehicles rule revises motor vehicle fuel efficiency standards first established by the Obama Administration.
The agencies estimate the rule will produce economic savings of nearly $200 billion, easily making it the largest deregulatory measure since the American Action Forum (AAF) began tracking rulemaking impacts in its database, RegRodeo.
SAFE VEHICLES RULE SUMMARY
The SAFE Vehicles rule is unique in that it involves two separate agencies working together to develop two sets of standards that, somehow approximate each other’s effects. DOT, through the National Highway Traffic Safety Administration is responsible for developing Corporate Average Fuel Efficiency standards, measured in miles per gallon. EPA is responsible for setting standards on carbon dioxide (CO2) emissions from vehicles, measured in grams per mile.
The agencies began collaborating on these standards during the Obama Administration, following a U.S. Supreme Court ruling that required EPA to set CO2 emissions standards for vehicles. The agencies issued a rule in 2012 that established standards for cars in model years (MY) 2017-2025. This rule remains the most expensive rule AAF has ever tracked. Of note, the standards for MY 2022-2025 applied only to EPA’s portion of the rule, as DOT is limited to setting standards in 5-year intervals. Therefore, DOT needed to issue an additional rulemaking to update these later-year standards.
In the last month of the Obama Administration, EPA issued a mid-term determination of its 2012 standards that found the 2022-2025 limits adequate in an attempt to lock in the standards. This determination, however, was issued more than a year ahead of the April 1, 2018 deadline. President Trump quickly ordered a new mid-term evaluation. EPA’s reevaluation found that the 2022-2025 standards were not appropriate.
Upon reaching that conclusion, the agencies issued a proposed rule for MY 2021-2026 in 2018. That proposal would have kept the standards for MY 2021 static through MY 2026, whereas the Obama Administration had the standards getting 5 percent more stringent every MY.
The final rule released March 31 deviates from the proposal but does not go as far as the Obama Administration. It increases stringency 1.5 percent each MY through 2026. The agencies expect this to result in about 2 billion additional barrels of fuel consumed and about 900 million more metric tons of CO2 emissions as compared to the Obama Administration standards.
The agencies concluded, however, that the economic savings of their rule outweigh the foregone fuel and CO2 emissions benefits. They estimate the total savings from the Obama-era standards to be between $181.5 billion (EPA’s emissions standards estimate) and $199.5 billion (DOT’s CAFE standards estimate), each at a 7 percent discount rate. On a per vehicle basis, the agencies estimate the cost of a typical new vehicle to be between $977 to $1,083 cheaper than under the Obama-era rule.
ANALYSIS OF COSTS AND BENEFITS
For those who have followed the progression of these standards, the cost-benefit analyses have been quite the roller coaster ride – especially considering their complexity and scale as compared to most other rulemakings. The proposed version of this rulemaking included cost savings and forgone benefits estimates on a far greater scale than even the 2012 rule. As of last month, press reports regarding draft versions of this final rule described cost-benefit calculations that somehow resulted in net costs. It is worth breaking down, in detail, how and why the agencies have arrived at their current estimates.
The following table lays out the overall framework that the agencies adopted in the proposed version of this rule. 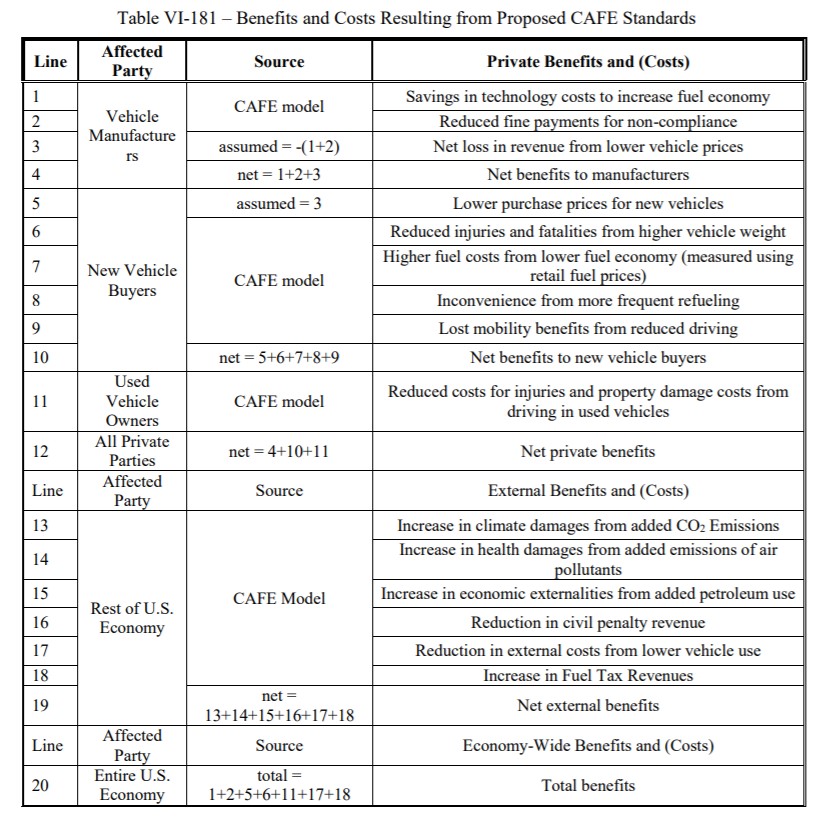
This rubric put the various cost and benefit components into 19 buckets that then added up to yield the total costs and benefits. Beyond simply the factors considered, the other crucial differences in assumptions from the Obama-era rule rested largely on two areas of analysis.
First, the agencies contended that the fuel market assumptions had changed drastically even since the 2012 rule (which based its assumptions on 2008 data) and that fuel prices going forward would continue to be much lower than the 2012 rule’s projections. Put another way: even if a more efficient car does not have to fill up as often, if the price of fuel is sufficiently low, the marginal difference in the fuel costs of it versus a less efficient car are going to be narrower and the consumer gets less of that “savings” benefit. Factor in the increased price of the vehicle itself and the consumer may not believe they are coming out ahead in their own cost-benefit balancing.
Second, the agencies adopted the stance that, since the costs of making vehicles more efficient would make them more expensive as well, consumers would tend to use older vehicles more (either those they already had or those they purchased on the used-vehicle market). Under this assumption, the agencies estimate that the consumer fleet would, on average, then not have the latest safety technology thus contributing to a higher volume of serious accidents and the commensurate health and economic costs.
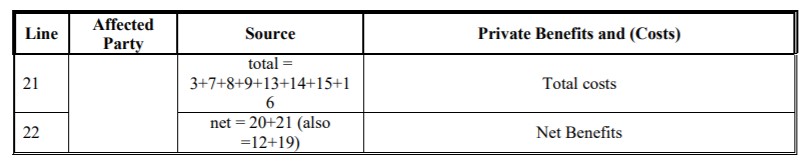
The final version of this rule largely maintains this conceptual framework. The shift in estimates, however, comes from some additional factors, updated data, and increased stringency vis-à-vis the proposed version. The follow table shows the final rule’s analytic framework.
Beyond the adjustments to the basic framework, the overall shift in estimates largely comes from newer data inputs and, of course, the final rule’s establishment of a 1.5 percent increase instead of the proposed version seeking no change in year-to-year fuel efficiency improvements. The changes in data are prohibitively expansive to discuss in depth here but illustrating the effect of the stringency change is relatively straightforward. The following table breaks down the agencies’ current estimates of the proposed and final rules’ impacts using the 2012 rule as a baseline.
| Line Item | Proposed CAFE ($B) | Proposed CO2 ($B) | CAFE ($B) | CO2 ($B) | Change in Final ($B) | Change in Final CO2 ($B) |
| Technology Costs | -117.8 | -102.8 | -100.6 | -86.3 | 17.2 | 16.5 |
| Implicit Opportunity Costs | 0 | 0 | 0 | 0 | 0 | 0 |
| Lost New Vehicle Consumer Surplus | -0.9 | -0.5 | -0.6 | -0.4 | 0.3 | 0.1 |
| Rebound Fatality Costs | -12.5 | -12.8 | -10.7 | -10.5 | 1.8 | 2.3 |
| Rebound Non-Fatal Crash Costs | -20.7 | -21.2 | -17.7 | -17.4 | 3 | 3.8 |
| Reduced Fuel Tax Revenue | -23 | -22.5 | -19.9 | -18.2 | 3.1 | 4.3 |
| Subtotal – Private Costs | -174.8 | -160 | -149.6 | -132.8 | 25.2 | 27.2 |
| Congestion Costs | -44.6 | -47 | -37.7 | -38.2 | 6.9 | 8.8 |
| Noise Costs | -0.3 | -0.3 | -0.2 | -0.2 | 0.1 | 0.1 |
| Non-Rebound Fatality Costs | -5.4 | -4.5 | -4.5 | -3.9 | 0.9 | 0.6 |
| Non-Rebound Non-Fatal Costs | -8.9 | -7.5 | -7.5 | -6.4 | 1.4 | 1.1 |
| Subtotal – External Costs | -59.1 | -59.3 | -49.9 | -48.7 | 9.2 | 10.6 |
| Total Costs | -234 | -219.3 | -199.5 | -181.5 | 34.5 | 37.8 |
| Retail Fuel Savings | -133.4 | -133.4 | -114.89 | -108.6 | 18.51 | 24.8 |
| Rebound Fuel Consumer Surplus | -35 | -37.8 | -29.4 | -30.1 | 5.6 | 7.7 |
| Refueling Time Benefit | -6.8 | -2.3 | -5.9 | -2.2 | 0.9 | 0.1 |
| Rebound Fatality Benefit | -11.2 | -11.6 | -9.6 | -9.5 | 1.6 | 2.1 |
| Rebound Non-Fatal Crash Benefit | -18.6 | -19.1 | -15.9 | -15.6 | 2.7 | 3.5 |
| Subtotal – Private Benefits | -205.1 | -204.2 | -175.7 | -166 | 29.4 | 38.2 |
| Petroleum Market Externality | -1.8 | -1.7 | -1.5 | -1.4 | 0.3 | 0.3 |
| CO2 Damage Reduction Benefit | -6.1 | -6 | -5.2 | -4.9 | 0.9 | 1.1 |
| NOX Damage Reduction Benefit | 0 | -0.1 | 0 | 0 | 0 | 0.1 |
| VOC Damage Reduction Benefit | 0 | 0 | 0 | 0 | 0 | 0 |
| PM Damage Reduction Benefit | -2 | -1.8 | -1.6 | -1.4 | 0.4 | 0.4 |
| SO2 Damage Reduction Benefit | -0.7 | -1 | 0.5 | -1.3 | 1.2 | -0.3 |
| Subtotal – External Benefits | -10.5 | -10.6 | -7.8 | -9 | 2.7 | 1.6 |
| Total Benefits | -215.6 | -214.8 | -183.5 | -175.1 | 32.1 | 39.7 |
*Some totals may not sum exactly due to rounding.
The difference between the CAFE and CO2 standards estimates is a function of each agency (DOT and EPA, respectively) examining different factors according to their legal and statutory requirements. Nevertheless, the trends in each are aligned directionally. The two main categories, on the cost and benefit sides, respectively, that see the largest increases under the final rule versus the proposed rule are technology costs and retail fuel savings. Simply put, these changes track logically with the idea that imposing some level of standards, however relatively modest, instead of ostensibly no standards will: A) drive increased costs for manufacturers and B) create upward pressure on fuel efficiency and thus some marginal fuel savings at the pump.
CONCLUSION
The SAFE Vehicles rule is the largest deregulatory action, by estimated savings, that the Trump Administration has finalized – by a factor of 20. As wild of a ride as this area of rulemaking has been, it is far from over. This rule saw nearly 800,000 comments in its docket. Litigation for and against it has surely already been drafted. While the agencies contend that this is the definitive standard, questions abound regarding the real-world implementation in the face numerous external factors. These factors include automakers’ own longer-term plans towards fuel efficiency, California establishing its own state standards and the preemption issues raised by that fact, and continued uncertainty regarding how the vehicle and fuel markets will actually look in 5 to 10 years from now.