Insight
December 15, 2025
Examining the Consequences of a High and Rising National Debt
Executive Summary
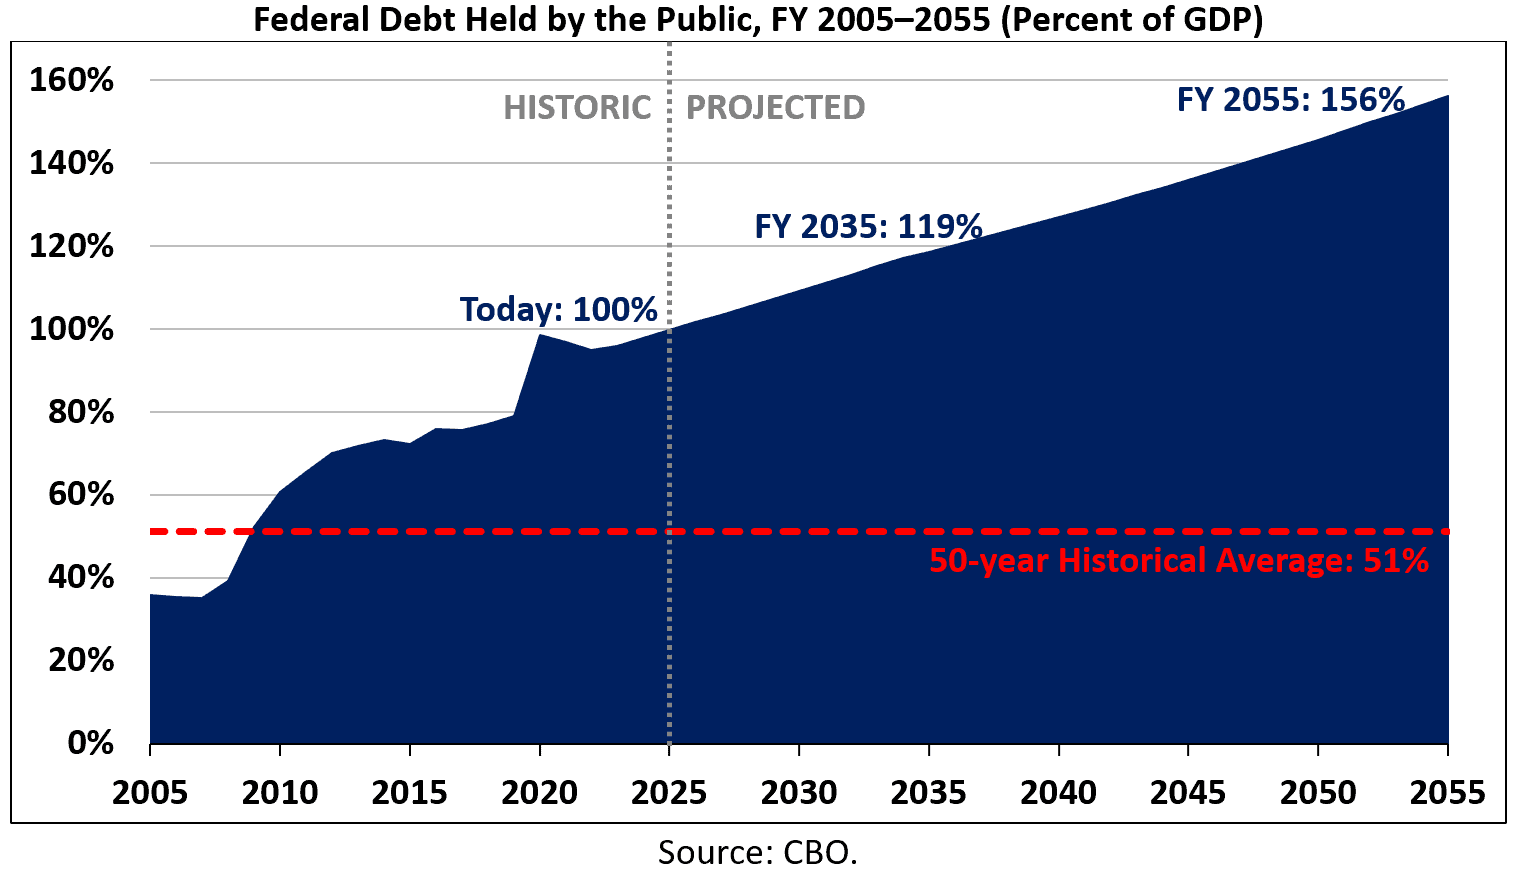
- One of the United States’ most pressing policy problems is its unsustainable fiscal outlook; the national debt currently equals 100 percent of gross domestic product (GDP) and is projected to grow to 119 percent of GDP by the end of fiscal year (FY) 2035 and to 156 percent of GDP by the end of FY 2055.
- Policymakers have long shown a clear unwillingness to earnestly address the nation’s debt load; since the turn of the century, policymakers from both sides of the aisle have favored enacting massive unpaid-for spending increases and tax reductions over long-term debt reduction.
- This insight describes the consequences of a high and rising national debt: slower income growth, increased interest payments on the debt, upward pressure on interest rates, reduced “fiscal space” to respond to national emergencies such as a recession or pandemic, an undue burden on future generations, and an increased risk of a fiscal crisis.
Introduction
One of the United States’ most pressing policy problems is its unsustainable fiscal outlook. The national debt currently equals 100 percent of the nation’s economic output and is projected to rise rapidly over both the short- and long-term.
Policymakers have long shown a clear unwillingness to earnestly address the nation’s debt load. Since the turn of the century, policymakers from both sides of the aisle have favored enacting massive unpaid-for spending increases and tax reductions over long-term debt reduction.
Allowing the national debt to continue to rise has a series of adverse and potentially dangerous consequences. A high and rising national debt slows income growth, increases interest payments on the debt, places upward pressure on interest rates, reduces the “fiscal space” to respond to national emergencies such as a recession or pandemic, places an undue burden on future generations, and increases the risk of a fiscal crisis.
This insight describes the consequences of a high and rising national debt.
The Nation’s Fiscal Challenges
The United States faces a litany of fiscal challenges, the most consequential of which is the unsustainable growth of the national debt. At the end of fiscal year (FY) 2025, federal debt held by the public[1] totaled $30.3 trillion – the equivalent of 100 percent of gross domestic product (GDP). The Congressional Budget Office (CBO) estimates the national debt will grow from 102 percent of GDP ($31.9 trillion) at the end of FY 2026 to a new record of 107 percent of GDP ($35.0 trillion) by the end of FY 2029. It will grow further to 119 percent of GDP ($52.1 trillion) by the end of FY 2035, to 136 percent of GDP ($85.5 trillion) by the end of FY 2045, and to 156 percent of GDP ($138.2 trillion) by the end of FY 2055.
Also, annual budget deficits will continue to grow over the near- and long-term. In FY 2025, the budget deficit totaled $1.8 trillion, or 5.9 percent of GDP. CBO estimates the budget deficit will total $2.5 trillion (5.8 percent of GDP) in FY 2035, $4.0 trillion (6.4 percent of GDP) in FY 2045, and $6.4 trillion (7.3 percent of GDP) in FY 2055.
Notably, annual deficits and the overall debt could grow more quickly, especially if future Congresses and presidents adopt new, fiscally imprudent tax and spending policies.
The Consequences of a High and Rising National Debt
Slower Income Growth
A high and rising national debt slows income and wage growth. High debt reduces future incomes by exacerbating a phenomenon known as “crowd out,” whereby the availability of government debt and changes in interest rates leads investors to devote an increasing share of their savings to the purchase of Treasury securities rather than making productive investments in private capital.
The national debt is currently 100 percent of GDP and CBO projects it will grow to 156 percent of GDP by the end of FY 2055. If one assumes that subsequent increases in debt do not crowd out private investment, CBO estimates that average income – as measured by gross national product (GNP)[2] per capita – in calendar year (CY) 2025 inflation-adjusted dollars would increase by $49,900, from $89,900 in CY 2025 to $139,900 in CY 2055.
CBO’s baseline assumes that for every new dollar of government borrowing, private investment falls by 33 cents. After incorporating the effects of the crowd out phenomenon to reflect CBO’s assumption, average income would increase by just $41,900 in CY 2055, from $89,900 in CY 2025 to $131,800 in CY 2055. In other words, rising debt under current law would reduce CY 2025–2055 income growth by 16 percent and reduce income in CY 2055 by nearly 6 percent.
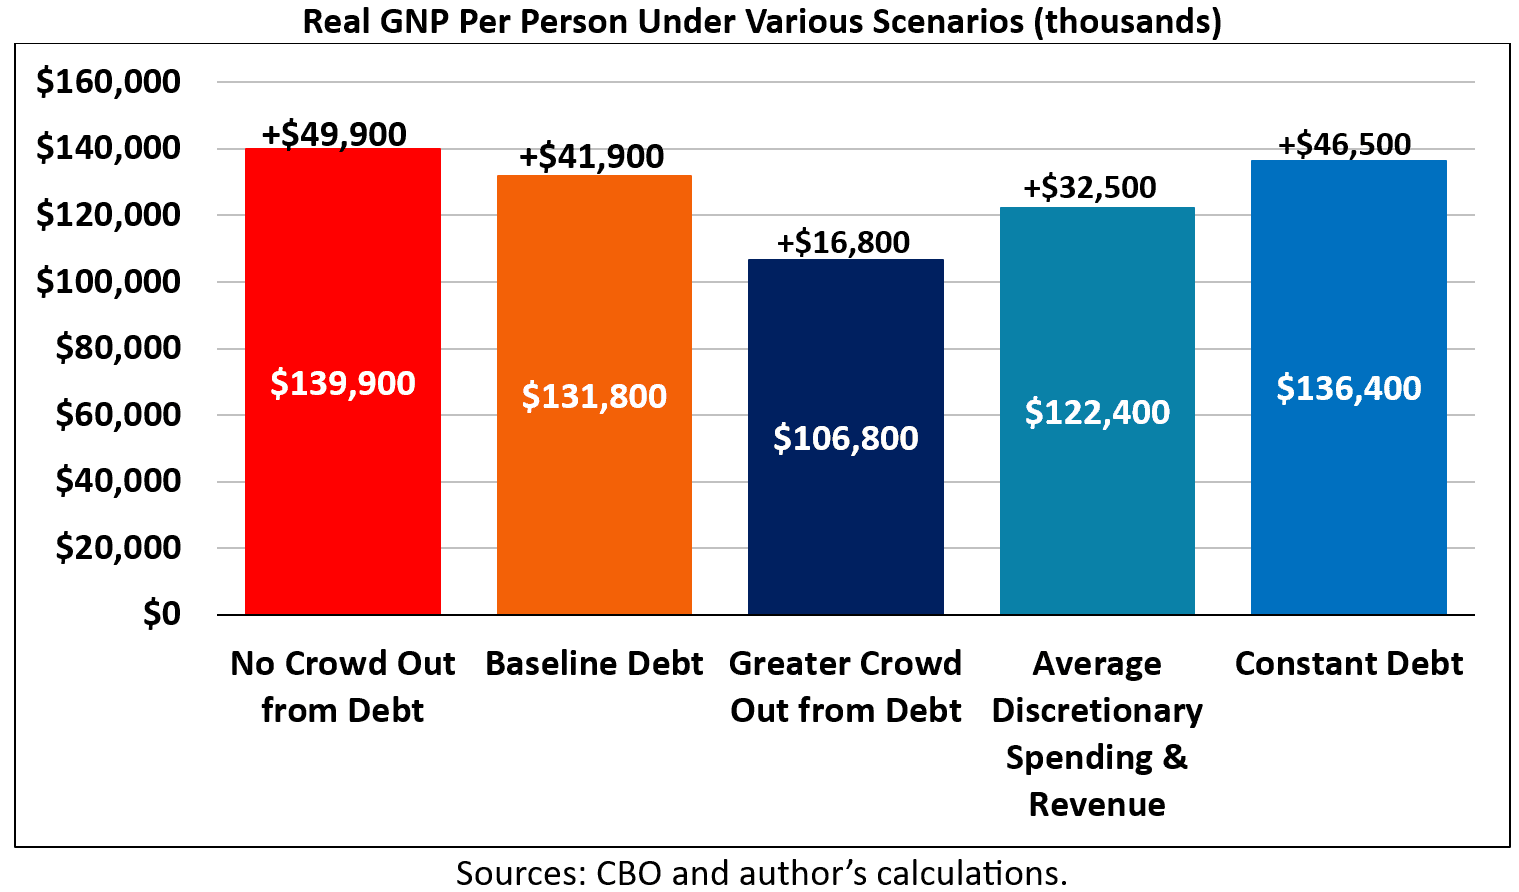
Additional increases in the debt would further erode income growth. For example, if revenue and discretionary spending were held constant at their 30-year historical averages of 17.2 percent of GDP and 7.0 percent of GDP, respectively, through FY 2055, average income would increase by an estimated $32,500, from $89,900 in CY 2025 to $122,400 in CY 2055. This means faster rising debt would reduce CY 2025–2055 income growth by 35 percent and reduce income in CY 2025 by over 12 percent.
Conversely, taking steps to either stabilize the debt or reduce it would minimize the effect of debt on income growth. For example, if the debt were held constant at its current level of 100 percent of GDP, average income would increase by $46,500, from $89,900 in CY 2025 to $136,400 in CY 2055. As a result, CY 2025–2055 income growth would be 11 percent greater and income in CY 2055 would be nearly 4-percent larger than in CBO’s baseline.
Notably, the actual effects of debt on income could be higher than conventional models assume. For example, if CBO underestimates the crowd-out effect and it is twice as strong as CBO assumes, meaning that for every new dollar of government borrowing private investment falls by 66 cents, average income would grow by just $16,900, from $89,900 in CY 2025 to $106,800 in CY 2055. Put differently, stronger crowd-out would reduce CY 2025–2055 income growth by an estimated 66 percent and reduce income in CY 2055 by nearly 24 percent.
Increasing Interest Payments
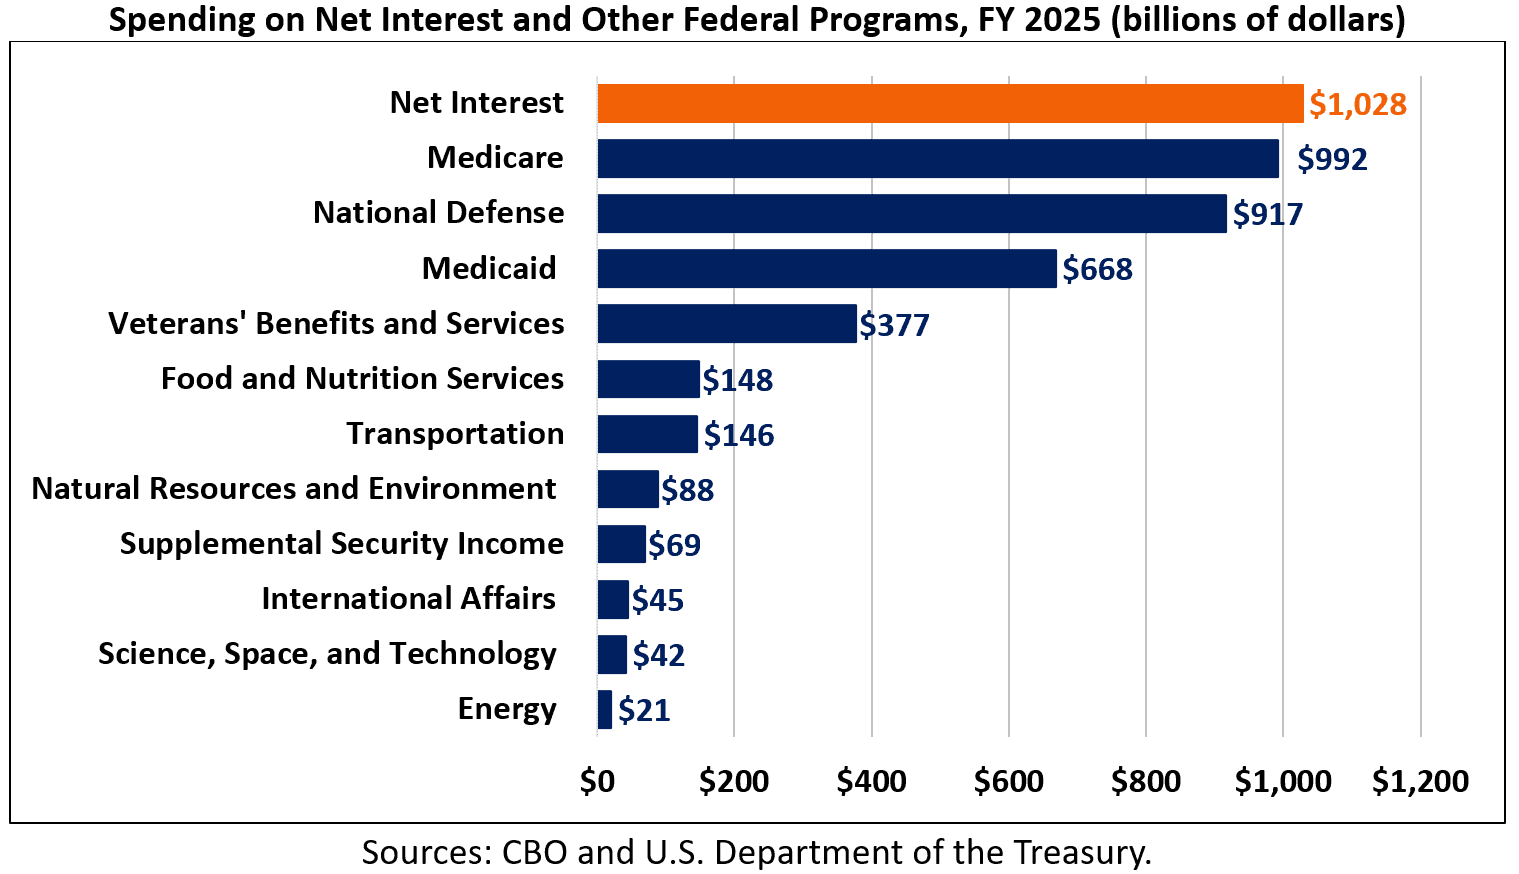
As the national debt continues to rise, so will the cost of servicing that debt through interest payments. CBO estimates the federal government spent $1 trillion on interest payments in FY 2025, which was $79 billion more than the $949 billion it spent in FY 2024. Net interest was the second-largest government expenditure in FY 2025, behind only Social Security, and totaled nearly one-fifth of all federal revenue collections.
The federal government currently spends more on interest payments than it does on Medicare, national defense, Medicaid, veterans’ benefits and services, food and nutrition services, transportation, and science, space, and technology, among other federal programs.
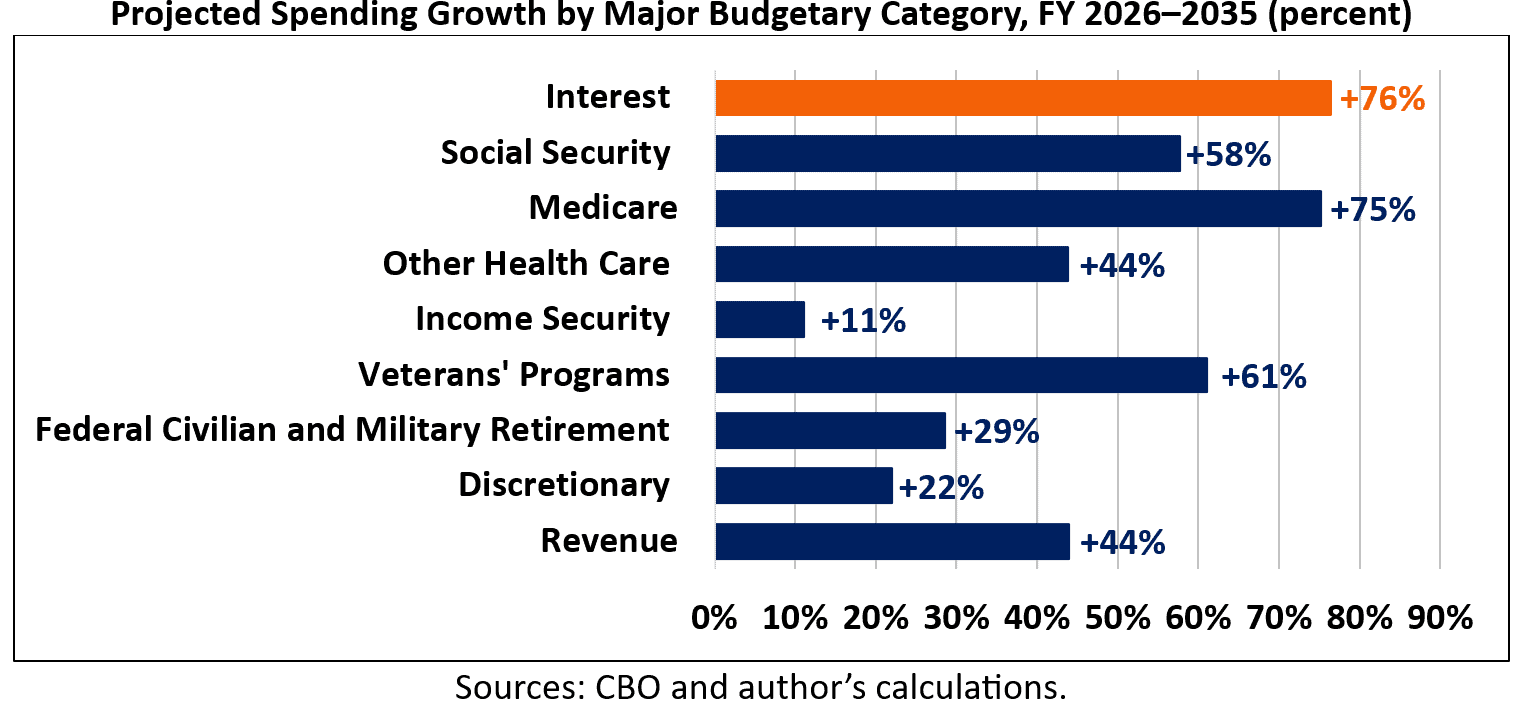
Over the FY 2026 to FY 2035 budget window, CBO estimates interest payments will grow faster than any other major budgetary category. Net interest will grow by 76 percent, rising from $1.0 trillion (3.2 percent of GDP) in FY 2026 to $1.8 trillion (4.1 percent of GDP) in FY 2035. Social Security spending will increase by 58 percent, Medicare spending by 75 percent, and spending on other health care (Medicaid, the Children’s Health Insurance Program, and the Affordable Care Act exchanges) will grow by 55 percent. Spending on income security programs (including the Supplemental Nutrition Assistance Program and Supplemental Security Income) will increase by 11 percent, spending on veterans’ benefits and services will grow by 61 percent, and discretionary spending will increase by 22 percent. Federal revenue collections are projected to grow by 44 percent, which is well below the projected growth of net interest and many categories of federal spending.
As debt continues to rise over the long term, so will interest payments. CBO estimates net interest will total $2.9 trillion (4.6 percent of GDP) in FY 2045 and $4.8 trillion (5.4 percent of GDP) in FY 2055.
Framed another way, interest payments currently equal about 20 percent of all federal revenue collections[3], about twice the 10 percent of revenue net interest totaled in FY 2022. Within a decade, net interest will consume over 22 percent of all revenue. Within three decades, interest payments will equal 28 percent of all revenue.
The more money the federal government spends on interest payments, the less that is available to fund other priorities or make investments in the nation’s future. Each dollar spent on interest is a dollar unavailable to spend on other national priorities.
Upward Pressure on Interest Rates
A high and rising national debt can push up interest rates because of how Treasury securities function in financial markets. When the federal government runs large budget deficits, it must issue more Treasury securities to finance its spending. A greater supply of Treasury securities means the government often has to offer higher interest rates to attract enough buyers – especially when investors express concern about long-term fiscal discipline in the United States. Since Treasury yields serve as a benchmark for many other interest rates throughout the economy, higher Treasury yields can push up interest rates on mortgages, car loans, student loans, business loans, and credit card debt.
Another important channel is investors’ perception of risk. Treasury securities are considered one of the safest assets to hold. Rising debt levels, however, can make investors cautious about future inflation, fiscal sustainability, or political gridlock around controlling budget deficits. If investors suspect the United States may rely more heavily on inflation or persistent deficit spending, they may demand a higher “risk premium” to hold U.S. debt. The added premium materializes as higher interest rates on Treasury securities, which then permeate into the broader economy.
High federal borrowing may also contribute to “crowding out.” In a scenario where the government absorbs a large share of available savings to finance its deficits, fewer funds are left for private borrowers. This increased competition for capital tends to raise the cost of borrowing. For businesses, higher interest rates can discourage investment; for households, they can make major purchases more expensive. Over time, slower private-sector investment may reduce economic growth, leading to a vicious cycle in which it is even harder to manage the existing debt burden.
Reduced “Fiscal Space”
During economic recessions, wars, pandemics, and other emergencies, it may be necessary or even desirable for the United States to run large budget deficits. For example, during the Great Recession and the COVID-19 pandemic, the country ran large deficits to combat these crises. If debt and deficits are higher when the United States enters a crisis, however, there is less “fiscal space” available to combat it and future crises.
There is no single definition of fiscal space. Broadly, it can be thought of as the amount of money the federal government can borrow. More specifically, it can refer to the amount of additional borrowing the government can take on before it defaults, or a fiscal crisis materializes, or economic growth significantly slows, or a debt spiral becomes unavoidable, or debt reduction becomes unachievable, or the political system no longer supports additional borrowing.
When the United States entered the Great Recession, federal debt held by the public totaled 35 percent of GDP. At the time, debt was below the 50-year historical average and 71 percent of GDP below the record of 106 percent of GDP set just after World War II in FY 1946. By FY 2012, the United States had borrowed an additional 35 percent of GDP to respond to the Great Recession. More recently, the United States entered the COVID-19 pandemic with a debt-to-GDP ratio of 79 percent. While this was above the 50-year historical average, it was still 27 percent of GDP below the record. By FY 2022, the federal government had borrowed an additional 16 percent of GDP to combat the pandemic, along with other spending, pushing debt-to-GDP to 95 percent.
Today, debt is 100 percent of GDP, which is nearly twice the 50-year historical average and just 6 percent of GDP below the record level. This and the projected growth of the national debt over the near- and long-term create uncertainty over whether the United States will be able to respond to future crises in the same way it has responded to past ones.
Though there is no way of knowing exactly how much fiscal space the United States has, one illustrative measure is the room before reaching the record debt level of 106 percent of GDP. Though this measure is unlikely to represent an economic constraint on borrowing, it does represent when debt-to-GDP will be unprecedented and could represent a political constraint on borrowing.
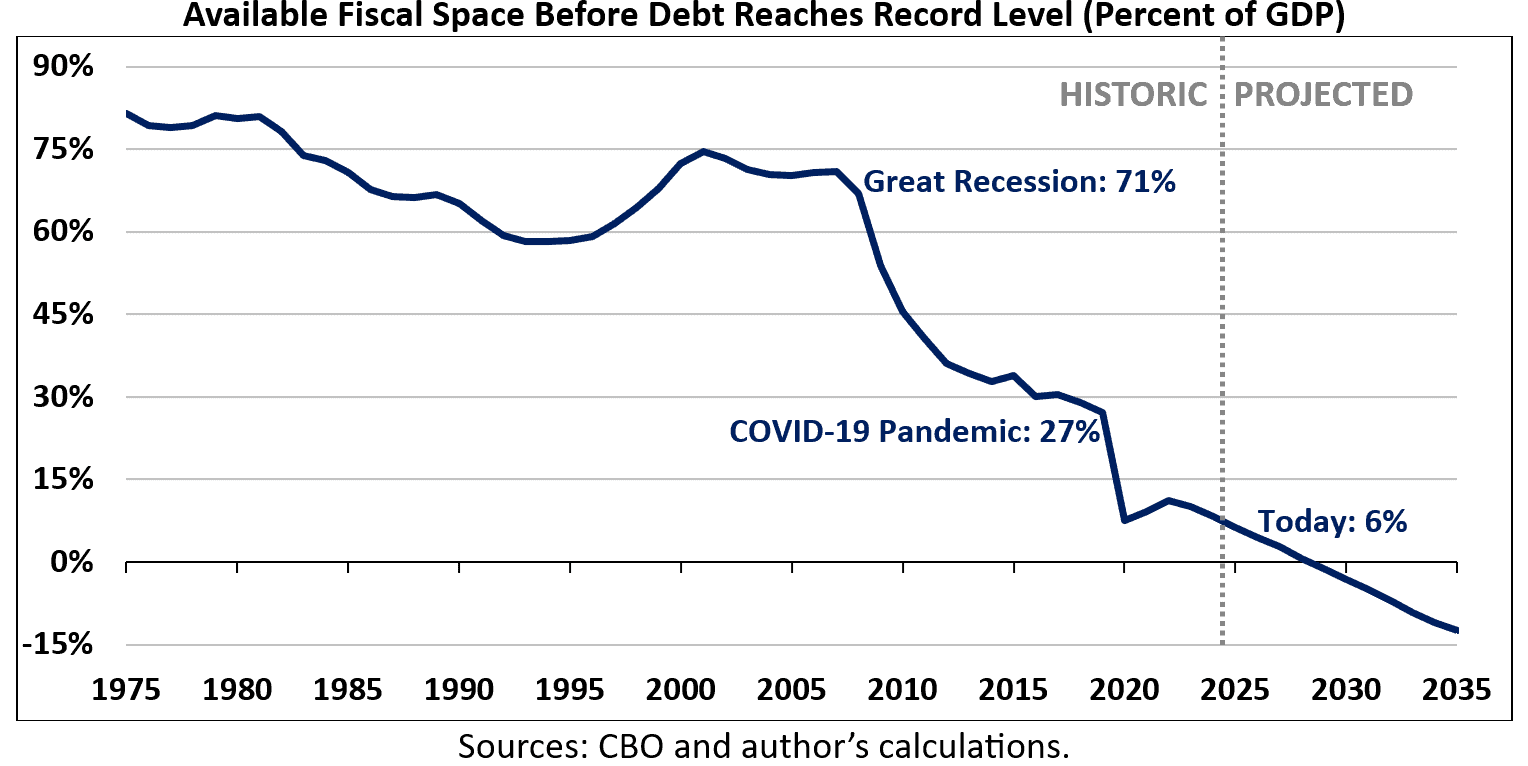
Under this illustrative measure, the United States had 71 percent of GDP of fiscal space when it entered the Great Recession. At the onset of the COVID-19 pandemic, it had 27 percent of GDP. Today, the available fiscal space totals only 6 percent of GDP and will decline to 1 percent of GDP by FY 2028 before virtually disappearing in FY 2029 when the United States is projected to reach a new record debt level of 107 percent of GDP. This will make it increasingly difficult for the country to respond to future recessions, pandemics, or other emergencies.
Undue Burden on Future Generations
The United States’ high debt load exacerbates generational imbalances. These imbalances will ultimately burden younger and future generations with higher interest payments, slower economic growth, slower income growth, and a greater burden to bear for future tax or spending changes.
The federal budget is skewed in favor of spending on seniors and adults over children. To illustrate, CBO estimates the federal government spent $1.6 trillion on Social Security benefits and $992 billion on Medicare benefits in FY 2025 – programs that primarily benefit seniors and adults. In contrast, the government spent $33 billion on child nutrition programs, $43 billion on elementary and secondary education, and $23 billion on the Children’s Health Insurance Program – programs that primarily benefit children.
Also, the federal budget favors today’s consumption over investments in the future. As the debt continues to grow, a larger share of federal revenues will need to go toward interest payments on the debt instead of funding other priorities. Without significant policy changes to reduce debt growth, future generations will inherit a budget where significant resources are locked into servicing past borrowing. As interest costs rise, the federal government will have less money available for education, infrastructure, or scientific research – areas that directly support long-term prosperity. Future taxpayers will face higher tax burdens or reduced government services simply to cover the costs created by previous budget deficits.
High debt can also slow long-term economic growth, impacting younger and future generations. If government borrowing pushes interest rates up, it will discourage private investment by making it more expensive for businesses and households to borrow. Lower private investment will ultimately reduce the growth in productivity, wages, and job opportunities for younger and future generations. Slower long-term growth will also make the debt load more difficult to manage over time.
Increased Risk of a Fiscal Crisis
Despite a high debt load, the risk of a fiscal crisis in the United States remains low for several reasons. For one, the United States borrows in its own currency, which makes default or insolvency highly unlikely. In addition, the fact that Treasury securities are viewed by investors as one of the safest assets to hold, the dollar is a centerpiece of the global financial system, and the Federal Reserve conducts independent monetary policy mitigates the risk of a near-term crisis.
Of course, the risk of a near-term crisis could increase unexpectedly. CBO and others understand there is no way to realistically or reliably quantify the probability of a fiscal crisis. There exists no clear tipping point at which debt-to-GDP becomes so high that a crisis becomes highly likely or imminent. Nor is there a tipping point at which interest payments as a share of GDP become so high that debt service itself is unsustainable.
A fiscal crisis in the United States could take several forms. For example, a crisis could stem from an erosion of investor confidence and financial market pressures. While Treasury securities are considered one of the safest assets to hold, a high debt loan can erode this perception over time. If interest rates rise and remain elevated for an extended period, investors could grow weary of the federal government’s long-term fiscal position, which could erode the value of the country’s debt around the world and trigger the selloff of federal securities. Given the central role Treasury securities play in financial markets, the result could be a global financial crisis.
A fiscal crisis could also stem from rapid inflation. If government borrowing is substantially high or the demand for the country’s debt substantially low, the federal government may find itself printing money to pay its debt. Though countries often engage in modest monetary expansion without significant disruptions, a scenario where the United States is continuously and rapidly increasing its money supply to fund increasing deficits and debt could spur hyperinflation.
Conclusion
One of the United States’ most pressing policy problems is its unsustainable fiscal outlook, yet policymakers have long been unwilling to earnestly address it. Allowing the national debt to continue to rise has a series of adverse and potentially dangerous consequences: slower income growth, increased interest payments on the debt, upward pressure on interest rates, reduced the fiscal space to respond to national emergencies such as a recession or pandemic, an undue burden on future generations, and an increasing risk of a fiscal crisis. Instead of favoring unpaid-for spending increases or tax cuts, policymakers should favor long-term debt reduction.
Endnotes
[1] There are two widely cited measures of the national debt: gross debt and debt held by the public. Gross debt – currently $38.4 trillion – is all the federal government’s debt outstanding, including what it owes itself. Debt held by the public – currently $30.8 trillion – is all of the debt the federal government owes to those outside of the government, including individuals, foreign governments and individuals, banks, insurance companies, state and local governments, pension funds, and mutual funds. This insight uses debt held by the public as its preferred measure of the national debt. Debt held by the public is considered the most economically meaningful measure of the nation’s debt and is thus relevant for understanding the extent to which debt is crowding out private investment, influencing interest rates, and consuming fiscal space.
[2] Gross national product is a measure of a country’s economic output, standard of living, and growth. In this scenario, it serves as a proxy for personal income since GNP measures the total earnings of a country’s residents from all methods of production.
[3] When Moody’s downgraded the United States’ credit rating from Aa1 to Aaa in May, it cited the growing ratio of net interest to revenue as a contributing factor.