


Insight
March 9, 2023
Highlights of the FY2024 President’s Budget
By the Numbers
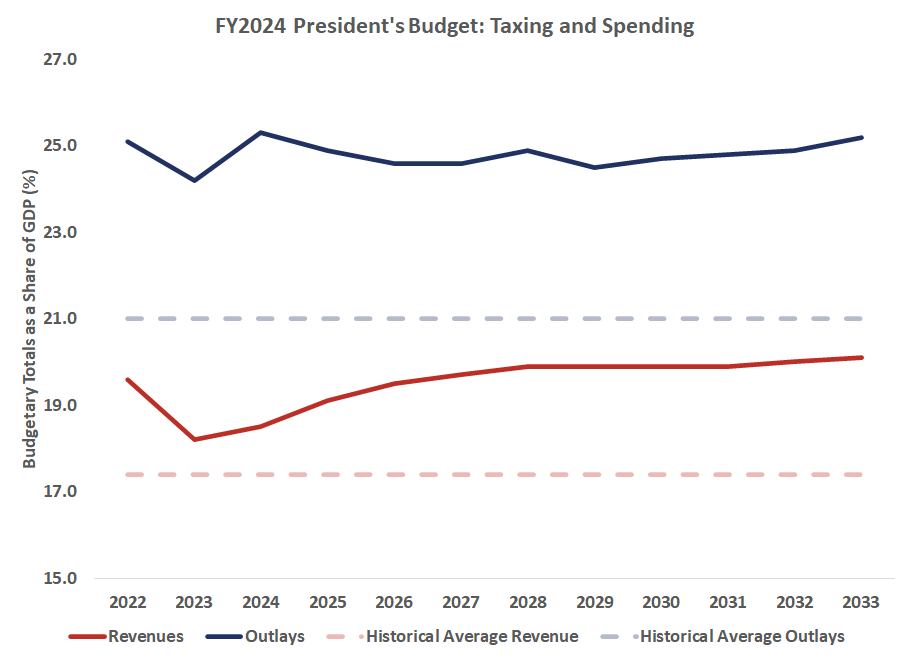
Taxes: The President’s Budget includes substantially increased tax revenue, both as a function of assumed growth and through proposed tax increases. The Office of Management and Budget (OMB) estimates that the President’s Budget proposes $4.7 trillion in higher tax collections relative to OMB’s baseline. Revenues in the President’s Budget are projected to increase as a share of gross domestic product (GDP), from 18.2 percent – healthily above the 50-year average of 17.4 percent – to 20.1 percent of GDP, nearly 3 percentage points above the 50-year average. Over 10 years, the budget proposes an average level of taxation of 19.7 percent, higher than any 10-year period in the history of the modern U.S. tax system.
Spending: By the end of the budget window, the President’s Budget would increase spending by nearly $1.9 trillion compared to OMB’s baseline. As a share of GDP, spending would reach 25.2 percent of GDP, over 4 percentage points higher than the 50-year average, by 2033. Over the next decade, spending would average 24.8 percent of GDP.
Deficits: The President’s Budget assumes projected deficits totaling $17.1 trillion over the next decade. OMB estimates the deficit will increase from $1.6 trillion this year to over $2.0 trillion in 2033. Deficits are projected to exceed $1.5 trillion every year over the next decade.
Interest Payments: Interest payments on the debt will reach $1.3 trillion in 2033. This reflects a doubling of debt service costs, from $661 billion in 2023. The $1.3 trillion debt service costs would exceed the budget of all federal agencies by the end of the budget window.
Debt Held by the Public: Borrowing from the public would increase as a share of the economy under the President’s Budget, rising from 98.4 percent of GDP in FY2023 to 110.0 percent of GDP in 2033. Even during World War II, the debt never reached this level.
Economic Projections
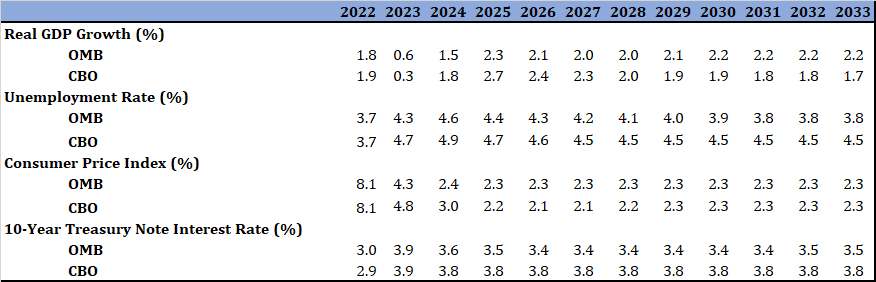
The President’s Budget includes more optimistic economic projections on average than does the Congressional Budget Office’s (CBO) February forecast in terms of real GDP growth, unemployment, and interest rates. Under the President’s Budget, real GDP is assumed to grow slightly faster than forecast by CBO, while OMB assumes, on average, 0.5 percent lower unemployment and 0.3 percent lower interest rates on the 10-year note. OMB and CBO’s forecasts for inflation are, on average, the same over the budget window, but differ in pattern. These effects combine to increase tax revenues and reduce debt service.
