Insight
April 15, 2021
Nutrition Requirements of the School Meal Programs
Executive Summary
- For nearly 30 million students, particularly low-income students, two out of three weekday meals are typically provided by their school during the school year.
- In 2010, Congress mandated reforms to improve the nutritional standards of school lunches and breakfasts, partly out of concern of rising childhood obesity rates.
- Despite these changes, many students are likely still not consuming adequate amounts of vegetables and meats at school to have a healthy diet.
Background and Program Context
In the United States, more than a third of children live in households with income below 200 percent of the federal poverty level (FPL) and thus are likely to qualify for subsidized meals through the National School Lunch and Breakfast Programs. The National School Lunch Program (NSLP) serves 29.6 million students daily (as of 2019) and the School Breakfast Program (SBP) serves 14.8 million students daily, out of roughly 56 million schoolchildren in the country.[i] Families at or below 130 percent FPL are eligible for free meals, while those between 130 and 185 percent are eligible for reduced price meals.
Following years of increasing childhood obesity, Congress made major reforms to the nutritional standards of the NSLP and the SBP by passing the Healthy, Hunger-Free Kids Act in 2010.[ii] After implementation of these reforms, Healthy Eating Index scores increased from 58 percent to 82 percent for the NSLP and from 50 percent to 71 percent for the SBP.[iii] Nevertheless, schools are still not providing enough of certain foods for students to have a balanced diet.
Nutrition Requirements
Both the NSLP and SBP provide detailed instructions for what food components schools must serve to each specific age group, in what quantities, and which foods count and do not count for meeting the requirements for reimbursement.
Prior to 2010, nutritional standards limited sales of foods and beverages that did not provide at least 10 percent of the Recommended Daily Allowances of certain vitamins, minerals, or protein. These standards did not, however, consider the food’s calories, saturated fat content, or sodium levels.[iv]
The current general nutrition requirements for the two programs can be seen in the charts below, reflecting the 2010 updates. Changes included requirements to provide more fruits and vegetables (while limiting starchy vegetables) and more whole grains, including only whole grains at lunch and at least half whole grains at breakfast; more appropriate serving sizes based on age; and only low-fat or fat-free milk.[v] The new regulations also established nutrition standards for snacks as well as foods and beverages served a la carte, separate from the official school lunch and breakfast programs, limiting the sugar and calorie content that foods could contain.[vi] The new regulations also required schools to reduce the levels of sodium and saturated and trans fats.[vii]
Quantities and requirements of each required food component differ by grade levels as well as by meal. For example, breakfast requirements allow for vegetables to count toward the fruit requirement and for meat and meat alternatives to count toward the grain requirement. As of February 2019, half of all weekly grains must be “whole grain-rich” and milk options can include flavored low-fat milk. Further requirements include no added trans fats and gradual reductions in sodium in meals (the Trump Administration delayed the previously set benchmarks on sodium in February 2019 for several years).
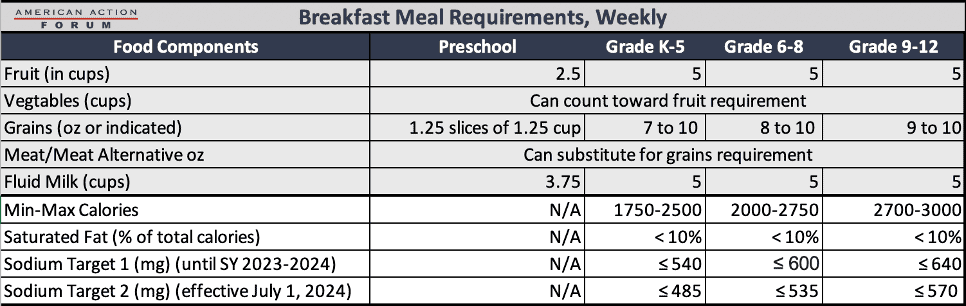
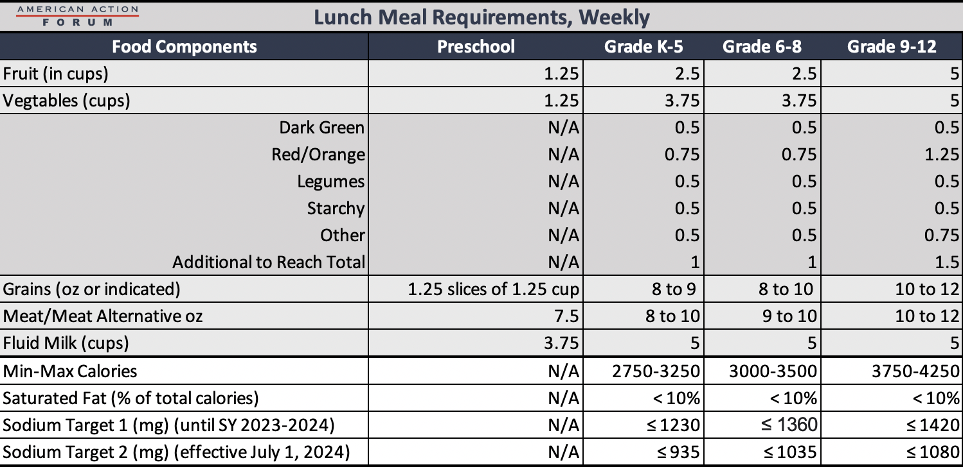
Source: https://fns-prod.azureedge.net/sites/default/files/dietaryspecs.pdf
Impacts of the Standards
While these standards are healthier, some have argued it also means students may not eat as much of their meal. A study of elementary and middle-school students conducted after the new nutrition standards were enacted found that few students’ nutrition intake during lunch met the new, or even the previous, nutrition standards. Elementary students in the study were found to have wasted over one third of their grain, fruit, and vegetable servings; the findings were similar if not worse for middle-school students. These results raised the question of how effective these new standards are, both in terms of raising nutrition levels and cost, which is what prompted the Trump Administration to delay implementation of the strictest sodium benchmarks.
Other studies did not find similar waste, however. One study by Mathematica conducted on behalf of the U.S. Department of Agriculture suggests food waste has not increased with the new standards.[viii] Another study found that in fact vegetable and entrée consumption increased by 16 percent and fruit consumption remained the same.[ix]
Comparison of School Nutrition Standards to General Dietary Guidelines
For context, the nutrition standards of the NSLP and SBP can be compared to the diet recommendations from the Dietary Guidelines for Americans 2020-2025. These guidelines provide wide ranges for recommended caloric intake depending on gender, age, and height/weight; the below charts examine 1,400, 2,000, and 2,400 calorie diets. Included is the recommended food intake for a five-day period by various age groups, compared to the amount provided through the combination of the SBP and NSLP requirements for those age groups in a five-day period.
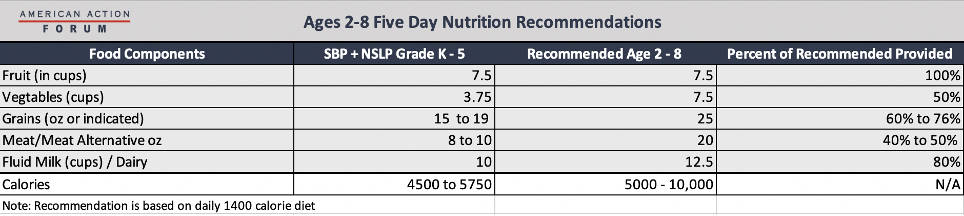
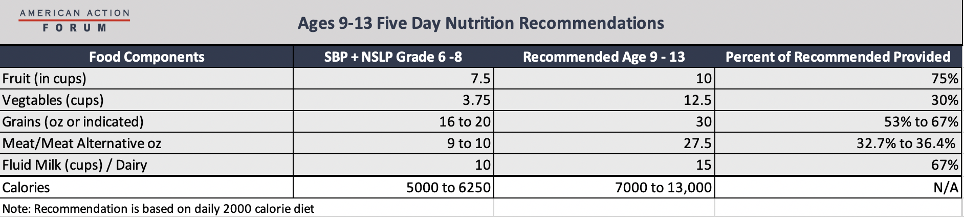

This comparison shows the school food program nutrition requirements do not fully satisfy children’s total nutritional needs. While the balance may be made up during dinner, particularly for some components where at least two-thirds of the recommendation is met—such as fruits, grains, and milk or dairy—children are likely not receiving other components—such as meats and vegetables—in a high enough quantity for dinner to fill the gap. This challenge is particularly relevant for low-income children who are most likely to rely on school meals. Studies suggest that low-income households do not purchase as many healthful foods, including fewer fruits and vegetables, and purchase more high-sugar beverages than comparably higher-income households.[x]
[i] https://www.americanactionforum.org/research/primer-school_breakfast_program_national_lunch_program/
[ii] https://www.ncbi.nlm.nih.gov/pmc/articles/PMC6716573/
[iii] https://www.mathematica.org/news/school-meals-are-healthier-after-major-nutrition-reforms
[iv] https://www.ncbi.nlm.nih.gov/pmc/articles/PMC6716573/#bib11
[v] https://www.healthaffairs.org/doi/10.1377/hlthaff.2020.00133
[vi] https://www.healthaffairs.org/doi/10.1377/hlthaff.2020.00133
[vii] https://www.federalregister.gov/documents/2012/01/26/2012-1010/nutrition-standards-in-the-national-school-lunch-and-school-breakfast-programs
[viii] https://fns-prod.azureedge.net/sites/default/files/resource-files/SNMCS_Summary-Findings.pdf
[ix] https://pubmed.ncbi.nlm.nih.gov/24650841/
[x] https://bmcpublichealth.biomedcentral.com/articles/10.1186/s12889-019-6546-2#